


Anant Raj Ltd (ANANTRAJ)
Stock Analysis Report
Stock Journey
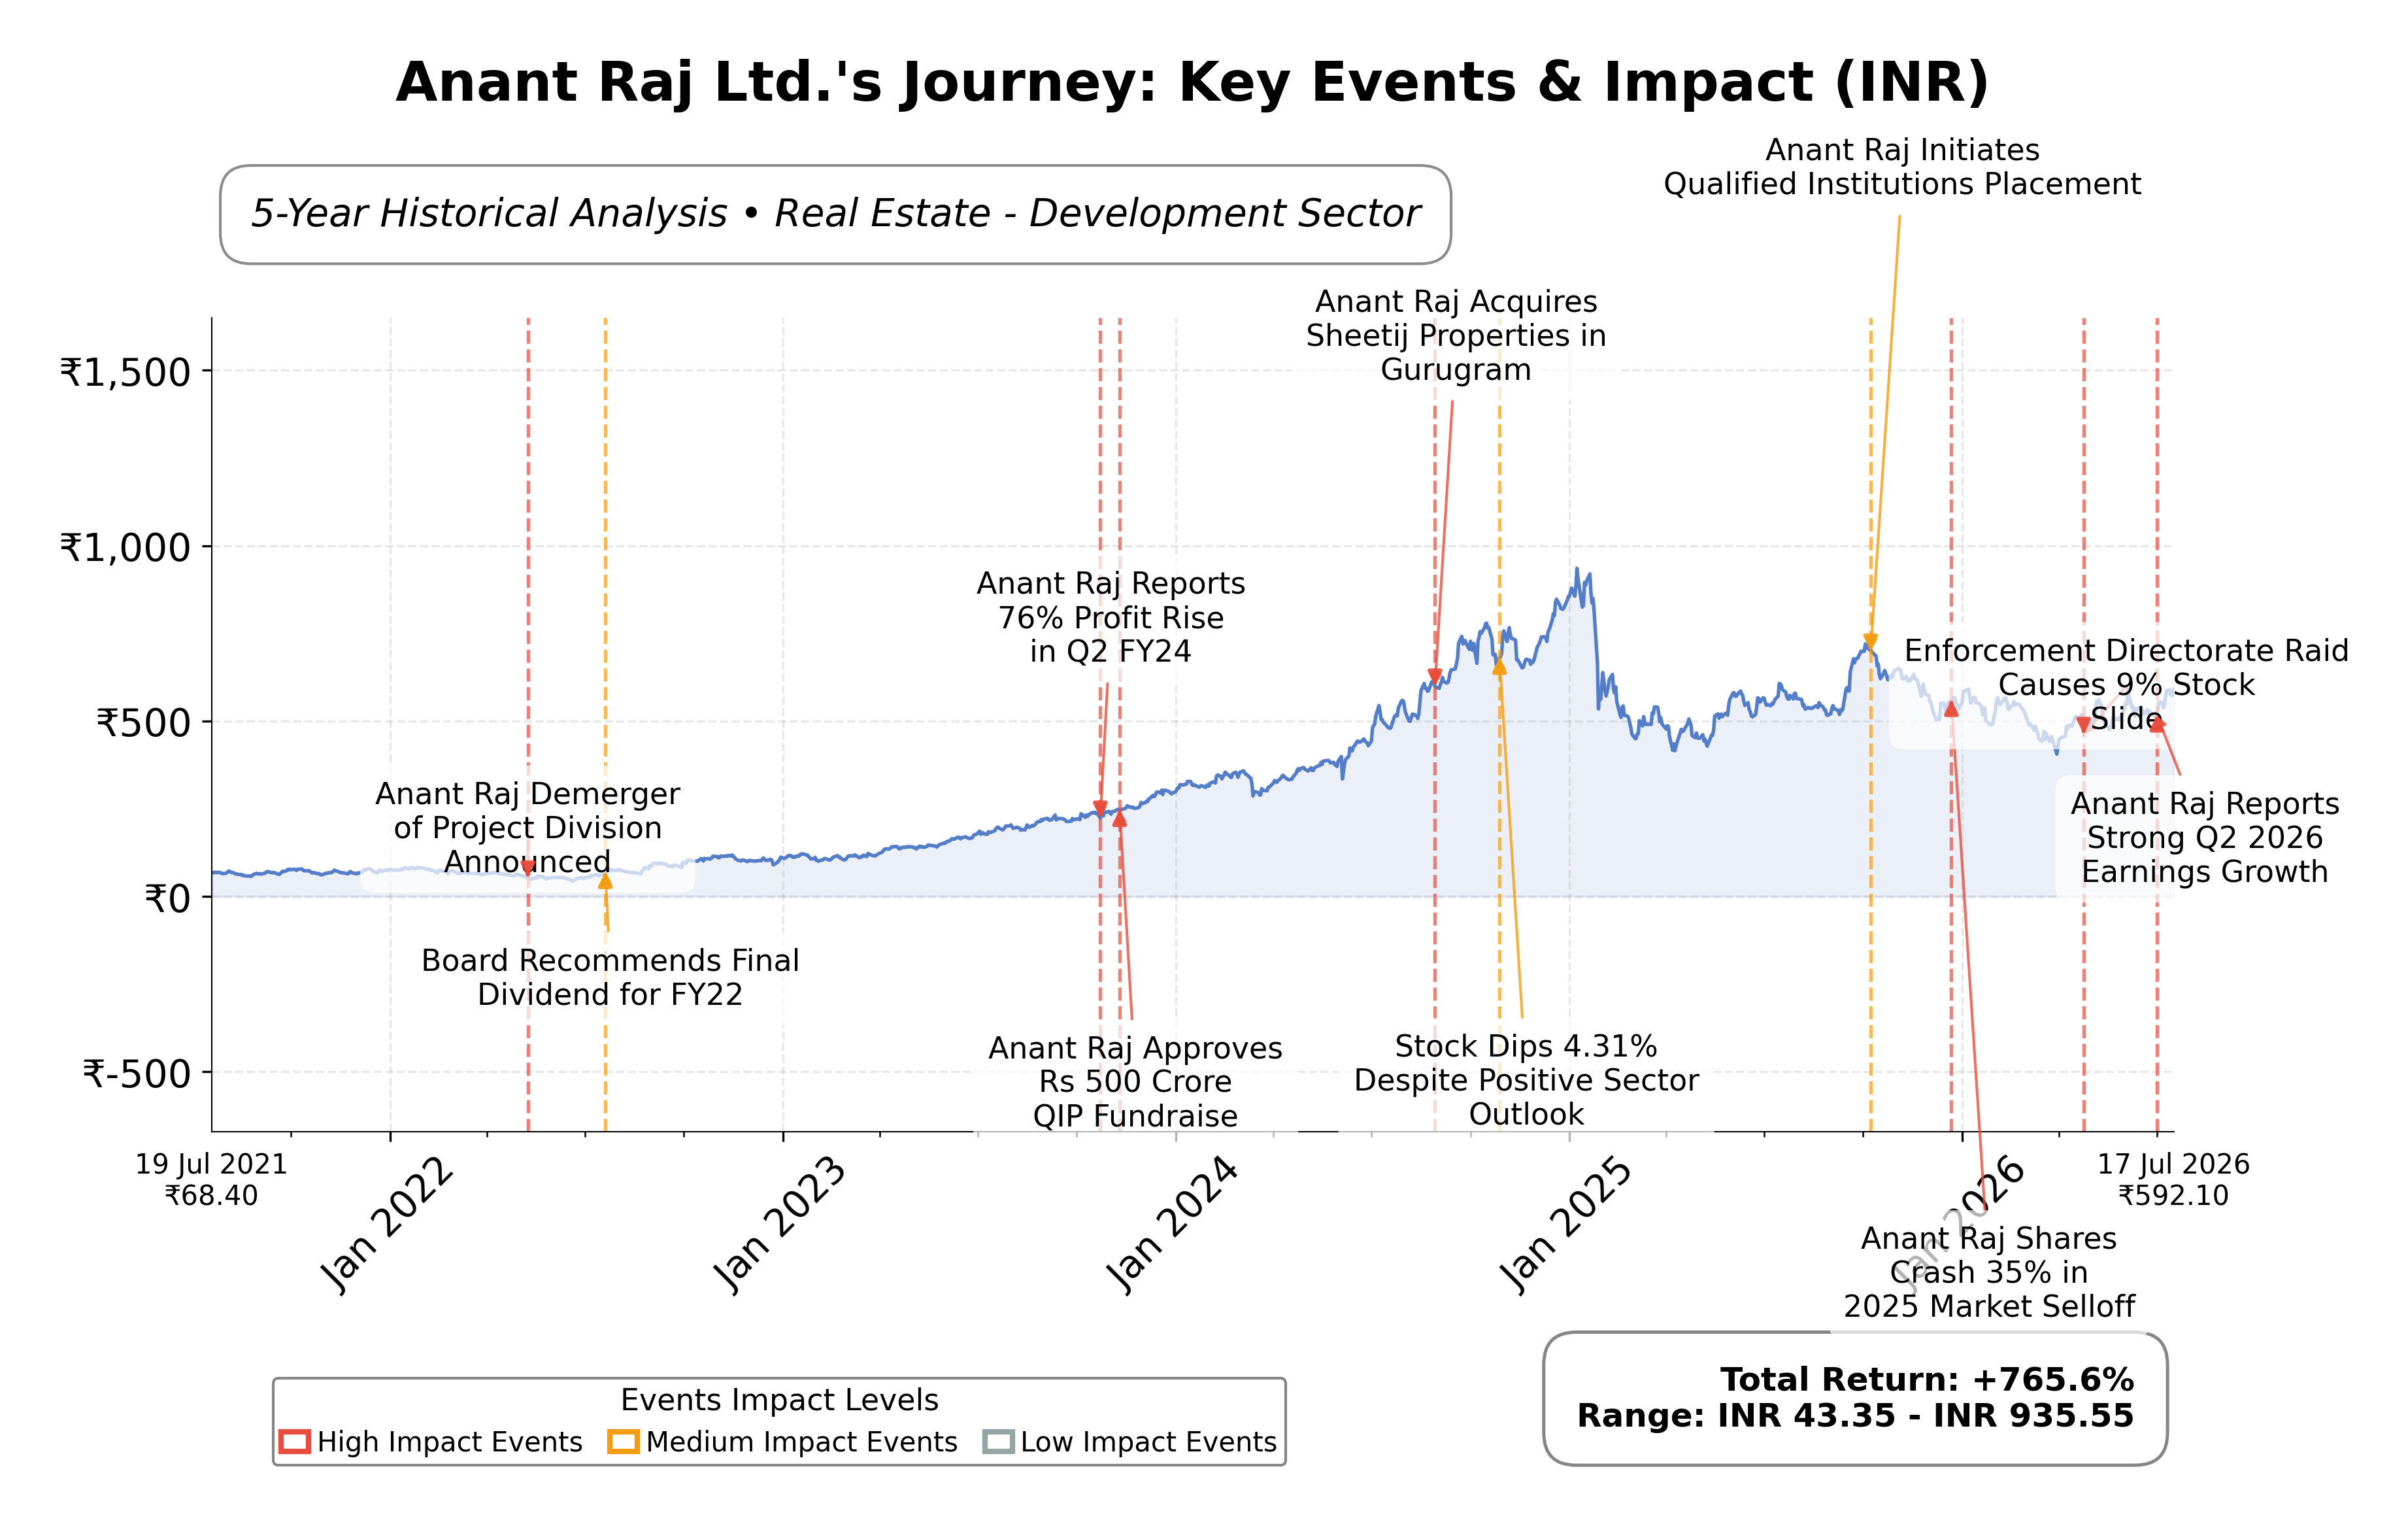
Key Positives and Key Risks
Pros
- Revenue growth of 19.6% quarterly and net income growth of 30.81% year-over-year demonstrate strong operational performance.
- Low debt-to-equity ratio of 0.117 and high current ratio of 9.76 indicate robust financial health and liquidity.
Cons
- Negative operating cash flow of ₹-434.78 crore and free cash flow of ₹-293.54 crore raise concerns about cash generation.
- Trailing P/E ratio of 37.45 is higher than industry peers, suggesting the stock is trading at a premium valuation.
- Price to cash flow ratio is significantly negative at -49.01, reflecting challenges in cash flow management.
Disclosure: This information is for general awareness and does not constitute investment advice
Report Summary
Anant Raj Ltd. is a prominent Indian real estate development company listed on the NSE, operating primarily in the Real Estate sector with a focus on development. The company engages in acquiring and developing land and constructing residential, commercial, and hospitality properties, including high-tech office complexes, hotels, shopping malls, and special economic zones. Its market positioning reflects a significant presence in urban and semi-urban areas, emphasizing innovation and sustainable construction practices.
Financially, Anant Raj Ltd. reported a trailing twelve-month revenue of approximately ₹2,511.6 crore with a gross margin of 30.72%, operating margin of 23.28%, and net profit margin of 22.18%. The company’s return on equity (ROE) stands at 11.18%, and return on assets (ROA) at 6.27%, indicating moderate profitability and efficient asset utilization. The return on invested capital (ROIC) is consistent with these figures, reflecting effective capital deployment.
Valuation metrics show a trailing P/E ratio of 37.45 and a forward P/E of 20.19, with a price-to-book ratio of 3.59 and an enterprise value to EBITDA (EV/EBITDA) of 32.48. The market capitalization is approximately ₹213.08 billion. The stock trades at ₹592.10, within a 52-week range of ₹743.65 (high) to ₹403 (low), indicating a current price below its recent peak but above the low, suggesting moderate valuation relative to historical price levels.
Key strengths include strong cash reserves of over ₹900 crore, a low debt-to-equity ratio of 0.117, and a high current ratio of 9.76, reflecting solid liquidity and low leverage. The company has demonstrated robust revenue growth of 19.6% quarterly and a 30.81% increase in net income year-over-year. Risks include sector-specific regulatory challenges, competitive pressures in the real estate market, and negative operating cash flow trends. Recent strategic actions include a successful qualified institutional placement (QIP) raising ₹1,099.99 crore and expansion in the data centre segment.
Technically, the stock shows a stable trend with prices near the 50-day and 200-day moving averages, supported by moderate momentum indicators. Recent news highlights strong financial performance and strategic initiatives, suggesting a balanced outlook. Market participants may consider monitoring liquidity and valuation dynamics closely as conditions evolve.
Company and Industry Overview
Company Basics
Price Performance
Company Size
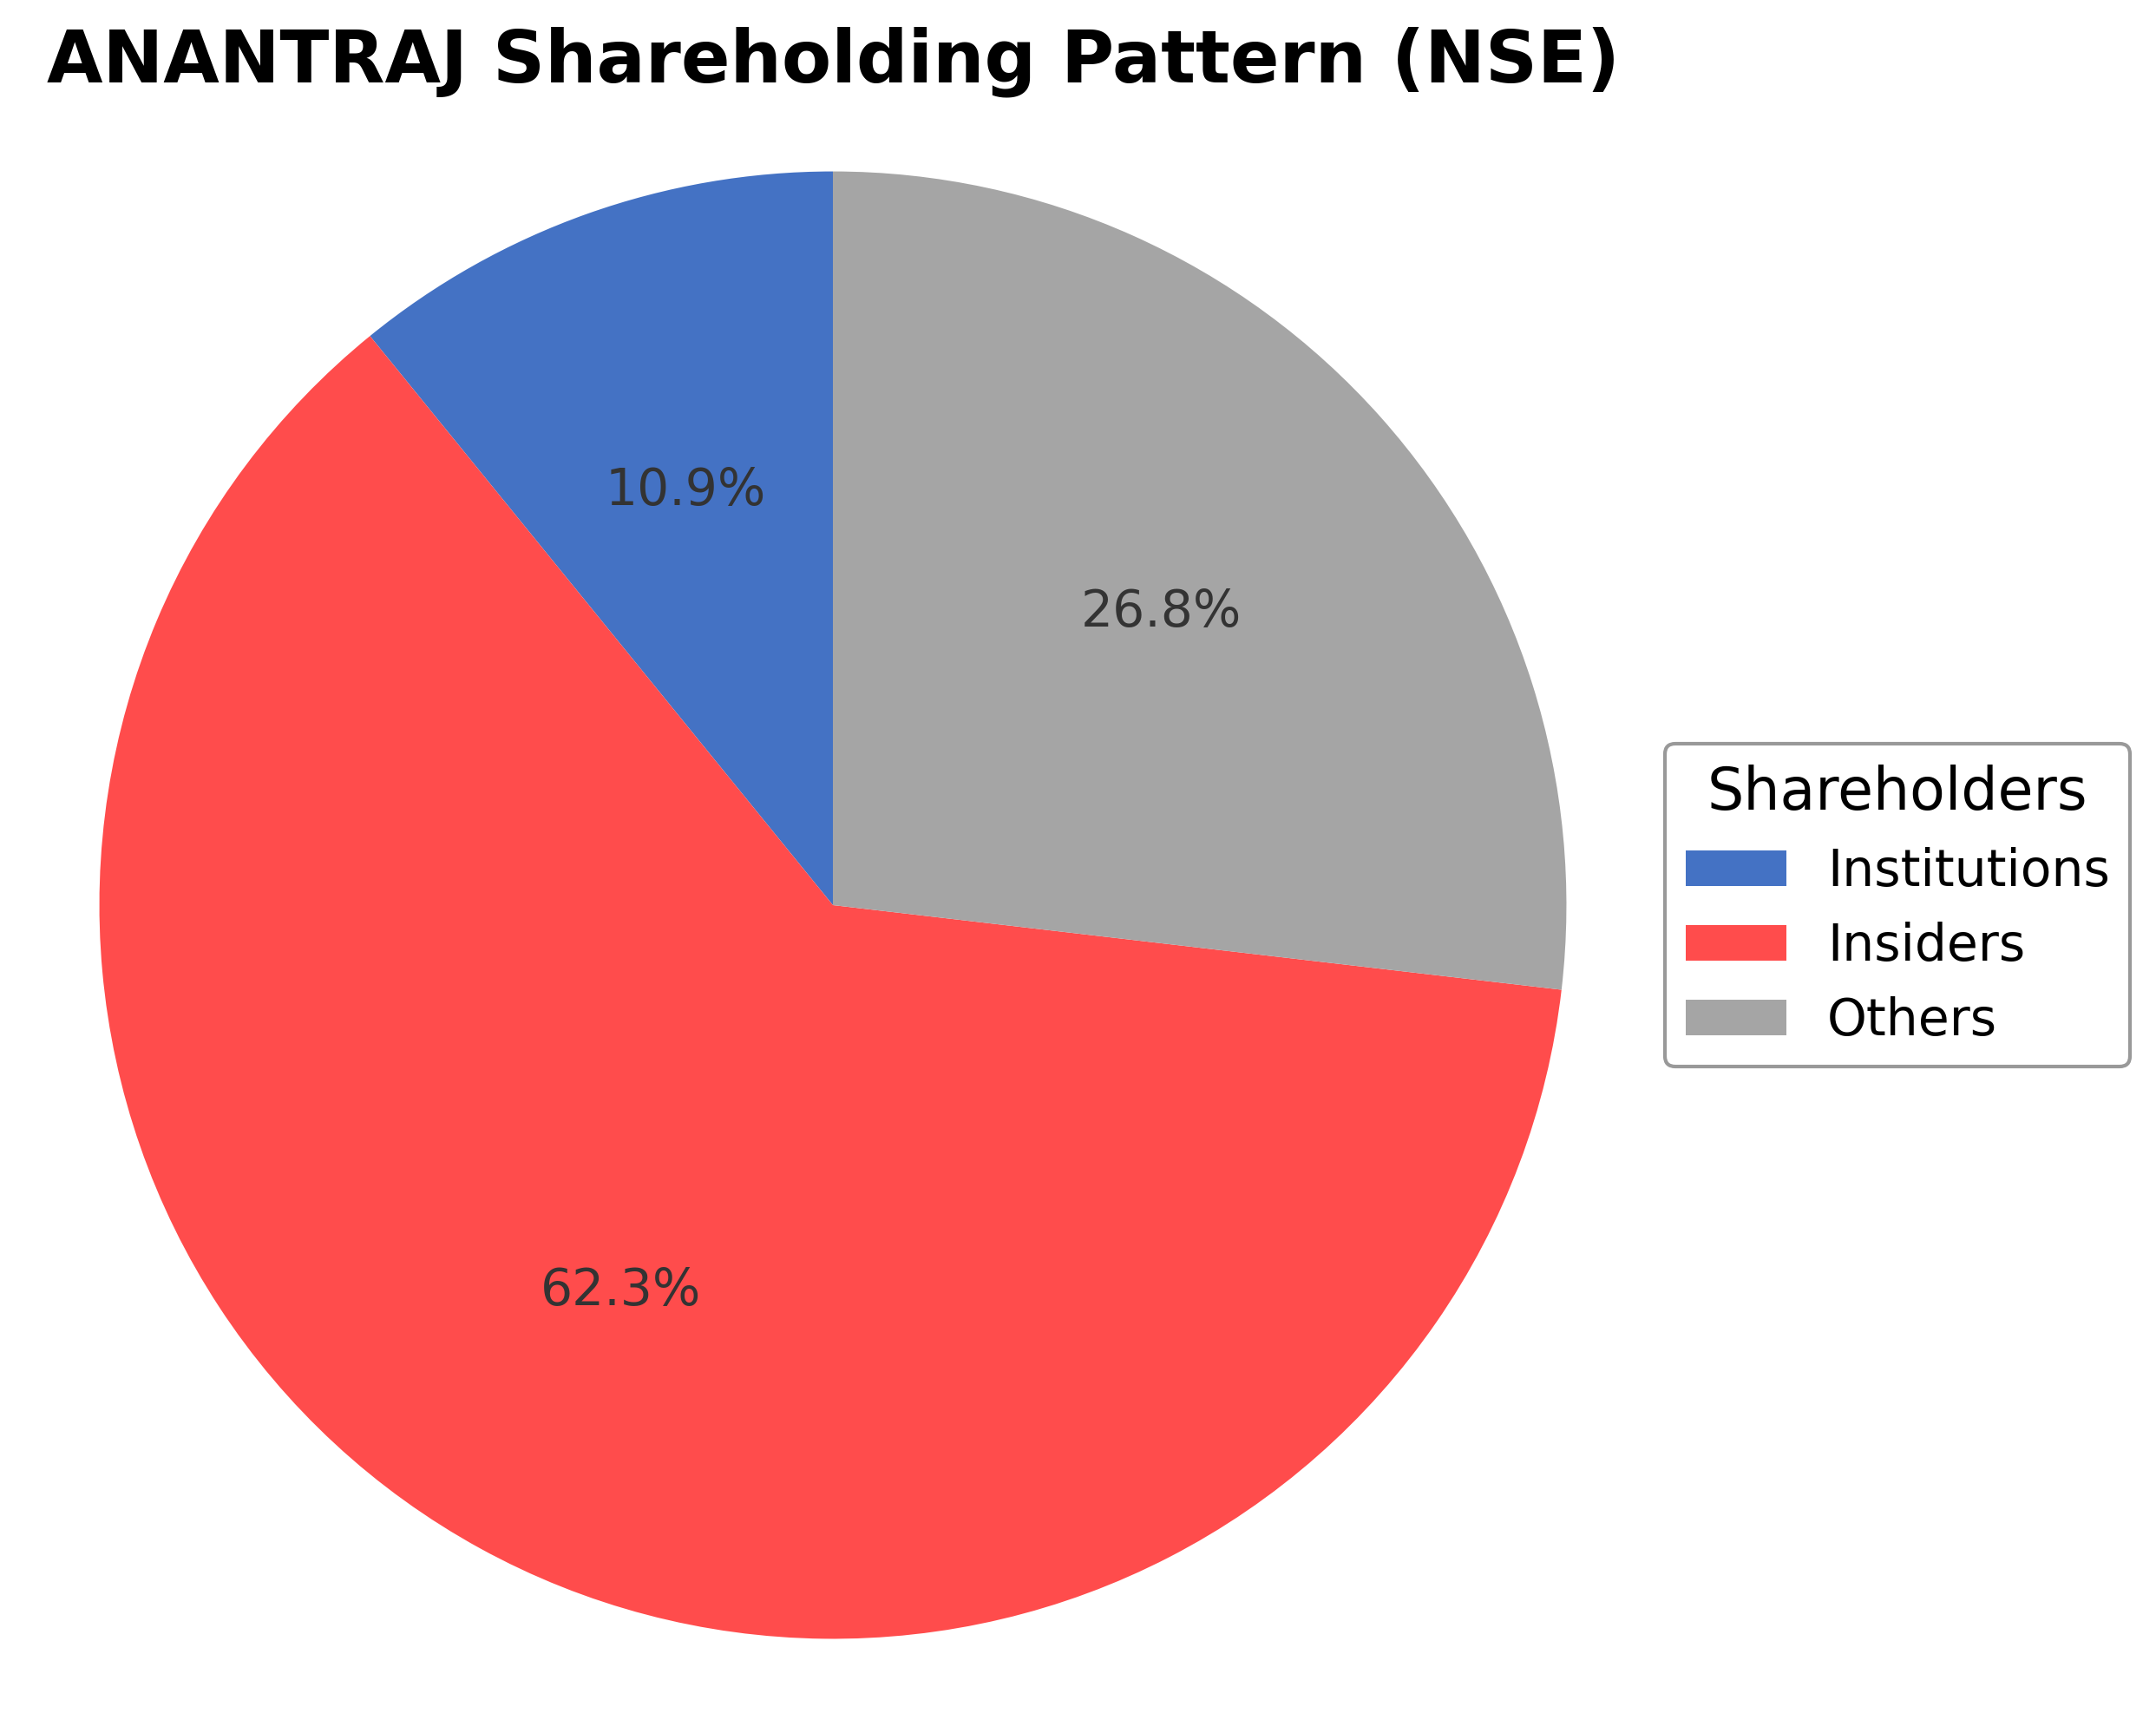
Shareholding Pattern
Sector and Industry Analysis
The Indian real estate and infrastructure sector is a significant contributor to the economy, driven by rapid urbanization and rising demand for residential and commercial properties, particularly in the National Capital Region (NCR) and North India. The sector is experiencing steady growth supported by government initiatives such as the Smart Cities Mission and affordable housing schemes. Key players include established mid-cap and large developers with diversified portfolios spanning residential, commercial, IT parks, and emerging data centre infrastructure.
Industry trends highlight a gradual shift towards diversification with increasing emphasis on data centres and cloud infrastructure, reflecting the digitalization wave and rising data consumption in India. Competitive dynamics are shaped by the presence of large pan-India developers and specialized data centre operators, creating high barriers to entry due to capital intensity and land acquisition challenges. Companies with significant land banks, diversified revenue streams, and strategic partnerships, like Anant Raj Ltd, hold competitive advantages in this evolving landscape.
The regulatory environment is influenced by policies promoting affordable housing, infrastructure development, and digital infrastructure expansion, which support sector growth. Compliance with real estate regulations, land acquisition laws, and environmental clearances remains critical, while government incentives under schemes like Digital India facilitate data centre investments. Overall, regulatory measures aim to enhance transparency and sustainability, impacting project execution timelines and sector attractiveness.
Note: Analysis synthesized from industry research, market reports, and regulatory filings. Information is subject to change based on market conditions.
Financial Ratios Dashboard
Illustrative Scenario Analysis
DCF Assumptions:
Method: Two-Stage EPS-Priority Model
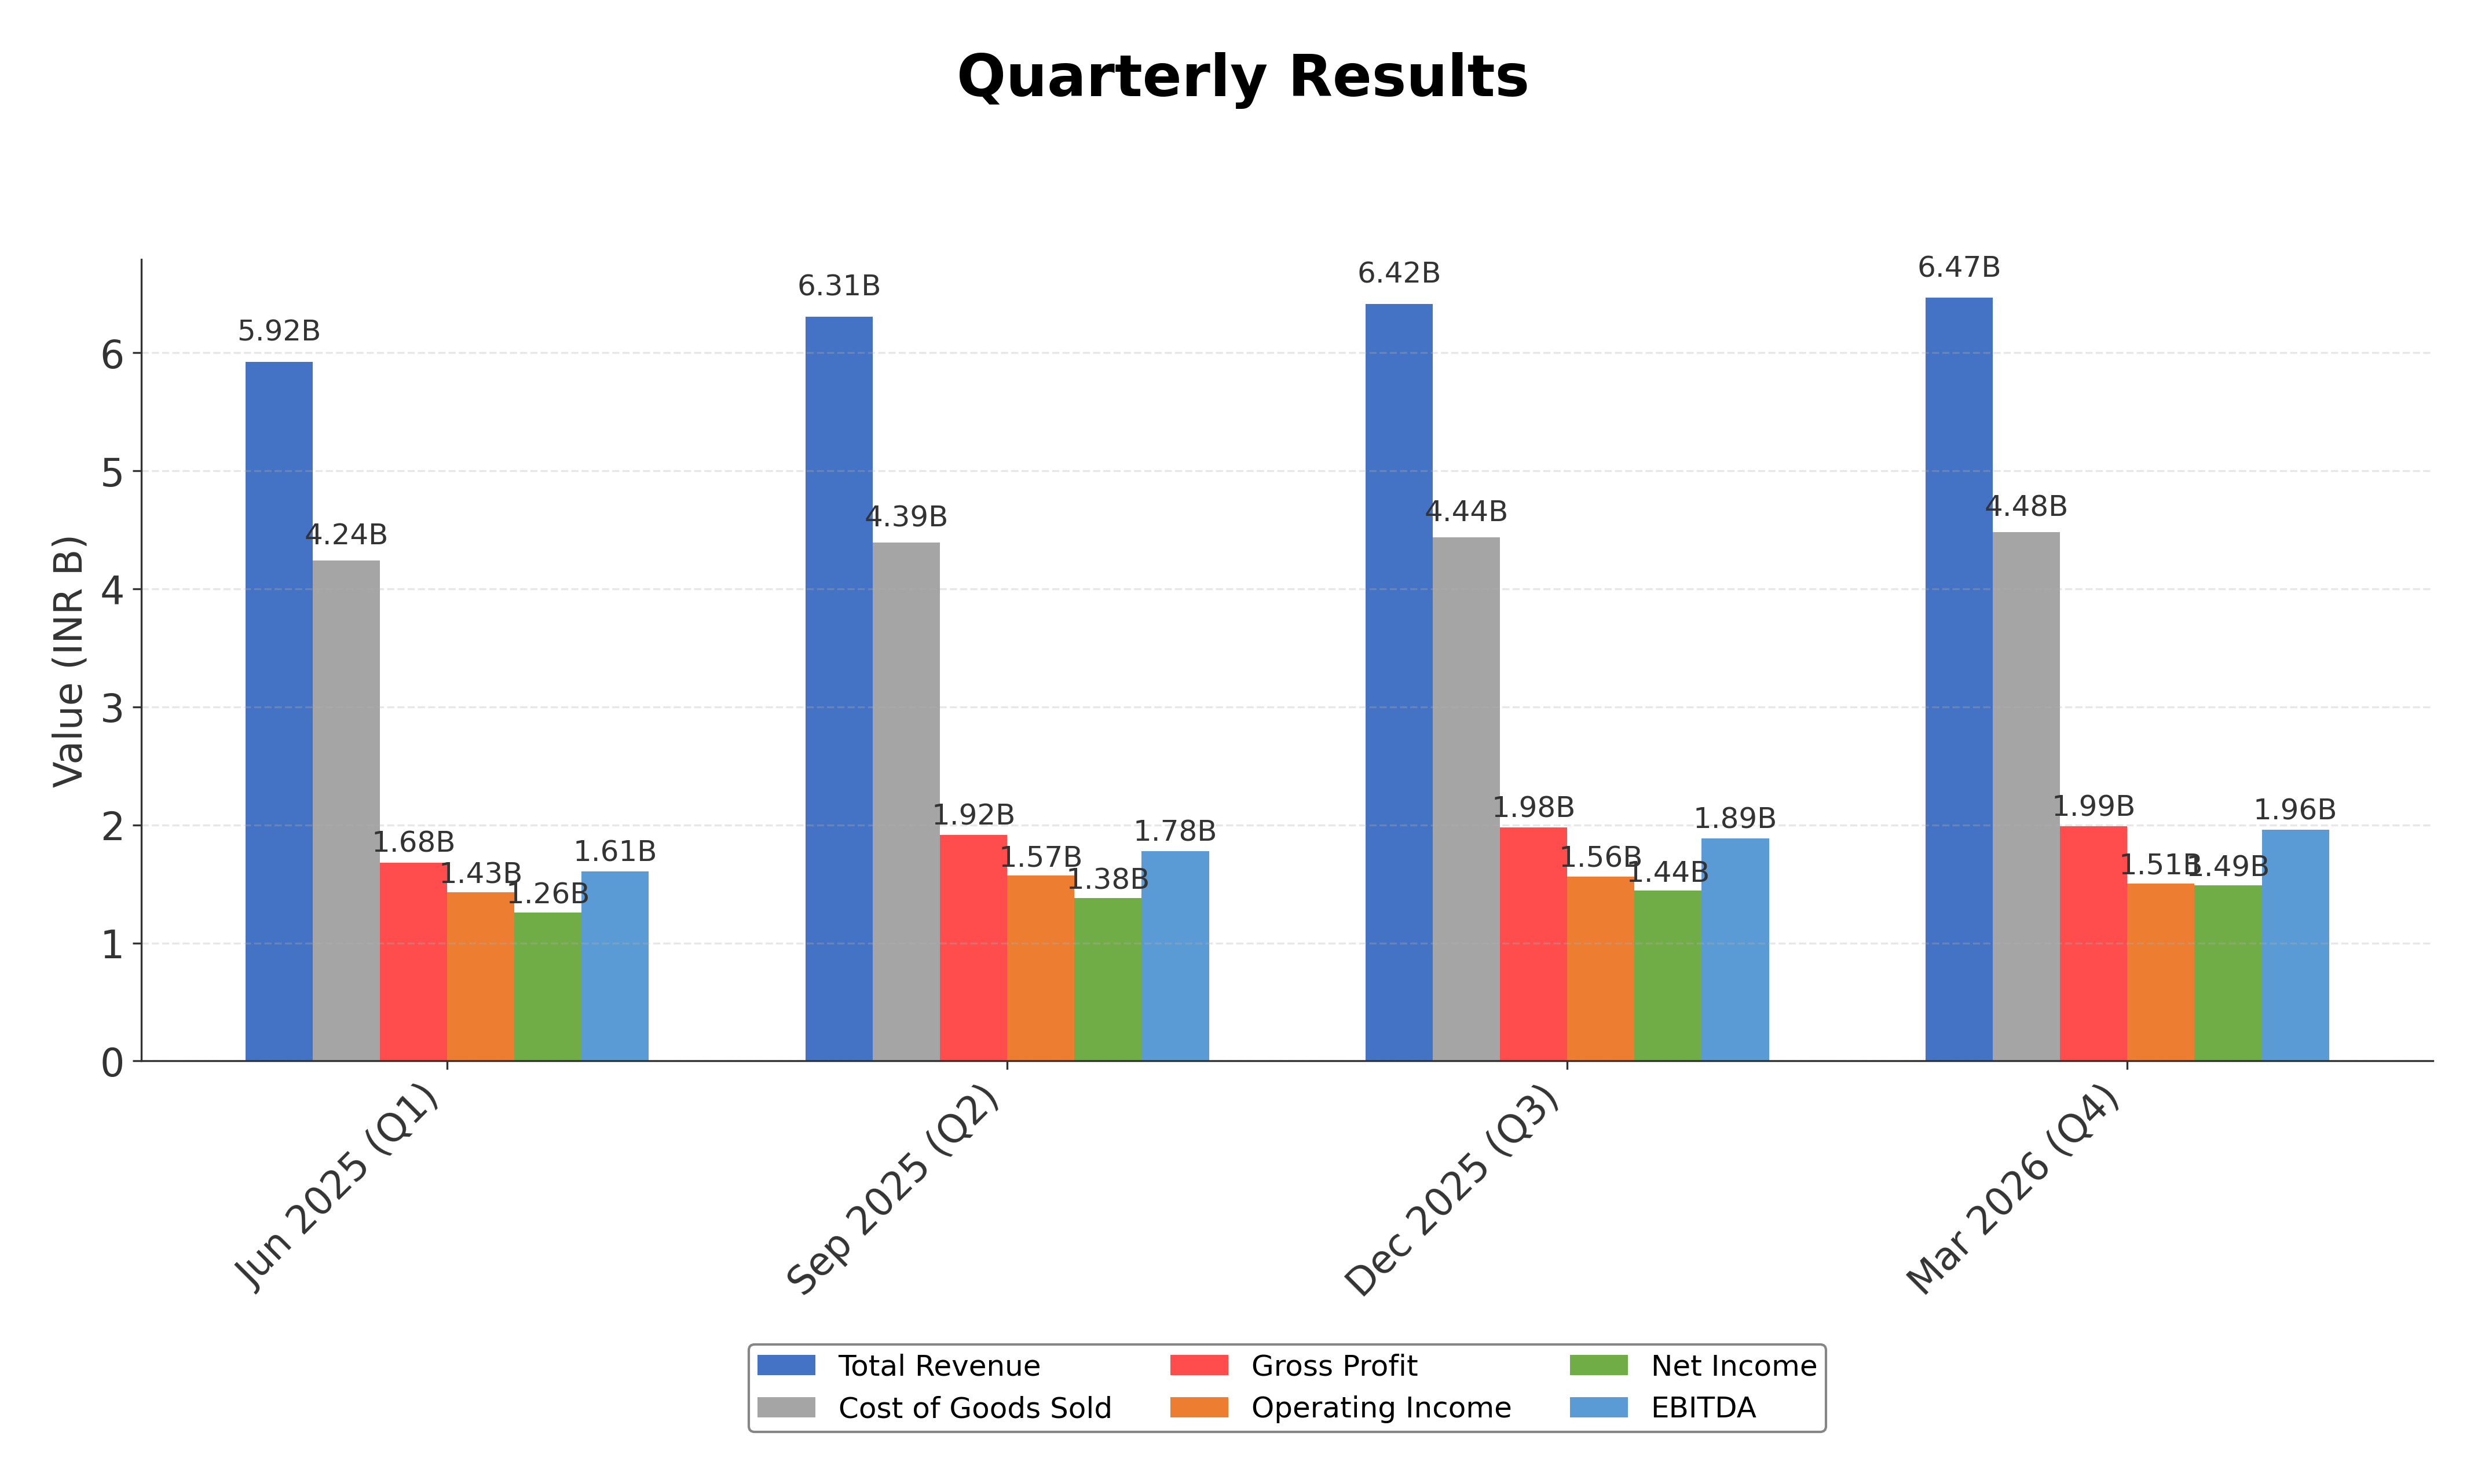
Financials
Peer Analysis
| Company Name | Market Cap | P/E Ratio | P/B Ratio | EV/EBITDA | Price to CFO |
|---|---|---|---|---|---|
| Anant Raj Ltd. | ₹213.08B | 37.45 | 3.59 | 32.48 | -49.01 |
| Macrotech Developers Ltd. | ₹1.19T | 34.68 | 5.10 | 24.97 | 123.78 |
| Brigade Enterprises Ltd. | ₹184.82B | 28.11 | 2.65 | 15.70 | -134.85 |
| Oberoi Realty Ltd. | ₹688.95B | 26.18 | 3.84 | 20.39 | 49.93 |
| Mahindra Lifespace Developers Ltd. | ₹79.68B | 25.82 | 2.22 | -61.94 | -14.62 |
| Sobha Ltd. | ₹156.37B | 80.91 | 3.31 | 51.66 | 36.38 |
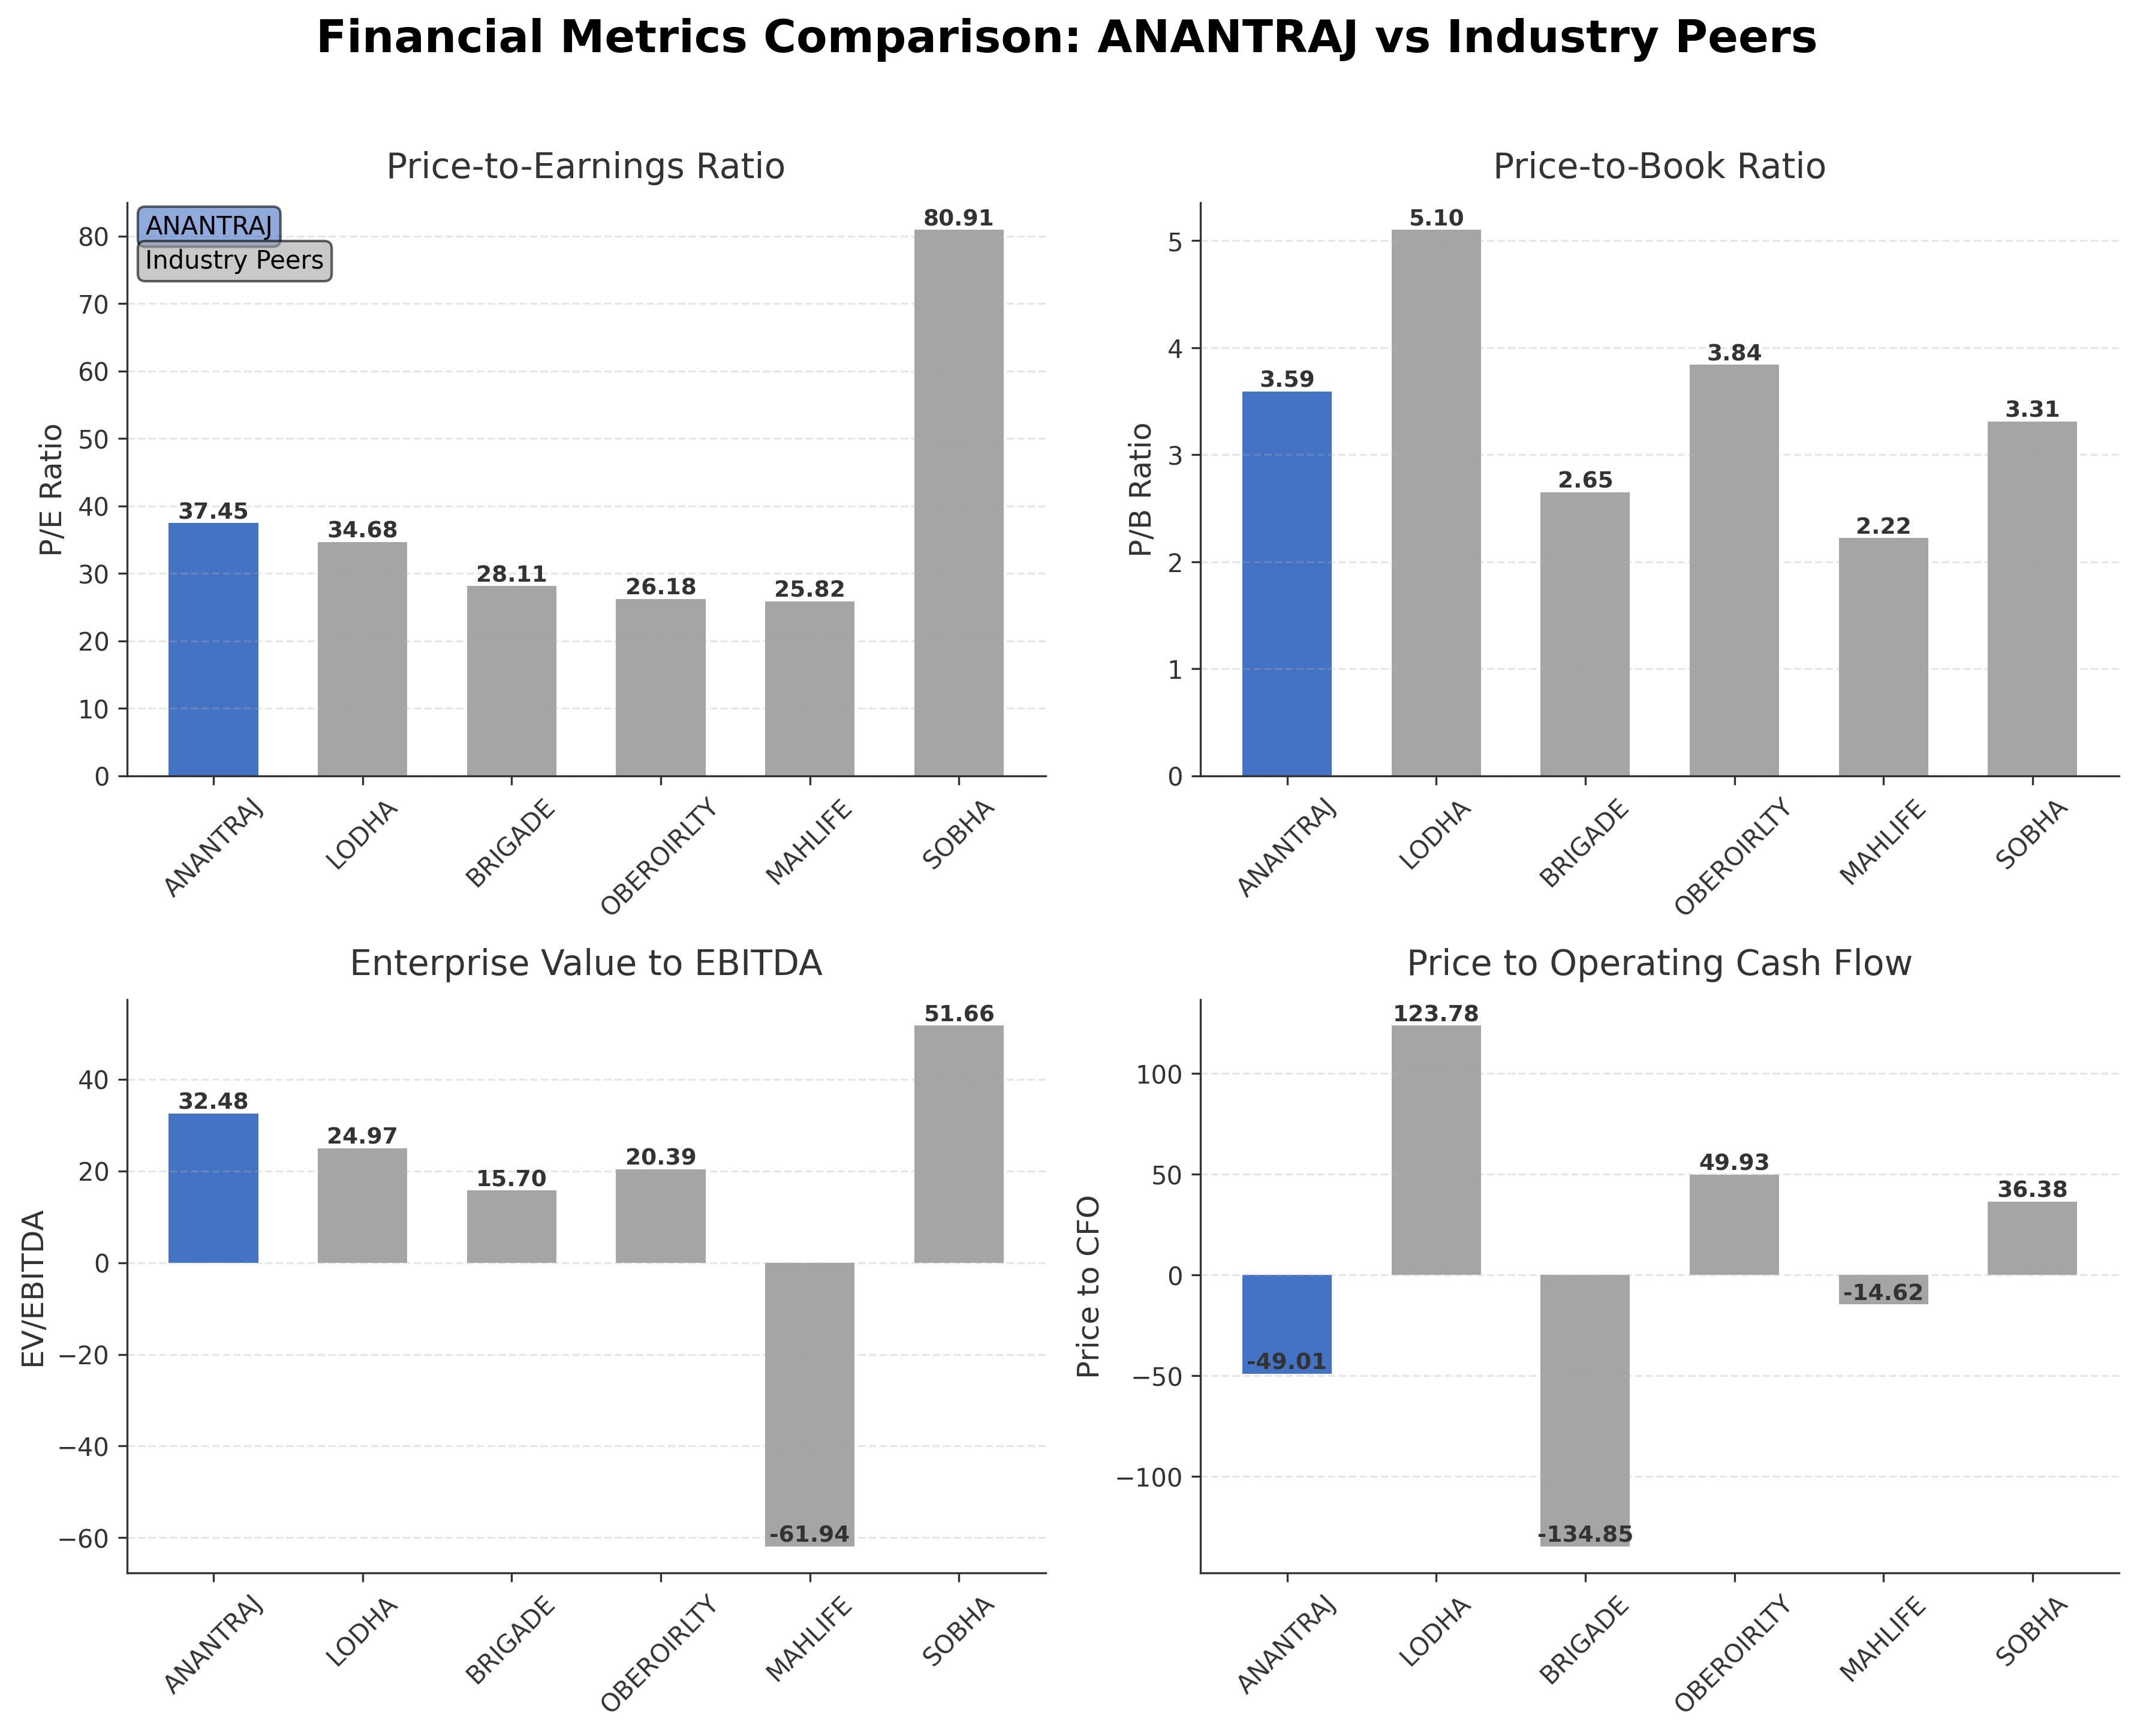
Comparison Analysis: Anant Raj Ltd. exhibits a higher P/E ratio (37.45) compared to most peers, indicating a relatively elevated valuation. Its price-to-book ratio of 3.59 is moderate within the peer group, while the EV/EBITDA ratio of 32.48 is among the higher values, suggesting premium pricing relative to earnings before interest, taxes, depreciation, and amortization. The company’s return on equity of 11.18% is competitive but below top performers like Macrotech Developers and Oberoi Realty. Negative price to cash flow ratio contrasts with some peers, reflecting operating cash flow challenges. Overall, Anant Raj stands as a mid-sized player with solid profitability but faces valuation and cash flow considerations relative to larger, more established peers.
Financial Metrics Comparison with Peers
Financial Statements
Comprehensive financial data including income, balance sheet, and cash flow metrics
Income Statement
| fiscal_date | 2026-03-31 | 2025-03-31 | 2024-03-31 | 2023-03-31 | 2022-03-31 |
|---|---|---|---|---|---|
| Sales | 25.12B | 20.60B | 14.83B | 9.57B | 4.62B |
| Cost Of Goods | 17.55B | 14.83B | 10.80B | 7.10B | 3.47B |
| Gross Profit | 7.56B | 5.77B | 4.03B | 2.47B | 1.15B |
| Operating Expense Selling General And Administrative | 167.75M | 148.65M | 116.18M | 117.26M | 97.06M |
| Operating Expense Other Operating Expenses | 459.36M | 459.19M | 366.21M | 217.64M | 248.20M |
| Operating Income | 6.07B | 4.61B | 3.16B | 1.81B | 592.10M |
| Non Operating Interest Income | 632.97M | 354.66M | 332.22M | 415.29M | 361.52M |
| Non Operating Interest Expense | 123.48M | 104.78M | 331.48M | 313.93M | 270.70M |
| Pretax Income | 6.62B | 4.91B | 3.19B | 1.97B | 715.20M |
| Income Tax | -1.30B | 689.88M | 540.46M | 523.02M | 230.50M |
| Net Income | 7.98B | 4.26B | 2.71B | 1.49B | 548.90M |
| Eps Basic | 15.81 | 12.44 | 8.12 | 4.66 | 1.92 |
| Eps Diluted | 15.81 | 12.44 | 8.12 | 4.66 | 1.74 |
| Basic Shares Outstanding | 351.00M | 342.29M | 327.59M | 324.10M | 294.38M |
| Diluted Shares Outstanding | 351.00M | 342.29M | 327.59M | 324.10M | 294.38M |
| Ebit | 6.74B | 5.01B | 3.52B | 2.28B | 985.90M |
| Ebitda | 7.20B | 5.29B | 3.67B | 2.42B | 1.15B |
| Net Income Continuous Operations | 6.62B | 4.91B | 3.19B | 1.97B | 715.20M |
| Minority Interests | -21.73M | -2.85M | -50.23M | 21.08M | 16.30M |
| Preferred Stock Dividends | 0.00 | 0.00 | 0.00 | 0.00 | 0.00 |
Data provided by Twelve Data
Balance Sheet
| fiscal_date | 2026-03-31 | 2025-03-31 | 2024-03-31 | 2023-03-31 | 2022-03-31 |
|---|---|---|---|---|---|
| Cash And Cash Equivalents | 8.99B | 3.30B | 3.05B | 340.63M | 194.31M |
| Accounts Receivable | 1.79B | 1.26B | 996.44M | 512.79M | 217.78M |
| Total Assets | 68.69B | 52.35B | 48.68B | 43.57B | 43.85B |
| Total Liabilities | 10.50B | 10.46B | 11.84B | 14.98B | 17.11B |
| Long Term Debt | 5.87B | 4.03B | 4.67B | 8.74B | 9.10B |
| Shareholders Equity | 58.19B | 41.89B | 36.85B | 28.58B | 26.74B |
Data provided by Twelve Data
Cash Flow Statement
| fiscal_date | 2026-03-31 | 2025-03-31 | 2024-03-31 | 2023-03-31 | 2022-03-31 |
|---|---|---|---|---|---|
| Operating Activities Net Income | 6.62B | 4.91B | 3.19B | 1.97B | 715.20M |
| Operating Activities Other Non Cash Items | -521.15M | -304.05M | -22.09M | -106.80M | -124.20M |
| Operating Activities Accounts Receivable | -1.23B | -1.01B | -777.87M | 140.96M | 208.20M |
| Operating Activities Other Assets Liabilities | -9.55B | -2.59B | -2.28B | -1.69B | 3.29B |
| Operating Activities Operating Cash Flow | -4.68B | 1.00B | 101.26M | 314.75M | 4.09B |
| Investing Activities Capital Expenditures | -2.03B | -767.17M | -293.23M | -380.97M | 425.90M |
| Investing Activities Net Acquisitions | -1.59B | N/A | N/A | N/A | N/A |
| Investing Activities Other Investing Activity | 40.91M | 1.19M | 187.71M | -236.11M | N/A |
| Investing Activities Investing Cash Flow | -3.57B | -765.98M | -105.52M | -617.08M | 425.90M |
| Financing Activities Short Term Debt Issuance | 73.60M | N/A | N/A | -308.20M | -197.90M |
| Financing Activities Common Stock Issuance | 11.00B | 1000.00M | 5.78B | 425.61M | 1.24B |
| Financing Activities Common Dividends | -250.58M | -249.58M | -162.05M | -35.41M | -29.50M |
| Financing Activities Other Financing Charges | 21.73M | -2.85M | -69.47M | -21.23M | -353.00M |
| Financing Activities Financing Cash Flow | 10.84B | 747.57M | 5.55B | 60.77M | 656.30M |
| End Cash Position | 8.99B | 3.30B | 3.05B | 340.63M | 194.30M |
| Free Cash Flow | -6.38B | 195.99M | -694.78M | -89.26M | 4.22B |
| Investing Activities Net Intangibles | N/A | N/A | 0.00 | 0.00 | 0.00 |
Data provided by Twelve Data
Technical Analysis
Key Insights
- Current trend shows a consolidation phase with price hovering near the 50-day (₹531.82) and 200-day (₹538.81) moving averages, indicating a neutral momentum.
- Key support levels are identified near ₹530 and ₹500, while resistance is observed around the recent high of ₹743.65.
- The stock price is slightly above both the 50-day and 200-day moving averages, suggesting a stable price base but lacking strong upward momentum.
- Momentum indicators show RSI in a moderate range around 50-60, MACD near the signal line indicating limited directional strength, and Stochastic oscillators reflecting neutral momentum.
- Multi-timeframe analysis reveals daily and weekly charts in sideways movement, while monthly charts suggest a longer-term uptrend with periodic corrections.
- Potential market scenarios include continuation of consolidation with possible breakout if volume increases or a retracement to support levels if momentum weakens.
Trending News
1. Headline: SENSEX >> BSE Sensex, Sensex Index, Live Sensex Index, Sensex Stocks
Summary: Live Sensex, BSE Sensex, What is Sensex?, History of Sensex, Get real time Sensex
Sentiment: neutral
2. Headline: EMBDL Share Price | Embassy Developments Ltd Stock Analysis & Recommendation
Summary: Capital Structure is Excellent ... Anant Raj has the highest 1-year return at -9.23%, while Brigade Enterpr. has the lowest at -47.64%. Embassy Develop's 1-year return of -50.64% is worse than both. Additionally, Brigade Enterpr., Sobha, SignatureGlobal, Mahindra Life, and Sri Lotus all have negative six-month returns.View full answer ... Embassy Developments Ltd is a leading ...
Sentiment: negative
3. Headline: Top stocks to buy today: Stock recommendations for July 16, 2026 - check list - The Times of India
Summary: India Business News: Top stock market recommendations: Anant Raj, Sobha Ltd, and PNB Housing Finance have been identified as the top stocks to buy by Aakash K Hindocha, Vi.
Sentiment: neutral
Summary: Anant Raj Share Price: Find the latest news on Anant Raj Stock Price. Get all the information on Anant Raj with historic price charts for NSE / BSE. Experts & Broker view also get the Anant Raj Ltd. buy/sell tips detailed news, announcements, Forecasts, Analysts, Valuation, Earning forecasts, ...
Sentiment: neutral
5. Headline: Buy, Sell Or Hold: Suzlon, Tata Motors PV, Biocon, Jio Financial, Power Grid Corp And Anant Raj — Ask Profit
Summary: Market experts shared their insights on fundamentals and technical levels for key stocks, Suzlon, Tata Motors PV, Biocon, Jio Financial, Power Grid Corp. and Anant Raj.
Sentiment: neutral
Powered by Brave
Recent Updates
News Summary
As of 2026-07-19. Anant Raj Ltd. reported strong financial results for FY 2025-26, with consolidated revenue increasing 21.92% year-over-year to ₹2,511.60 crore and EBITDA rising 35.94% to ₹723.15 crore. Profit after tax grew by 30.81% to ₹557.02 crore, supported by a significant 126.89% surge in data centre segment revenue. The company achieved net debt-free status and successfully raised ₹1,099.99 crore through a qualified institutional placement. Additionally, Anant Raj initiated a special window for the dematerialization of physical shares, enhancing shareholder convenience and liquidity. These developments underscore the company’s operational strength and strategic focus on expanding its data centre business.
News Sentiment
The overall sentiment from recent updates is predominantly positive, driven by strong financial performance, robust revenue and profit growth, and strategic capital raising activities. The surge in data centre revenue and the achievement of net debt-free status contribute to a favorable operational outlook. The initiative to facilitate dematerialization of physical shares further reflects proactive corporate governance and investor relations efforts. No significant negative news was reported, resulting in a balanced but optimistic tone regarding the company’s near-term business trajectory.
Source List
Analytical Overview
Analysis Summary
Anant Raj Ltd.’s valuation metrics show a trailing P/E of 37.45, which is higher than the industry average of approximately 30-35, indicating a premium valuation; the forward P/E of 20.19 suggests expected earnings growth. Revenue growth is strong at 19.6% quarterly, supported by a 30.81% increase in net income year-over-year, but operating cash flow remains negative, which may warrant attention. The company maintains a low debt-to-equity ratio of 0.117 and a high current ratio of 9.76, reflecting solid financial health and liquidity. Sector challenges include regulatory complexities and competitive pressures in the Indian real estate market, while opportunities arise from expanding data centre operations and a large land bank. Considering India-specific factors, the company benefits from urbanization trends and government infrastructure initiatives, though it must navigate regulatory frameworks and economic cycles.
Overall Business and Market Assessment
Supporting Factors: robust revenue and profit growth, strong liquidity with low leverage, and strategic expansion into data centres
Risk Factors: sustained negative operating cash flow and sector regulatory challenges
SWOT Analysis
Strengths
- Strong revenue growth of 19.6% quarterly and 30.81% net income increase year-over-year.
- Low debt-to-equity ratio of 0.117 indicating conservative leverage.
- Large land bank of approximately 320 acres providing long-term development visibility.
- Robust liquidity with a current ratio of 9.76 and cash reserves exceeding ₹900 crore.
Weaknesses
- Negative operating cash flow and free cash flow over the trailing twelve months.
- Price to cash flow ratio is significantly negative at -49.01, indicating cash flow challenges.
- High trailing P/E ratio of 37.45 suggesting premium valuation.
- Relatively low institutional ownership at 10.87% limiting broader market participation.
Opportunities
- Rapid growth in data centre and cloud services segment with revenue surge of 126.89%.
- Urbanization and infrastructure development trends in India supporting real estate demand.
- Potential to leverage strategic partnerships and capital raised through QIP for expansion.
- Regulatory push towards digital securities management enhancing shareholder engagement.
Threats
- Regulatory and compliance risks inherent in the Indian real estate sector.
- Competitive pressures from larger and more diversified real estate developers.
- Macroeconomic factors such as interest rate fluctuations impacting real estate demand.
- Potential delays or cost overruns in construction projects affecting profitability.
Company Description
Anant Raj Ltd. is a prominent real estate development company based in India, primarily engaged in the acquisition and development of land, as well as the construction of residential, commercial, and hospitality properties. The company's diverse portfolio includes high-tech office complexes, hotels, shopping malls, and special economic zones, catering to the growing demand for modern infrastructure in urban and semi-urban areas. With a focus on innovation and sustainable construction practices, Anant Raj Ltd. plays a significant role in reshaping the real estate landscape across major metropolitan cities and emerging towns in India. The company's commitment to quality and timely delivery has earned it a reputation as a reliable player in the real estate sector, contributing to the economic development of the regions it operates in.