
Anand Rathi Share and Stock Brokers Limited (ARSSBL)
Stock Analysis Report
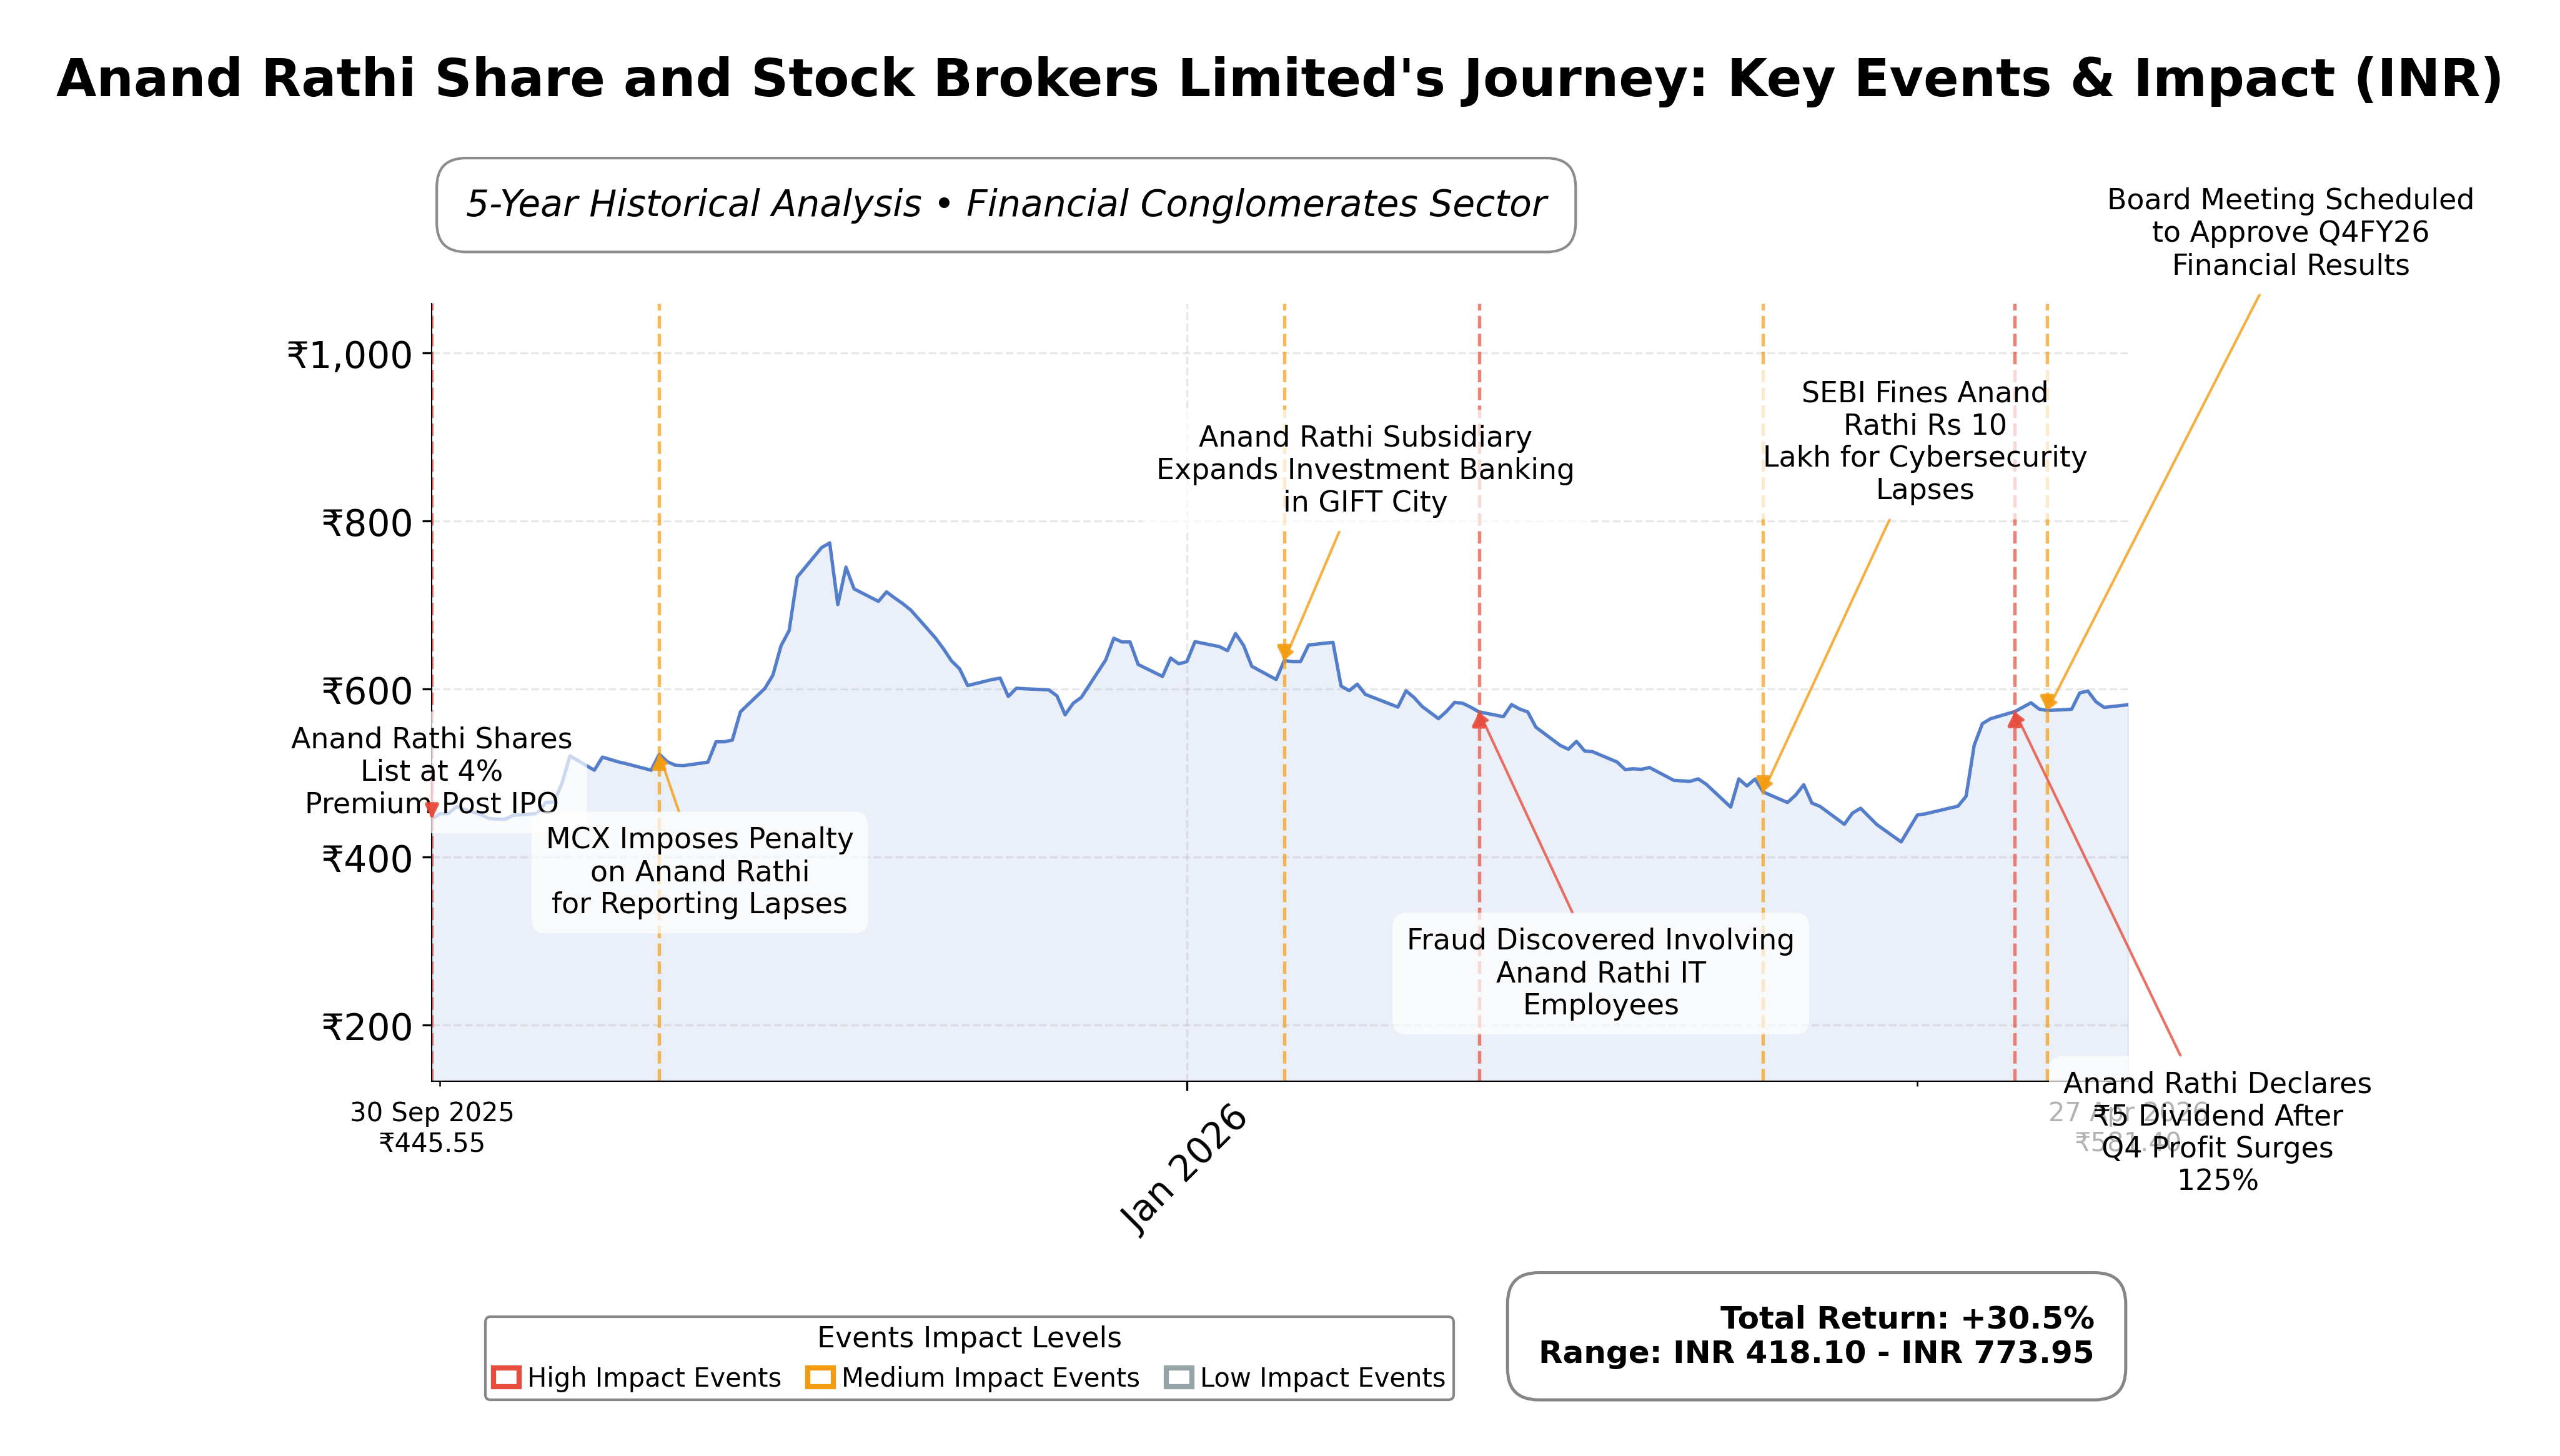
Stock Journey
Key Positives and Key Risks
Pros
- Strong revenue growth of 28% year-on-year indicates robust business expansion.
- High return on equity at 13.96% reflects efficient use of shareholder capital.
- Low EV/EBITDA ratio of 1.08 suggests attractive valuation relative to earnings.
Cons
- Trailing P/E ratio of 34.52 is relatively high, potentially indicating stretched valuation.
- Debt-to-equity ratio of 61.64% denotes moderate leverage that could increase financial risk.
- Absence of forward P/E and PEG ratio limits visibility on future valuation and growth.
Disclosure: This information is for general awareness and does not constitute investment advice
Report Summary
Anand Rathi Share and Stock Brokers Limited (ARSSBL) operates as a leading financial services provider in India, specializing in brokerage and investment services across equity, derivatives, commodities, and currency trading. Listed on the NSE under the symbol ARSSBL, the company is part of the Financial Services sector and functions as the brokerage arm of the Anand Rathi Group. It serves a diverse clientele including retail investors, high-net-worth individuals, and institutional clients through both physical branches and digital platforms, positioning itself as a significant player in India's financial conglomerates industry.
Financially, Anand Rathi reported trailing twelve months (TTM) revenue of approximately ₹7.5 billion with a gross margin of 59.75%, operating margin of 26.13%, and a net profit margin of 17.23%. The company’s return on equity (ROE) stands at 13.96%, and return on assets (ROA) at 2.47%, reflecting moderate profitability and efficient asset utilization. Operating cash flow totaled ₹7.25 billion TTM, with free cash flow of ₹1.29 billion, indicating healthy cash generation supporting operational needs and shareholder returns.
Valuation metrics show a trailing price-to-earnings (P/E) ratio of 34.52, aligning closely with the industry P/E of 34.52, and a price-to-book (P/B) ratio of 2.81. The enterprise value to EBITDA (EV/EBITDA) ratio is notably low at 1.08, suggesting potentially attractive valuation relative to earnings before interest, taxes, depreciation, and amortization. The stock trades at ₹600.15, within a 52-week range of ₹416 to ₹794.85, currently positioned below its high, indicating room for price movement relative to recent peaks.
Key strengths include strong cash reserves of over ₹35.48 billion, a manageable debt-to-equity ratio of 61.64%, and a diversified revenue base with growth in distribution income and margin trading. Risks involve regulatory changes in the financial services sector, competitive pressures from larger conglomerates, and market volatility impacting brokerage volumes. Recent strategic initiatives include launching AI-driven digital content to enhance investor engagement and declaring a significant 100% dividend, underscoring financial strength and shareholder focus.
Technically, the stock is trading below its 200-day moving average of ₹560.27 but above the 50-day average of ₹503.30, with momentum indicators suggesting mixed signals across timeframes. Recent news highlights strong quarterly earnings growth and dividend announcements, supporting a cautiously optimistic outlook. The data suggests a balanced stance with attention to market developments and company fundamentals for future positioning.
Company and Industry Overview
Company Basics
Price Performance
Company Size
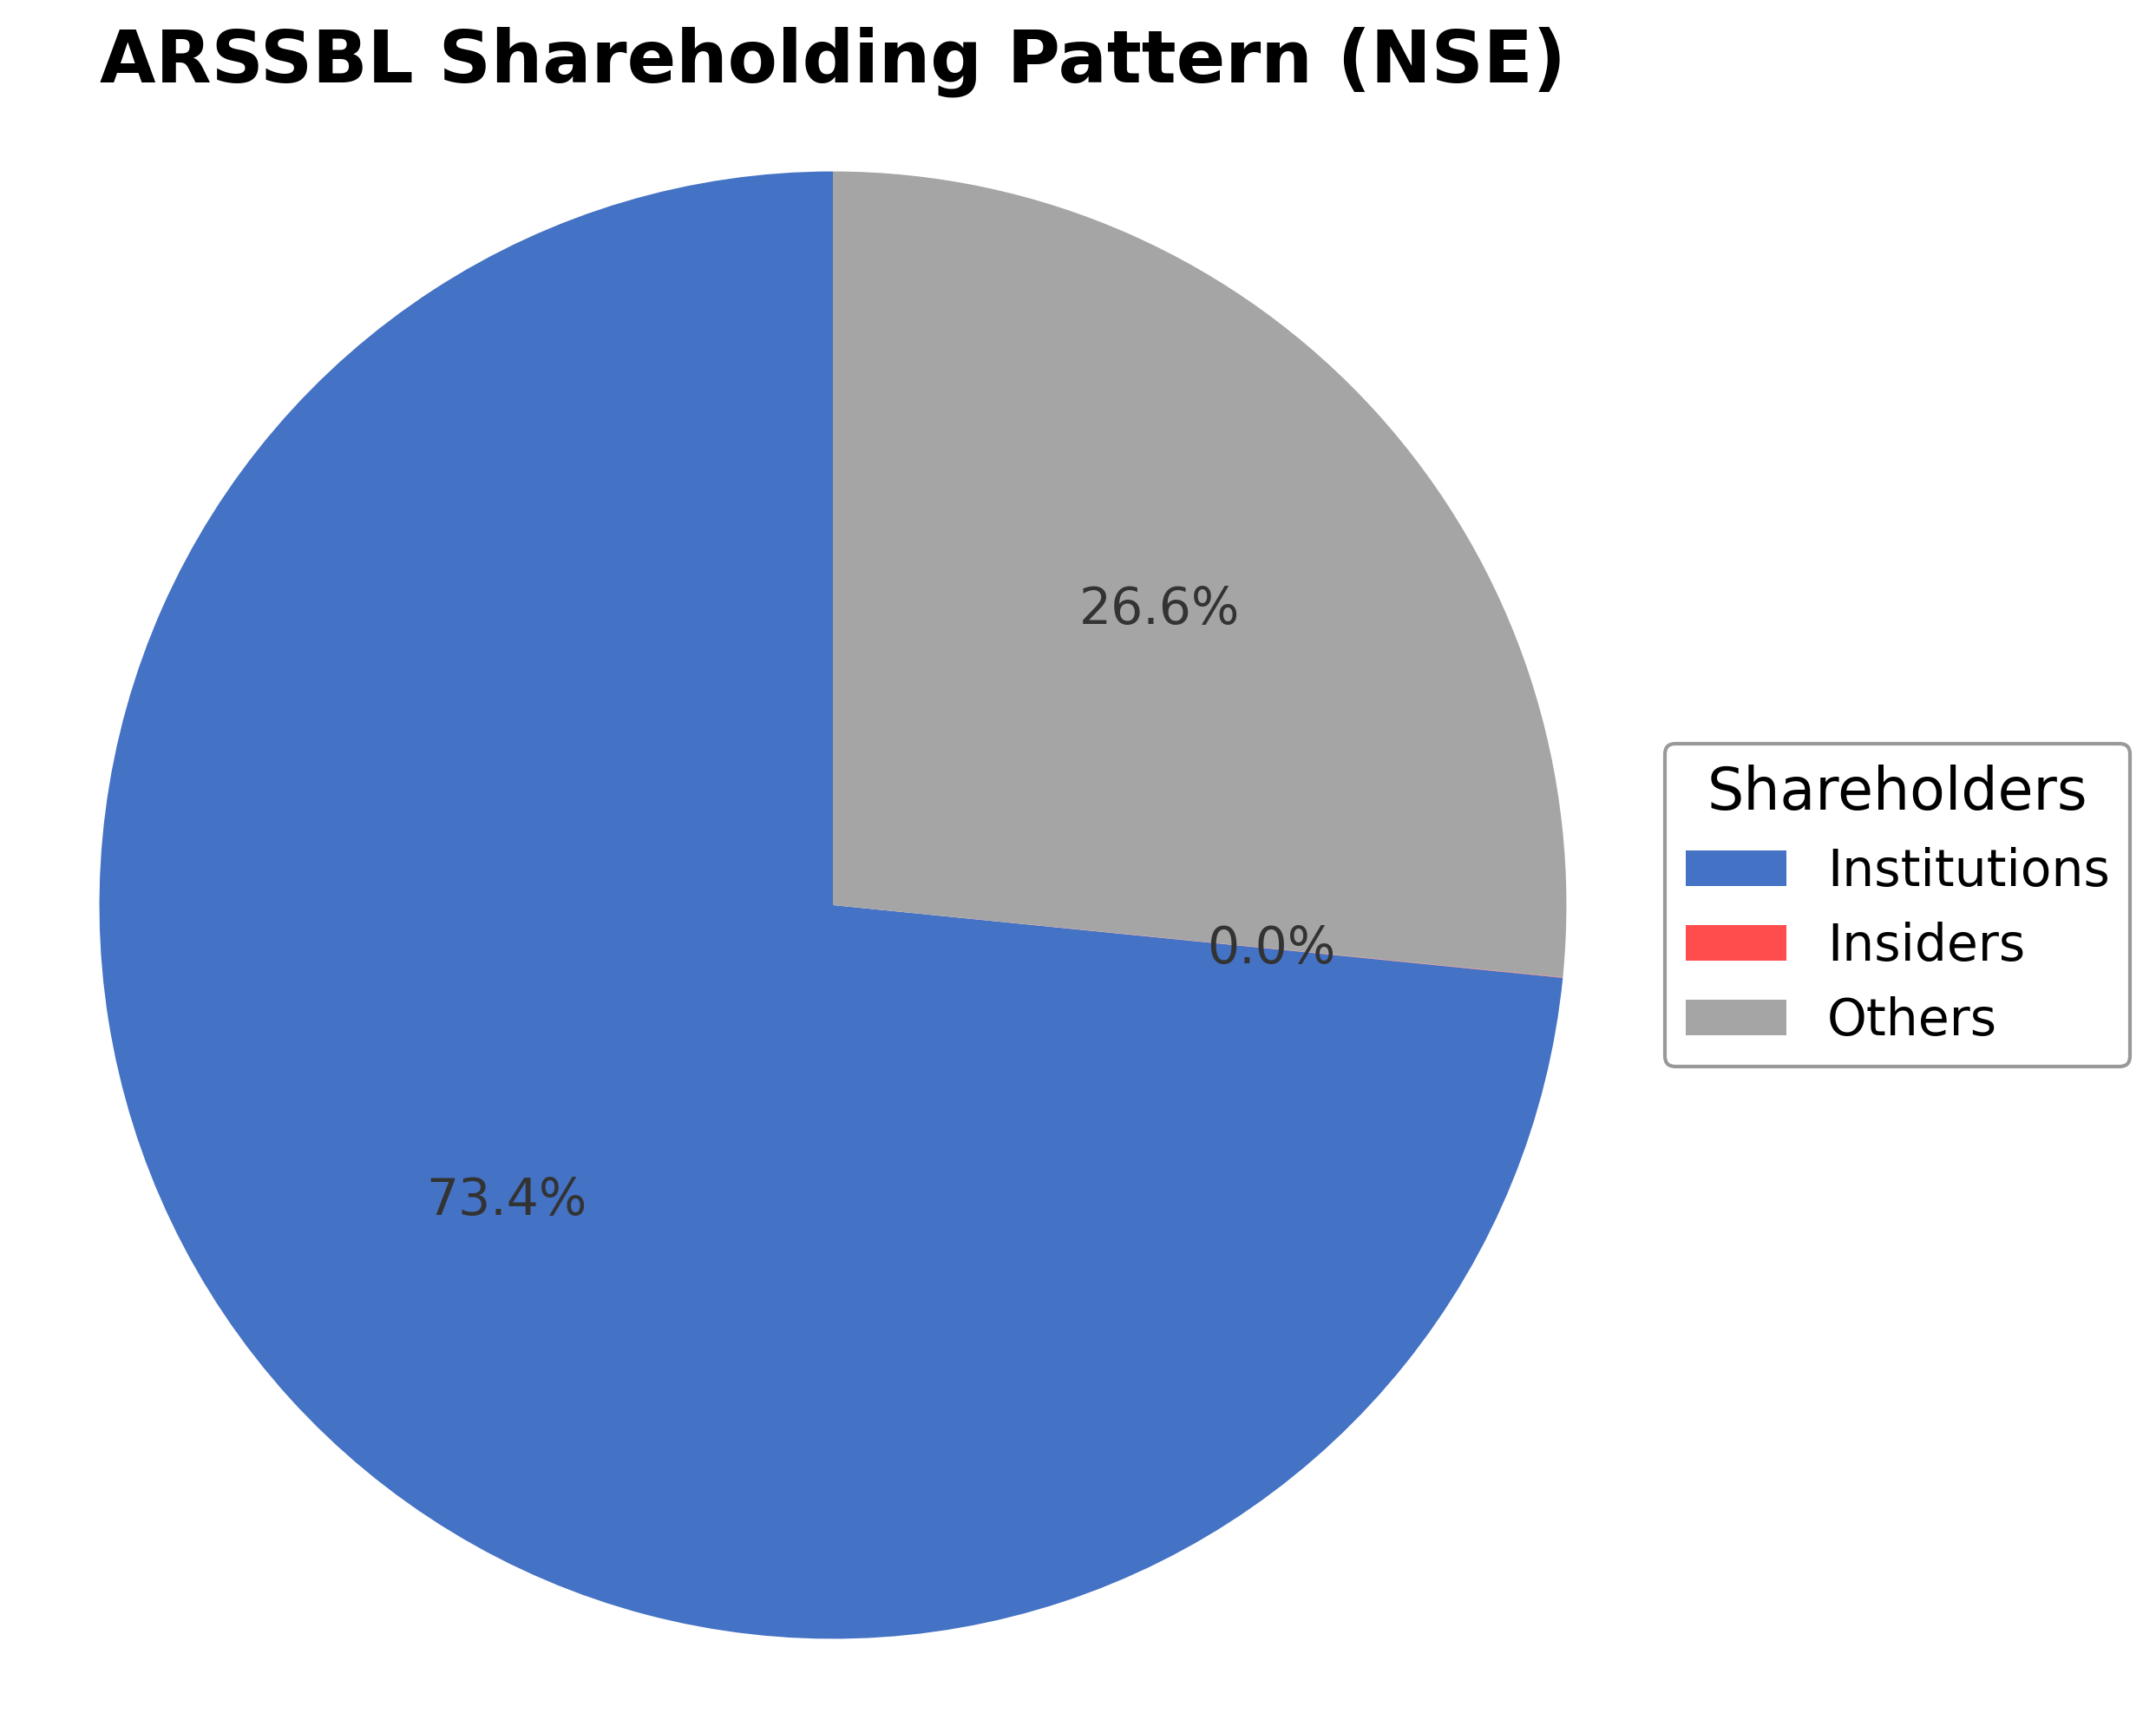
Shareholding Pattern
Sector and Industry Analysis
The Indian brokerage sector operates within a rapidly expanding financial services market, driven by increasing retail participation and digital adoption. The market size has grown significantly over the past decade, supported by rising equity investments and wealth management needs. Key players include large full-service brokers and discount brokers, with firms like Zerodha, ICICI Securities, and HDFC Securities dominating in terms of client base and market capitalization.
Industry trends reflect a shift towards technology-enabled trading platforms, margin trading facilities, and diversified product offerings including mutual funds and insurance distribution. Competitive dynamics are shaped by intense price competition, the rise of discount brokers, and the need for robust digital infrastructure. Barriers to entry remain moderate due to regulatory requirements and the necessity for strong risk management and client servicing capabilities, positioning established full-service brokers to leverage brand trust and comprehensive service portfolios.
The regulatory environment is overseen primarily by the Securities and Exchange Board of India (SEBI), which enforces stringent compliance norms to protect investor interests and ensure market integrity. Recent regulations emphasize transparency, risk management, and client fund protection, impacting brokerage operations and capital requirements. The outlook suggests continued regulatory vigilance with potential reforms aimed at enhancing market efficiency and investor confidence.
Note: Analysis synthesized from industry research, market reports, and regulatory filings. Information is subject to change based on market conditions.
Financial Ratios Dashboard
Illustrative Scenario Analysis
DCF Assumptions:
Method: Two-Stage EPS-Priority Model
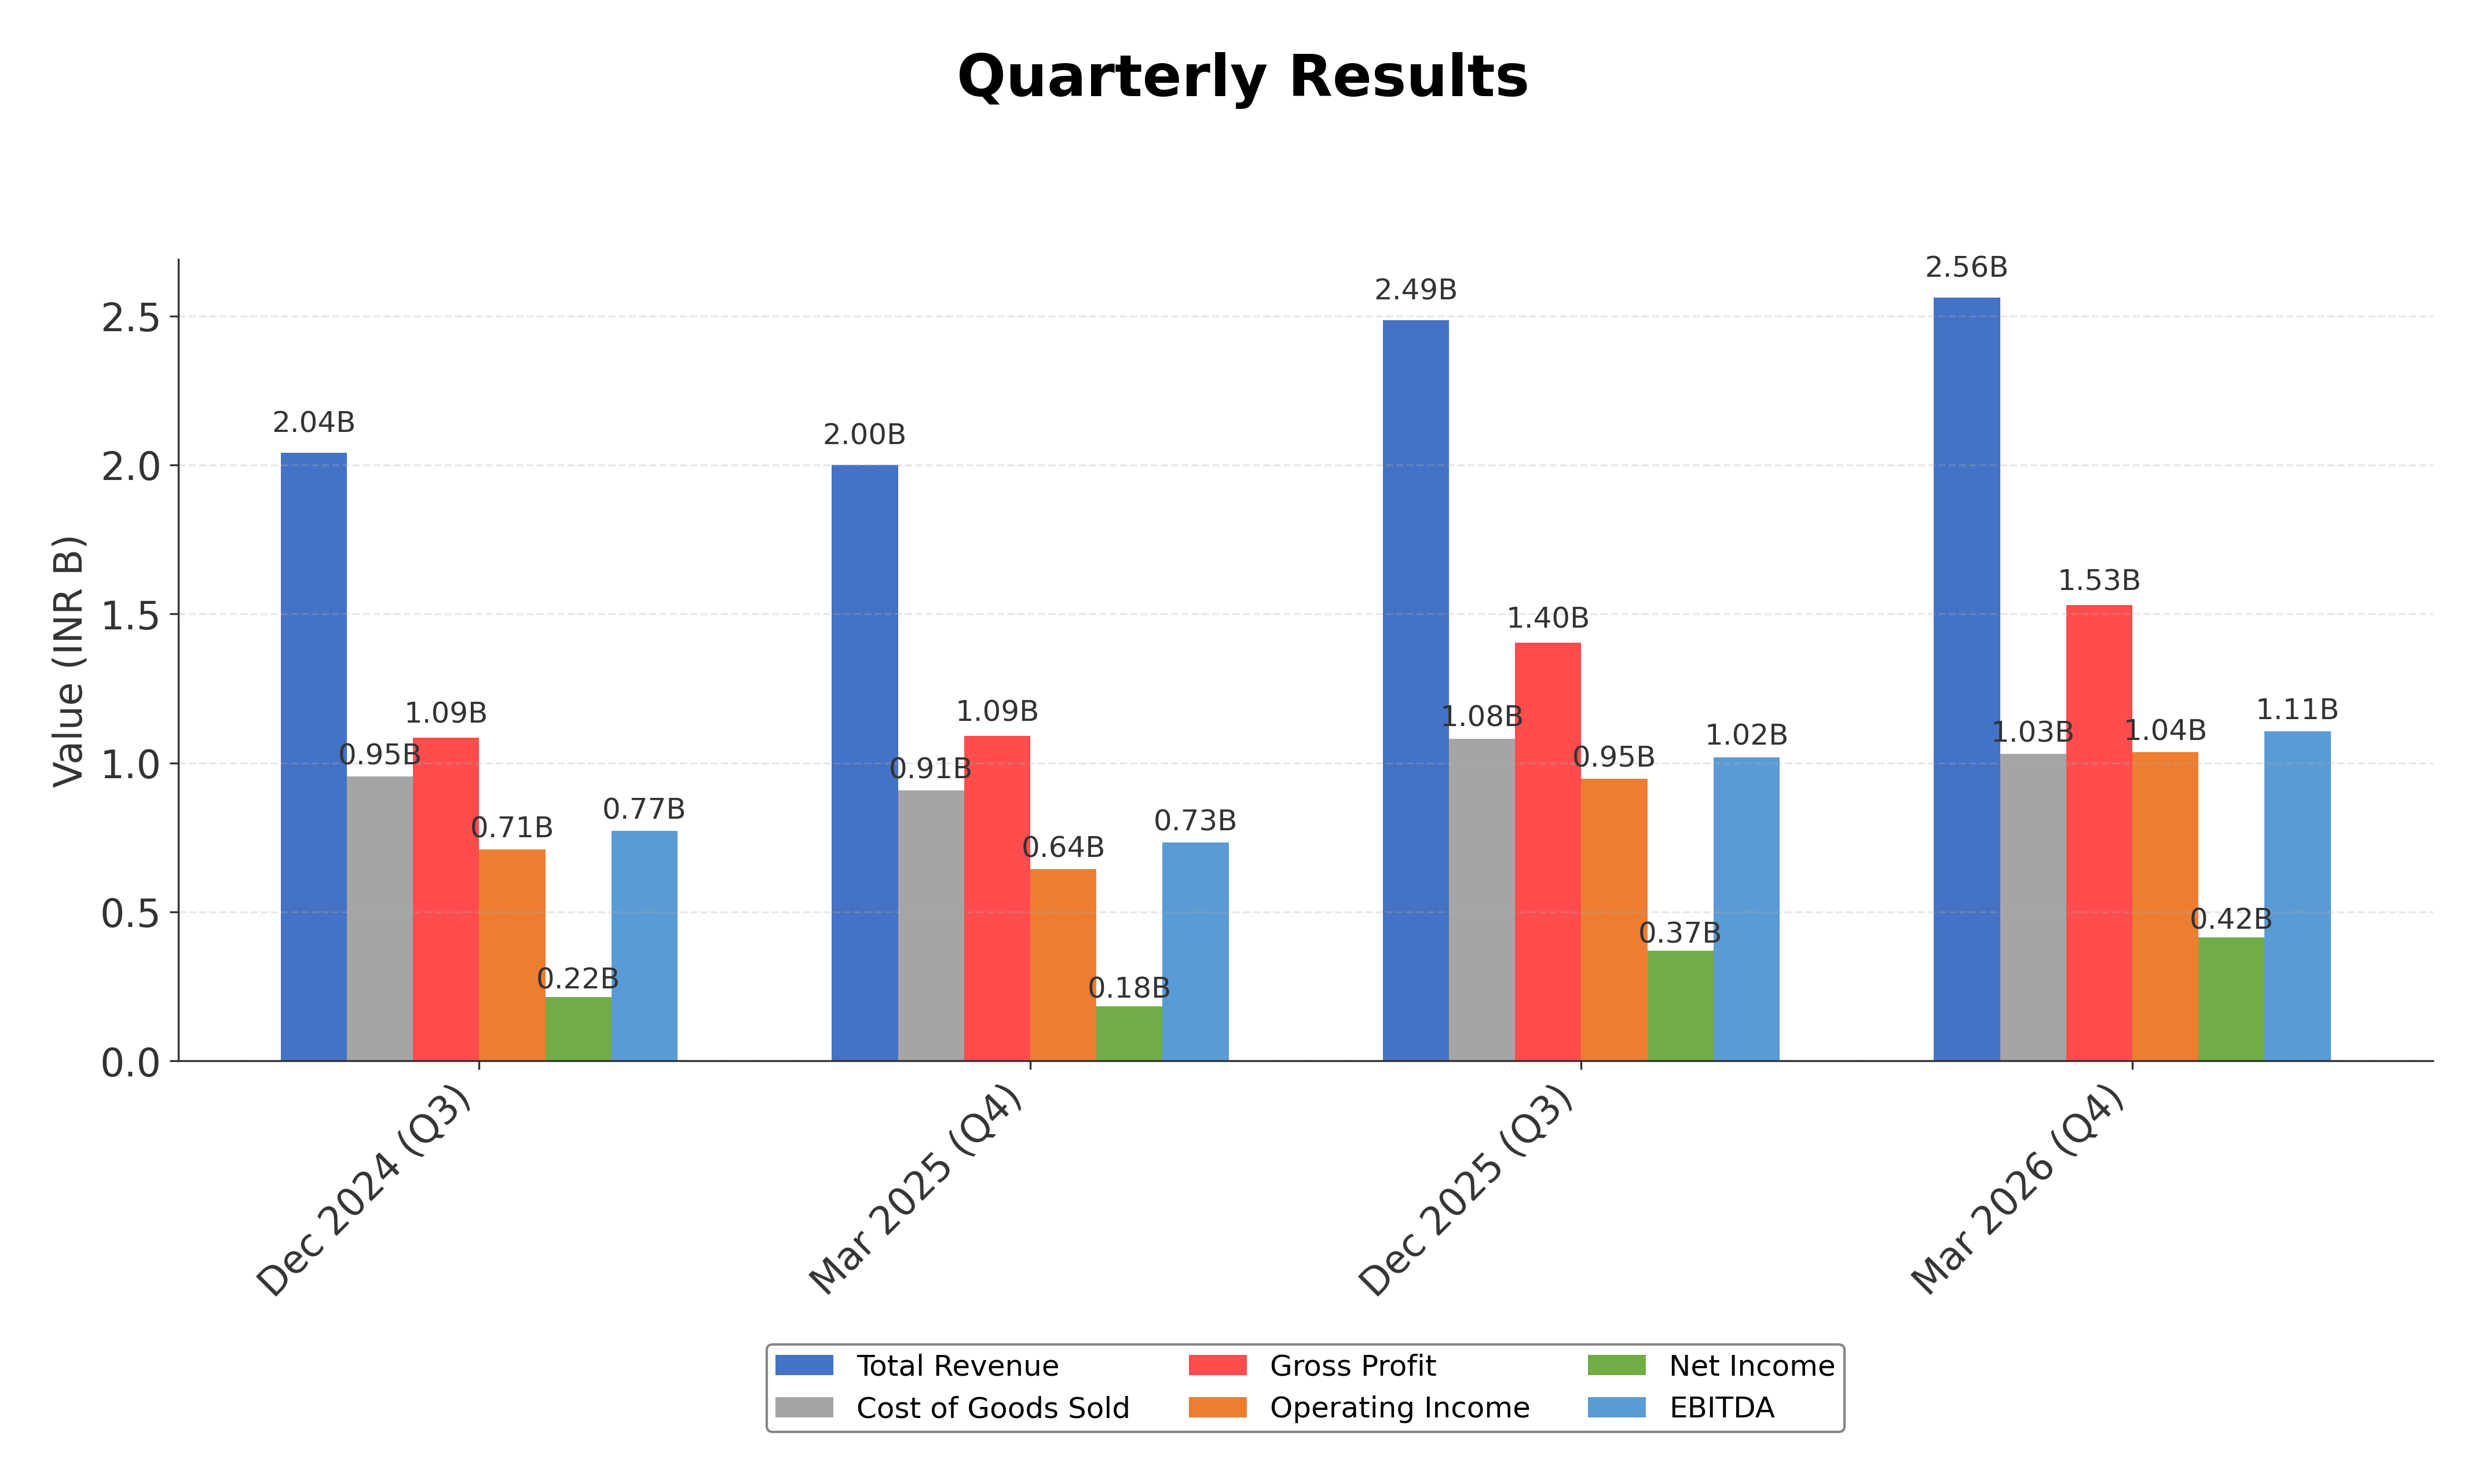
Financials
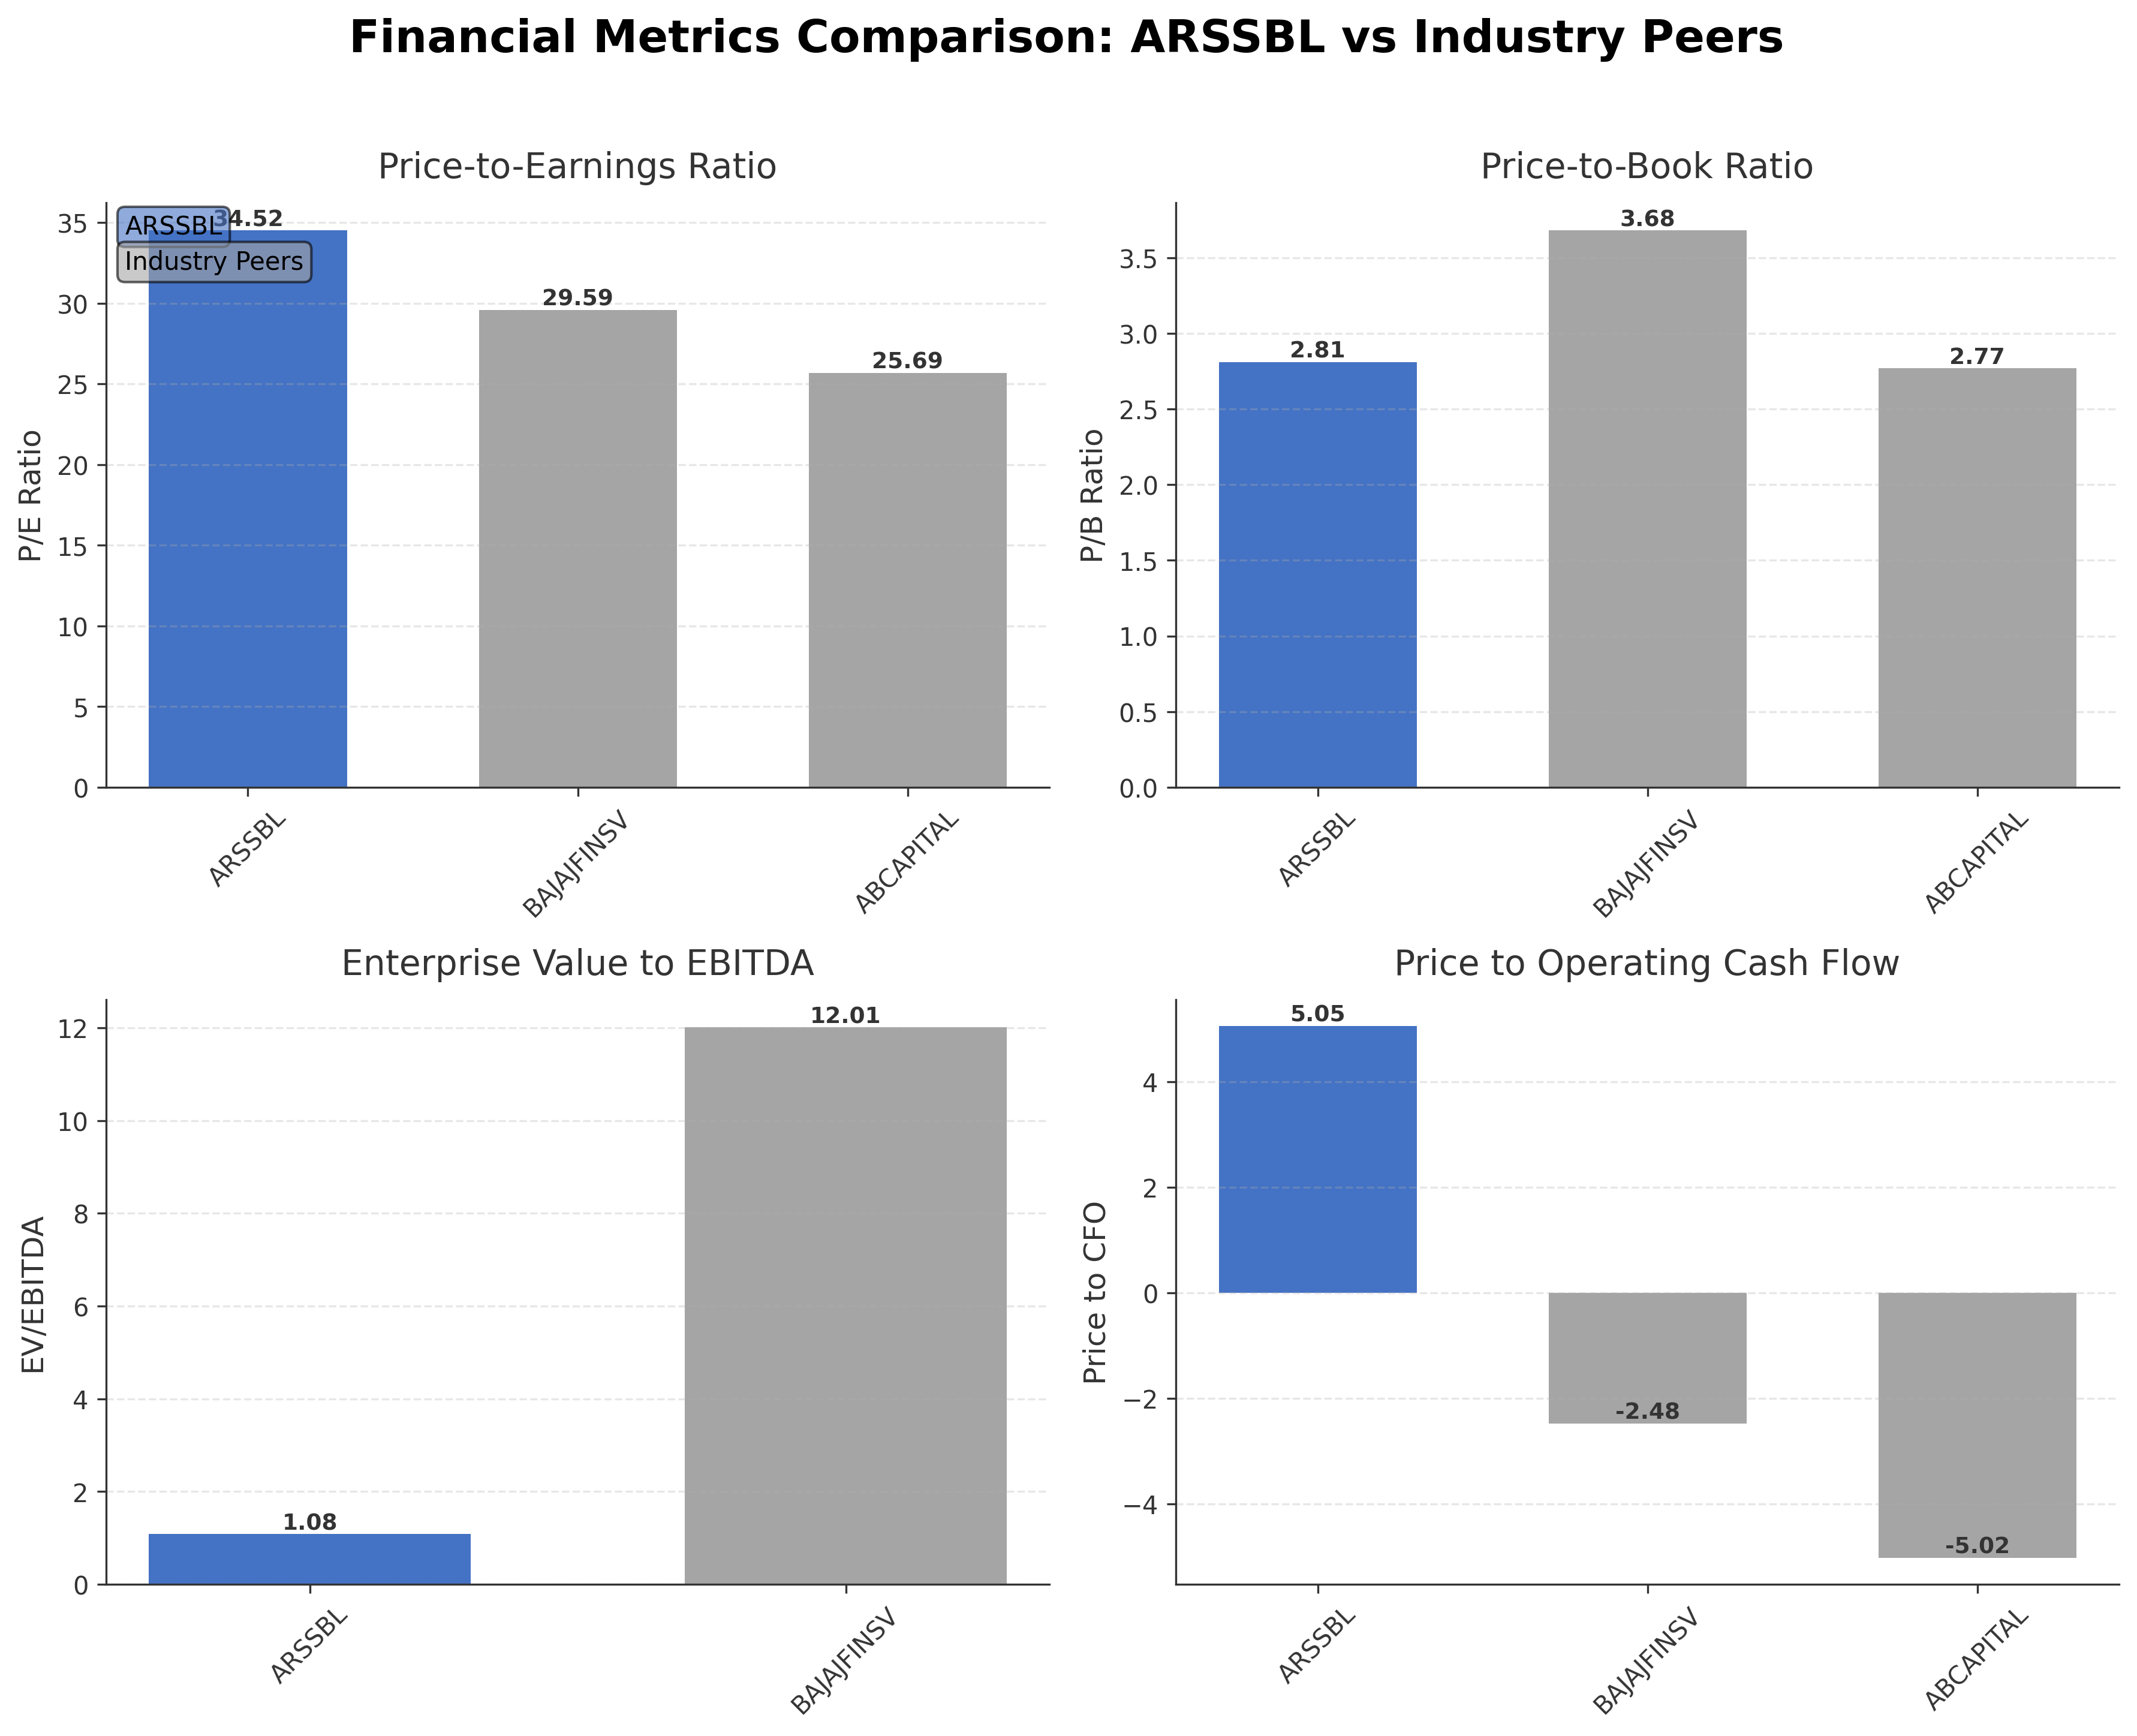
Peer Analysis
| Company Name | Market Cap | P/E Ratio | P/B Ratio | EV/EBITDA | Price to CFO |
|---|---|---|---|---|---|
| Anand Rathi Share and Stock Brokers Limited | ₹36.61B | 34.52 | 2.81 | 1.08 | 5.05 |
| Bajaj Finserv Ltd. | ₹2.83T | 29.59 | 3.68 | 12.01 | -2.48 |
| Aditya Birla Capital Ltd. | ₹892.55B | 25.69 | 2.77 | N/A | -5.02 |
| Piramal Enterprises Ltd. | ₹ 0.00 | N/A | N/A | N/A | N/A |
Comparison Analysis: Anand Rathi Share and Stock Brokers Limited exhibits a higher P/E ratio of 34.52 compared to peers Bajaj Finserv (29.59) and Aditya Birla Capital (25.69), indicating relatively higher earnings valuation. Its P/B ratio of 2.81 is competitive, slightly below Bajaj Finserv's 3.68 and comparable to Aditya Birla Capital's 2.77. The company's EV/EBITDA ratio at 1.08 is significantly lower than Bajaj Finserv's 12.01, suggesting more attractive enterprise valuation relative to earnings. Price to CFO is positive at 5.05, contrasting with negative values for peers, reflecting healthier cash flow generation. ROE at 14% is higher than Bajaj Finserv's 7% and Aditya Birla Capital's 10%, underscoring stronger profitability efficiency among regional peers.
Financial Metrics Comparison with Peers
Financial Statements
Comprehensive financial data including income, balance sheet, and cash flow metrics
Income Statement
| fiscal_date | 2026-03-31 | 2025-03-31 | 2024-03-31 | 2023-03-31 |
|---|---|---|---|---|
| Sales | 9.32B | 8.45B | 5.90B | 4.24B |
| Cost Of Goods | 4.02B | 4.01B | 3.42B | 2.66B |
| Gross Profit | 5.31B | 4.45B | 2.48B | 1.58B |
| Operating Expense Other Operating Expenses | 1.51B | 1.34B | 544.27M | 398.29M |
| Operating Income | 3.53B | 2.86B | 1.20B | 557.42M |
| Non Operating Interest Expense | 1.84B | 1.47B | 876.77M | 393.79M |
| Pretax Income | 1.72B | 1.40B | 1.15B | 509.91M |
| Income Tax | 423.01M | 367.72M | 381.09M | 132.46M |
| Net Income | 1.29B | 1.04B | 772.90M | 377.45M |
| Ebit | 3.56B | 2.87B | 2.03B | 903.70M |
| Ebitda | 3.82B | 3.13B | 2.24B | 1.05B |
| Net Income Continuous Operations | 1.72B | 1.40B | 1.15B | 509.91M |
| Preferred Stock Dividends | 0.00 | 0.00 | 0.00 | 0.00 |
| Operating Expense Selling General And Administrative | N/A | 329.03M | 274.31M | 245.17M |
| Non Operating Interest Income | N/A | 1.41B | 913.14M | 433.84M |
| Eps Basic | N/A | 16.52 | 12.32 | 6.02 |
| Eps Diluted | N/A | 16.52 | 12.32 | 6.02 |
| Basic Shares Outstanding | N/A | 62.73M | 62.73M | 62.73M |
| Diluted Shares Outstanding | N/A | 62.73M | 62.73M | 62.73M |
Source: Financial statements and regulatory filings
Balance Sheet
| fiscal_date | 2026-03-31 | 2025-03-31 | 2024-03-31 | 2023-03-31 |
|---|---|---|---|---|
| Cash And Cash Equivalents | 790.29M | 376.84M | 354.75M | 291.59M |
| Accounts Receivable | 3.14B | 2.53B | 2.47B | 2.04B |
| Total Assets | 70.99B | 33.65B | 25.85B | 16.29B |
| Total Liabilities | 57.51B | 28.61B | 21.92B | 13.64B |
| Long Term Debt | 8.31B | 809.65M | 2.34B | 1.25B |
| Shareholders Equity | 13.48B | 5.04B | 3.93B | 2.65B |
Source: Financial statements and regulatory filings
Cash Flow Statement
| fiscal_date | 2026-03-31 | 2025-03-31 | 2024-03-31 | 2023-03-31 |
|---|---|---|---|---|
| Operating Activities Net Income | 1.72B | 1.40B | 1.15B | 509.91M |
| Operating Activities Stock Based Compensation | 61.37M | 89.36M | 0.00 | 0.00 |
| Operating Activities Other Non Cash Items | -194.11M | -25.40M | -36.37M | -40.05M |
| Operating Activities Accounts Receivable | -4.94B | -755.59M | -2.85B | -1.34B |
| Operating Activities Other Assets Liabilities | -18.90B | -77.47M | 63.70M | 62.97M |
| Operating Activities Operating Cash Flow | -22.26B | 634.68M | -1.67B | -809.69M |
| Investing Activities Capital Expenditures | -165.17M | -388.20M | -353.66M | -109.98M |
| Investing Activities Net Intangibles | -29.87M | -40.82M | -26.20M | -19.33M |
| Investing Activities Purchase Of Investments | -12.99B | -6.66B | -6.40B | -1.68B |
| Investing Activities Investing Cash Flow | -13.16B | -7.05B | -6.68B | -1.79B |
| Financing Activities Common Stock Issuance | 7.45B | 0.00 | 500.00M | 0.00 |
| Financing Activities Financing Cash Flow | 7.45B | 263.22M | 5.06B | 1.47B |
| End Cash Position | 785.31M | 375.61M | 353.90M | 288.58M |
| Free Cash Flow | 7.05B | 6.49B | 1.49B | -57.37M |
| Financing Activities Long Term Debt Issuance | N/A | 1.35B | 4.56B | 1.47B |
| Financing Activities Long Term Debt Payments | N/A | -1.09B | N/A | N/A |
| Investing Activities Sale Of Investments | N/A | N/A | 65.67M | N/A |
Source: Financial statements and regulatory filings
Technical Analysis
Key Insights
- Current trend shows mixed price action with the stock trading above its 50-day moving average (₹503.30) but below the 200-day moving average (₹560.27), indicating potential consolidation.
- Key support levels are identified near ₹500 and ₹416 (52-week low), while resistance is observed around ₹600 and the 52-week high of ₹794.85.
- The stock is positioned above the 10-day moving average, suggesting short-term momentum, but remains below longer-term averages, reflecting cautious investor sentiment.
- Momentum indicators show RSI near neutral levels, MACD exhibiting a recent bullish crossover, and Stochastic oscillators indicating moderate upward momentum.
- Multi-timeframe analysis reveals daily charts with consolidation, weekly charts showing sideways movement, and monthly charts indicating a longer-term uptrend.
- Potential market scenarios include a breakout above ₹600 leading to retesting of recent highs or a fallback to support levels if selling pressure increases.
Trending News
Summary: Representing India in this global financial competition is Prof. Roop Bhootra, CEO of ANAND RATHI SHARE AND STOCK BROKERS LIMITED. With decades of experience
Sentiment: neutral
2. Headline: Anand Rathi Wealth 31st AGM Notice and FY 2025-26 Report
Summary: Anand Rathi Wealth announces its 31st AGM for May 2026. Review key FY 2025-26 highlights, including a 28% PAT growth and AUM hitting the ₹1,00,000 crore mark.
Sentiment: positive
3. Headline: Anand Rathi Wealth Files FY 2025-26 Business Responsibility and Sustainability Report - TipRanks.com
Summary: An announcement from Anand Rathi Wealth Ltd. ( ($IN:ANANDRATHI) ) is now available. Anand Rathi Wealth Limited has submitted its Business Responsibility and Sustain...
Sentiment: neutral
4. Headline: Anand Rathi Stock Broking: Can Diversification Reduce Market Dependence?
Summary: FY26 performance of Anand Rathi shows an evolution in the form of diversification in the face of a turbulent business climate.
Sentiment: positive
5. Headline: Anand Rathi unveils ‘Market Melodies’, AI-driven series on investor stories
Summary: Anand Rathi Share and Stock Brokers Limited today unveiled Market Melodies, a digital initiative merging financial awareness with technology through music-led storytelling.
Sentiment: neutral
Recent Updates
News Summary
As of 14 April 2026. Anand Rathi Share and Stock Brokers Limited reported a strong Q4 performance with revenue rising 28.1% year-on-year and profit after tax more than doubling to ₹41.6 crore. The company declared a ₹5 final dividend, reflecting robust cash flows and profitability. Broking revenues grew 14.5%, supported by a 34.3% increase in distribution income, indicating diversification in revenue streams. The stock price recovered sharply by 37% over eight trading sessions following these results, though it remains 27% below its all-time high. Additionally, the company launched an AI-driven digital series, 'Market Melodies,' to enhance investor education and engagement through innovative content. These developments underscore the company’s focus on client-centric growth and technological adoption.
News Sentiment
The overall sentiment from recent updates is positive, driven by strong quarterly earnings growth, significant dividend declarations, and strategic digital initiatives. The 125.7% surge in profit after tax and the 100% dividend announcement have bolstered investor confidence and market perception. The launch of AI-enabled content reflects a forward-looking approach to client engagement. Neutral sentiment arises from participation in global events and routine corporate announcements, balancing the positive momentum. The combination of financial strength and innovation supports a constructive outlook on the company’s operational trajectory.
Source List
Analytical Overview
Analysis Summary
Anand Rathi's trailing P/E ratio of 34.52 aligns closely with the industry average, indicating valuation in line with sector norms. The absence of a forward P/E limits forward-looking valuation insights. Revenue growth of 28% year-on-year and positive cash flow trends, with operating cash flow of ₹7.25 billion TTM, demonstrate a solid growth trajectory supported by diversified income streams. The company maintains a moderate debt-to-equity ratio of 61.64%, balanced by substantial cash reserves exceeding ₹35 billion, reflecting sound financial health. Sector-specific challenges include regulatory scrutiny and market volatility, while opportunities arise from digital innovation and expanding retail participation in financial markets. Given the Indian market context, regulatory environment and consumer trends favor firms with strong compliance and technology adoption.
Overall Business and Market Assessment
Supporting Factors: No data
Risk Factors: regulatory changes and competitive pressures that could impact brokerage volumes and margins
SWOT Analysis
Strengths
- Strong cash reserves exceeding ₹35 billion support operational flexibility.
- Robust revenue growth of 28% year-on-year demonstrates business expansion.
- High return on equity at 13.96% indicates efficient capital utilization.
- Diversified revenue streams including broking, margin trading, and distribution.
Weaknesses
- Trailing P/E ratio of 34.52 is relatively high compared to some peers.
- Debt-to-equity ratio of 61.64% suggests moderate leverage.
- Limited insider ownership may reduce direct management alignment with shareholders.
- Absence of forward P/E ratio limits forward valuation clarity.
Opportunities
- Digital initiatives like AI-driven content can enhance client engagement.
- Growing retail investor participation in India’s financial markets.
- Potential to expand distribution income and margin trading segments.
- Increasing institutional investor interest supports capital access.
Threats
- Regulatory changes in financial services could impact operations.
- Competitive pressures from larger financial conglomerates.
- Market volatility may affect brokerage revenues and client activity.
- Economic fluctuations in India could influence investor sentiment.
Company Description
Anand Rathi Share and Stock Brokers Limited is a leading financial services provider in India, operating as the brokerage arm of the Anand Rathi Group. Established in 1994, the firm offers a broad spectrum of brokerage and investment services, including equity, derivatives, commodities, and currency trading, as well as margin trading and distribution of diverse financial products. Anand Rathi Share and Stock Brokers Limited caters to a wide client base—retail investors, high-net-worth individuals, and institutional clients—through a mix of physical branches and advanced digital platforms, ensuring accessibility across the country. As a wholly owned subsidiary of Anand Rathi Financial Services Limited, the company forms a strategic pillar within the group, complementing its private wealth and insurance businesses. The organization is renowned for its client-centric approach, robust research capabilities, and a commitment to ethical standards and innovation. With a seasoned leadership team and more than three decades of sector experience, Anand Rathi Share and Stock Brokers Limited plays a pivotal role in supporting the growth, diversification, and financial inclusion within India’s capital markets.