
Anand Rathi Share and Stock Brokers Limited (ARSSBL)
Stock Analysis Report
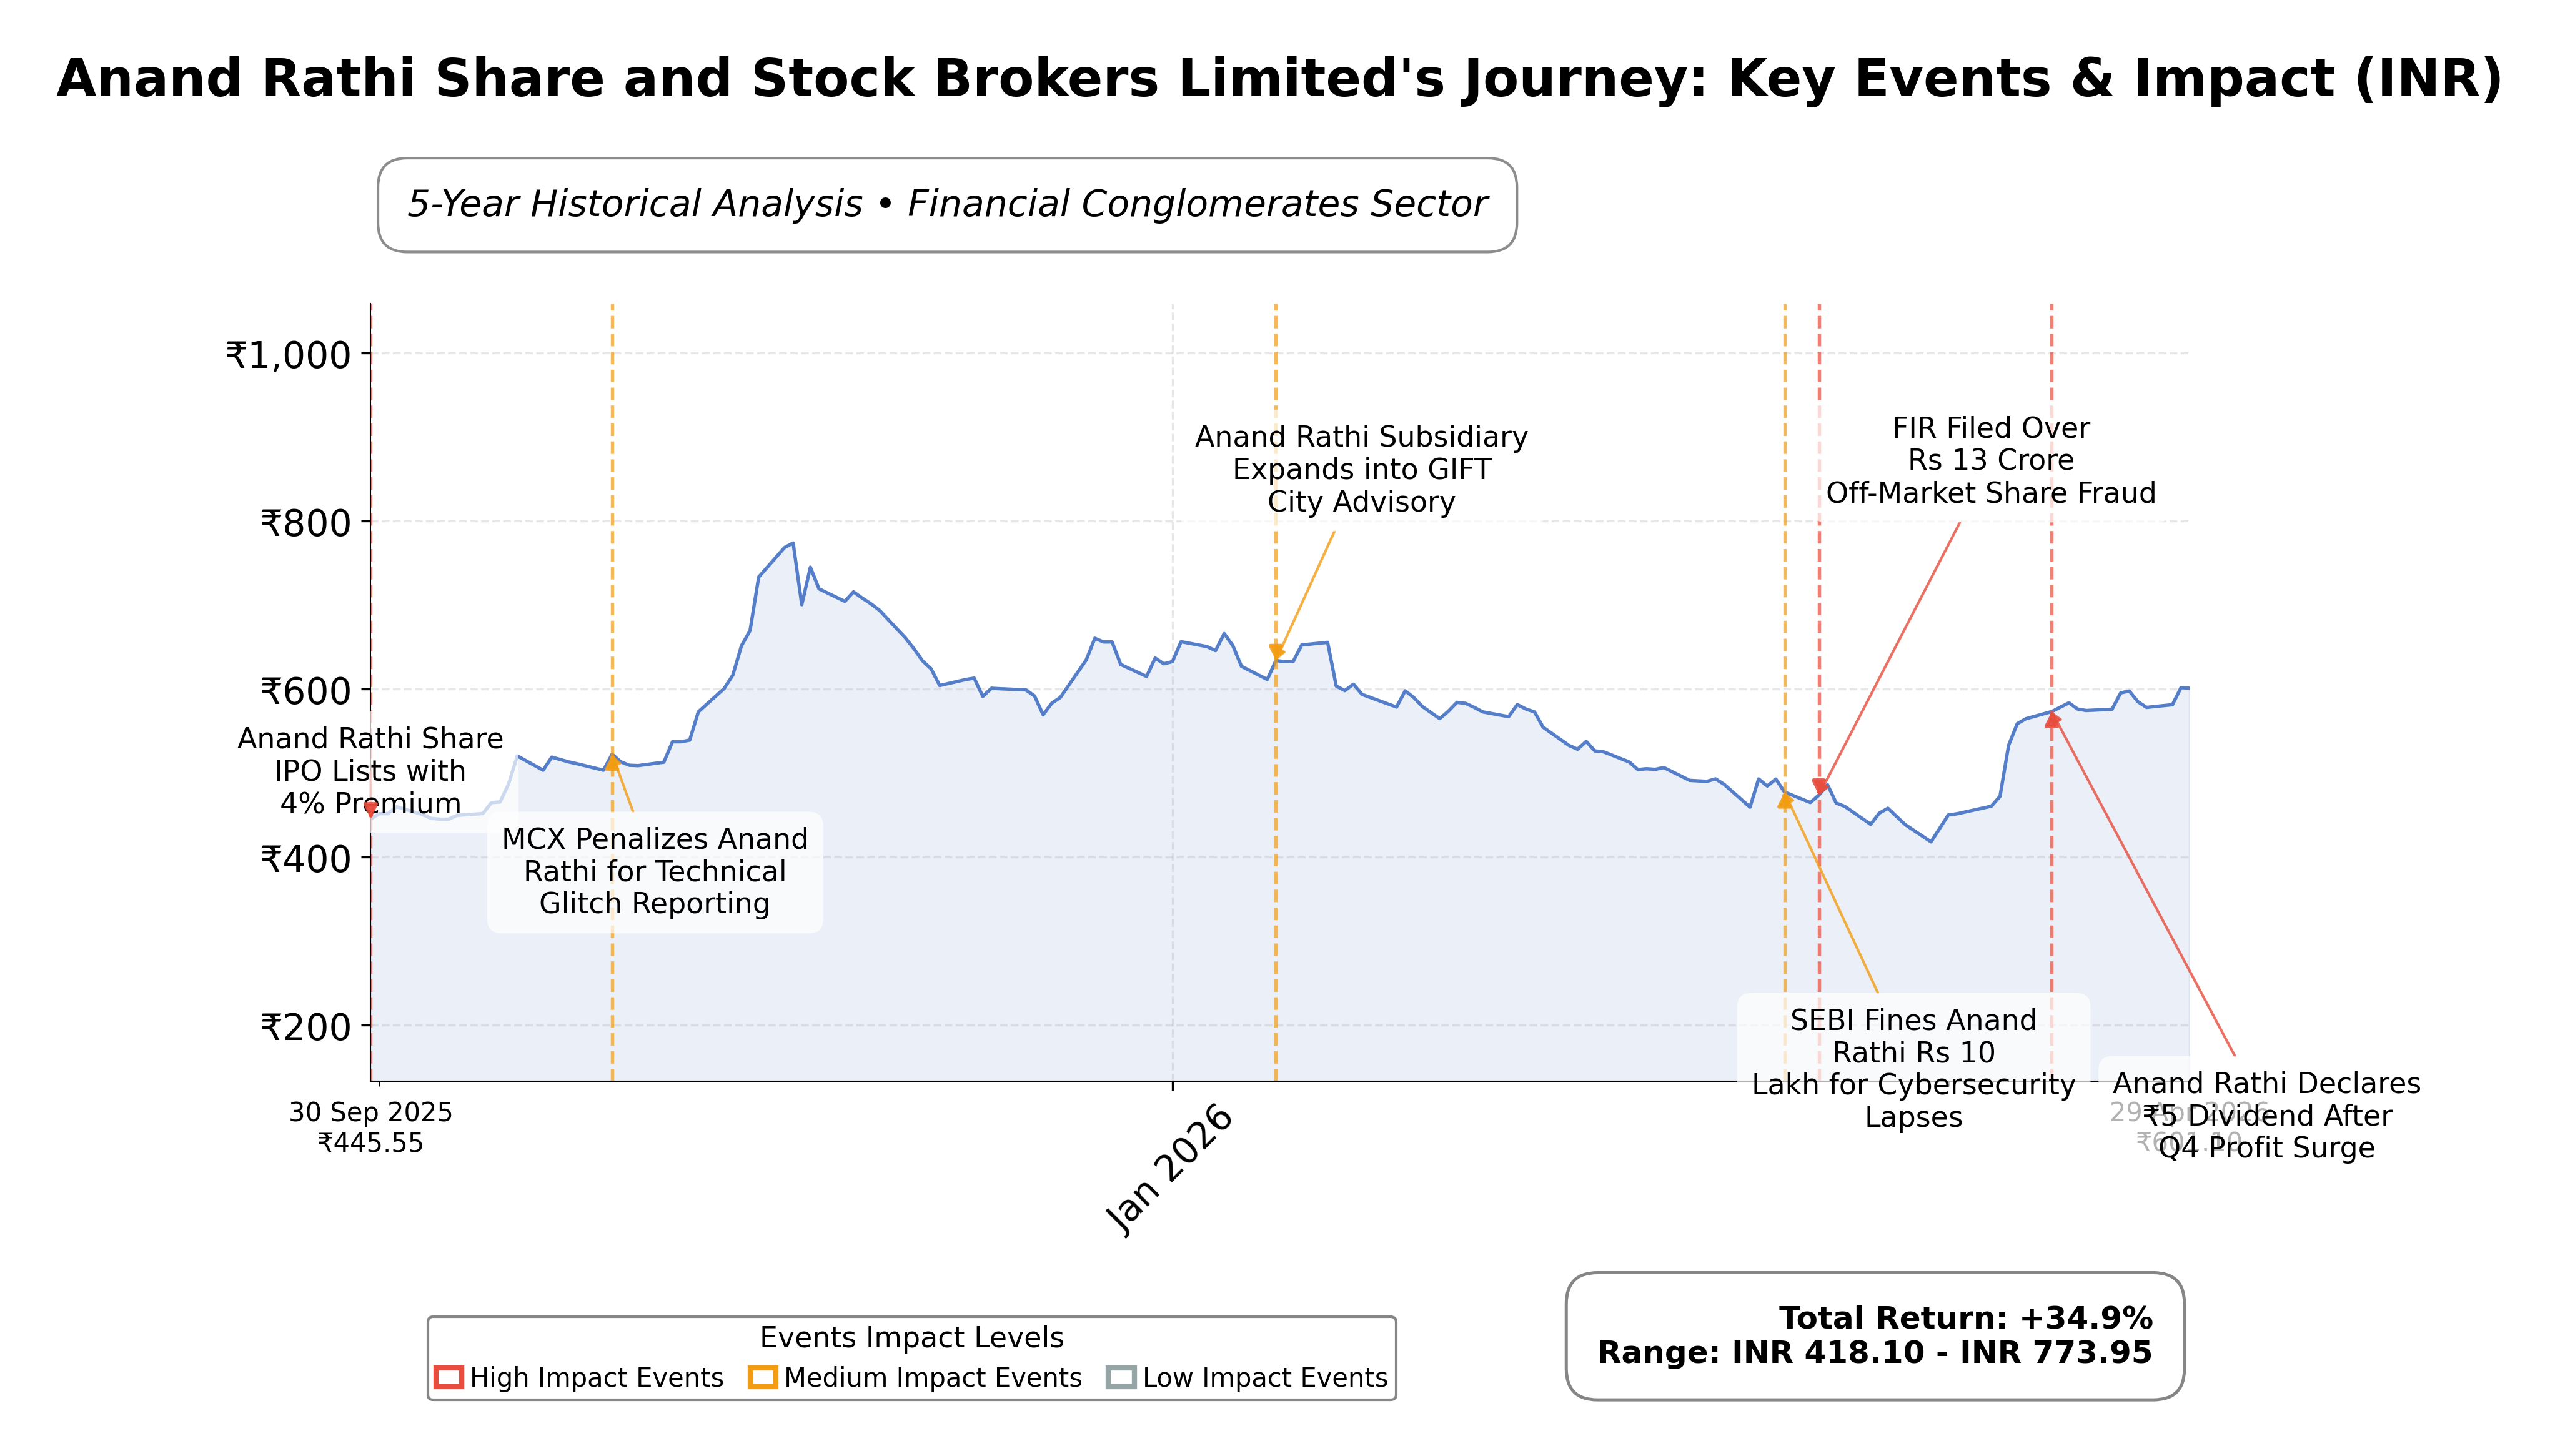
Stock Journey
Key Positives and Key Risks
Pros
- Strong revenue growth of 28% year-over-year in the latest quarter demonstrates robust business expansion.
- High return on equity at 13.96% indicates efficient use of shareholder capital.
- Substantial cash reserves of ₹35.48 billion provide financial flexibility and support operations.
Cons
- Trailing P/E ratio of 34.52 is relatively high, suggesting the stock may be priced at a premium.
- Current ratio of 1.04 indicates limited short-term liquidity cushion.
- Regulatory and operational risks, including recent fraud-related share reversals, pose potential challenges.
Disclosure: This information is for general awareness and does not constitute investment advice
Report Summary
Anand Rathi Share and Stock Brokers Limited (ARSSBL) operates as a prominent financial services provider in India, specializing in brokerage and investment services across equities, derivatives, commodities, and currency trading. Listed on the NSE under the symbol ARSSBL, the company is part of the Financial Services sector and functions as the brokerage arm of the Anand Rathi Group. It serves a diverse clientele including retail investors, high-net-worth individuals, and institutional clients through both physical branches and digital platforms, positioning itself as a key player in India’s capital markets.
Financially, ARSSBL reported trailing twelve months (TTM) revenue of approximately ₹7.5 billion with a gross margin of 59.75%, an operating margin of 26.13%, and a net profit margin of 17.23%. The company’s return on equity (ROE) stands at 13.96%, while return on assets (ROA) is 2.47%, indicating moderate profitability and efficient asset utilization. Its operating cash flow for the TTM is ₹7.25 billion, reflecting strong cash generation capabilities, and the free cash flow is ₹1.29 billion, supporting operational sustainability.
Valuation metrics reveal a trailing price-to-earnings (P/E) ratio of 34.52, aligning with the industry average P/E of 34.52, and a price-to-book (P/B) ratio of 2.81. The enterprise value to EBITDA (EV/EBITDA) ratio is notably low at 1.08, suggesting attractive valuation relative to earnings before interest, taxes, depreciation, and amortization. The stock currently trades at ₹599, within a 52-week range of ₹794.85 (high) to ₹416 (low), indicating a 32.7% downside risk from the high, reflecting recent price volatility.
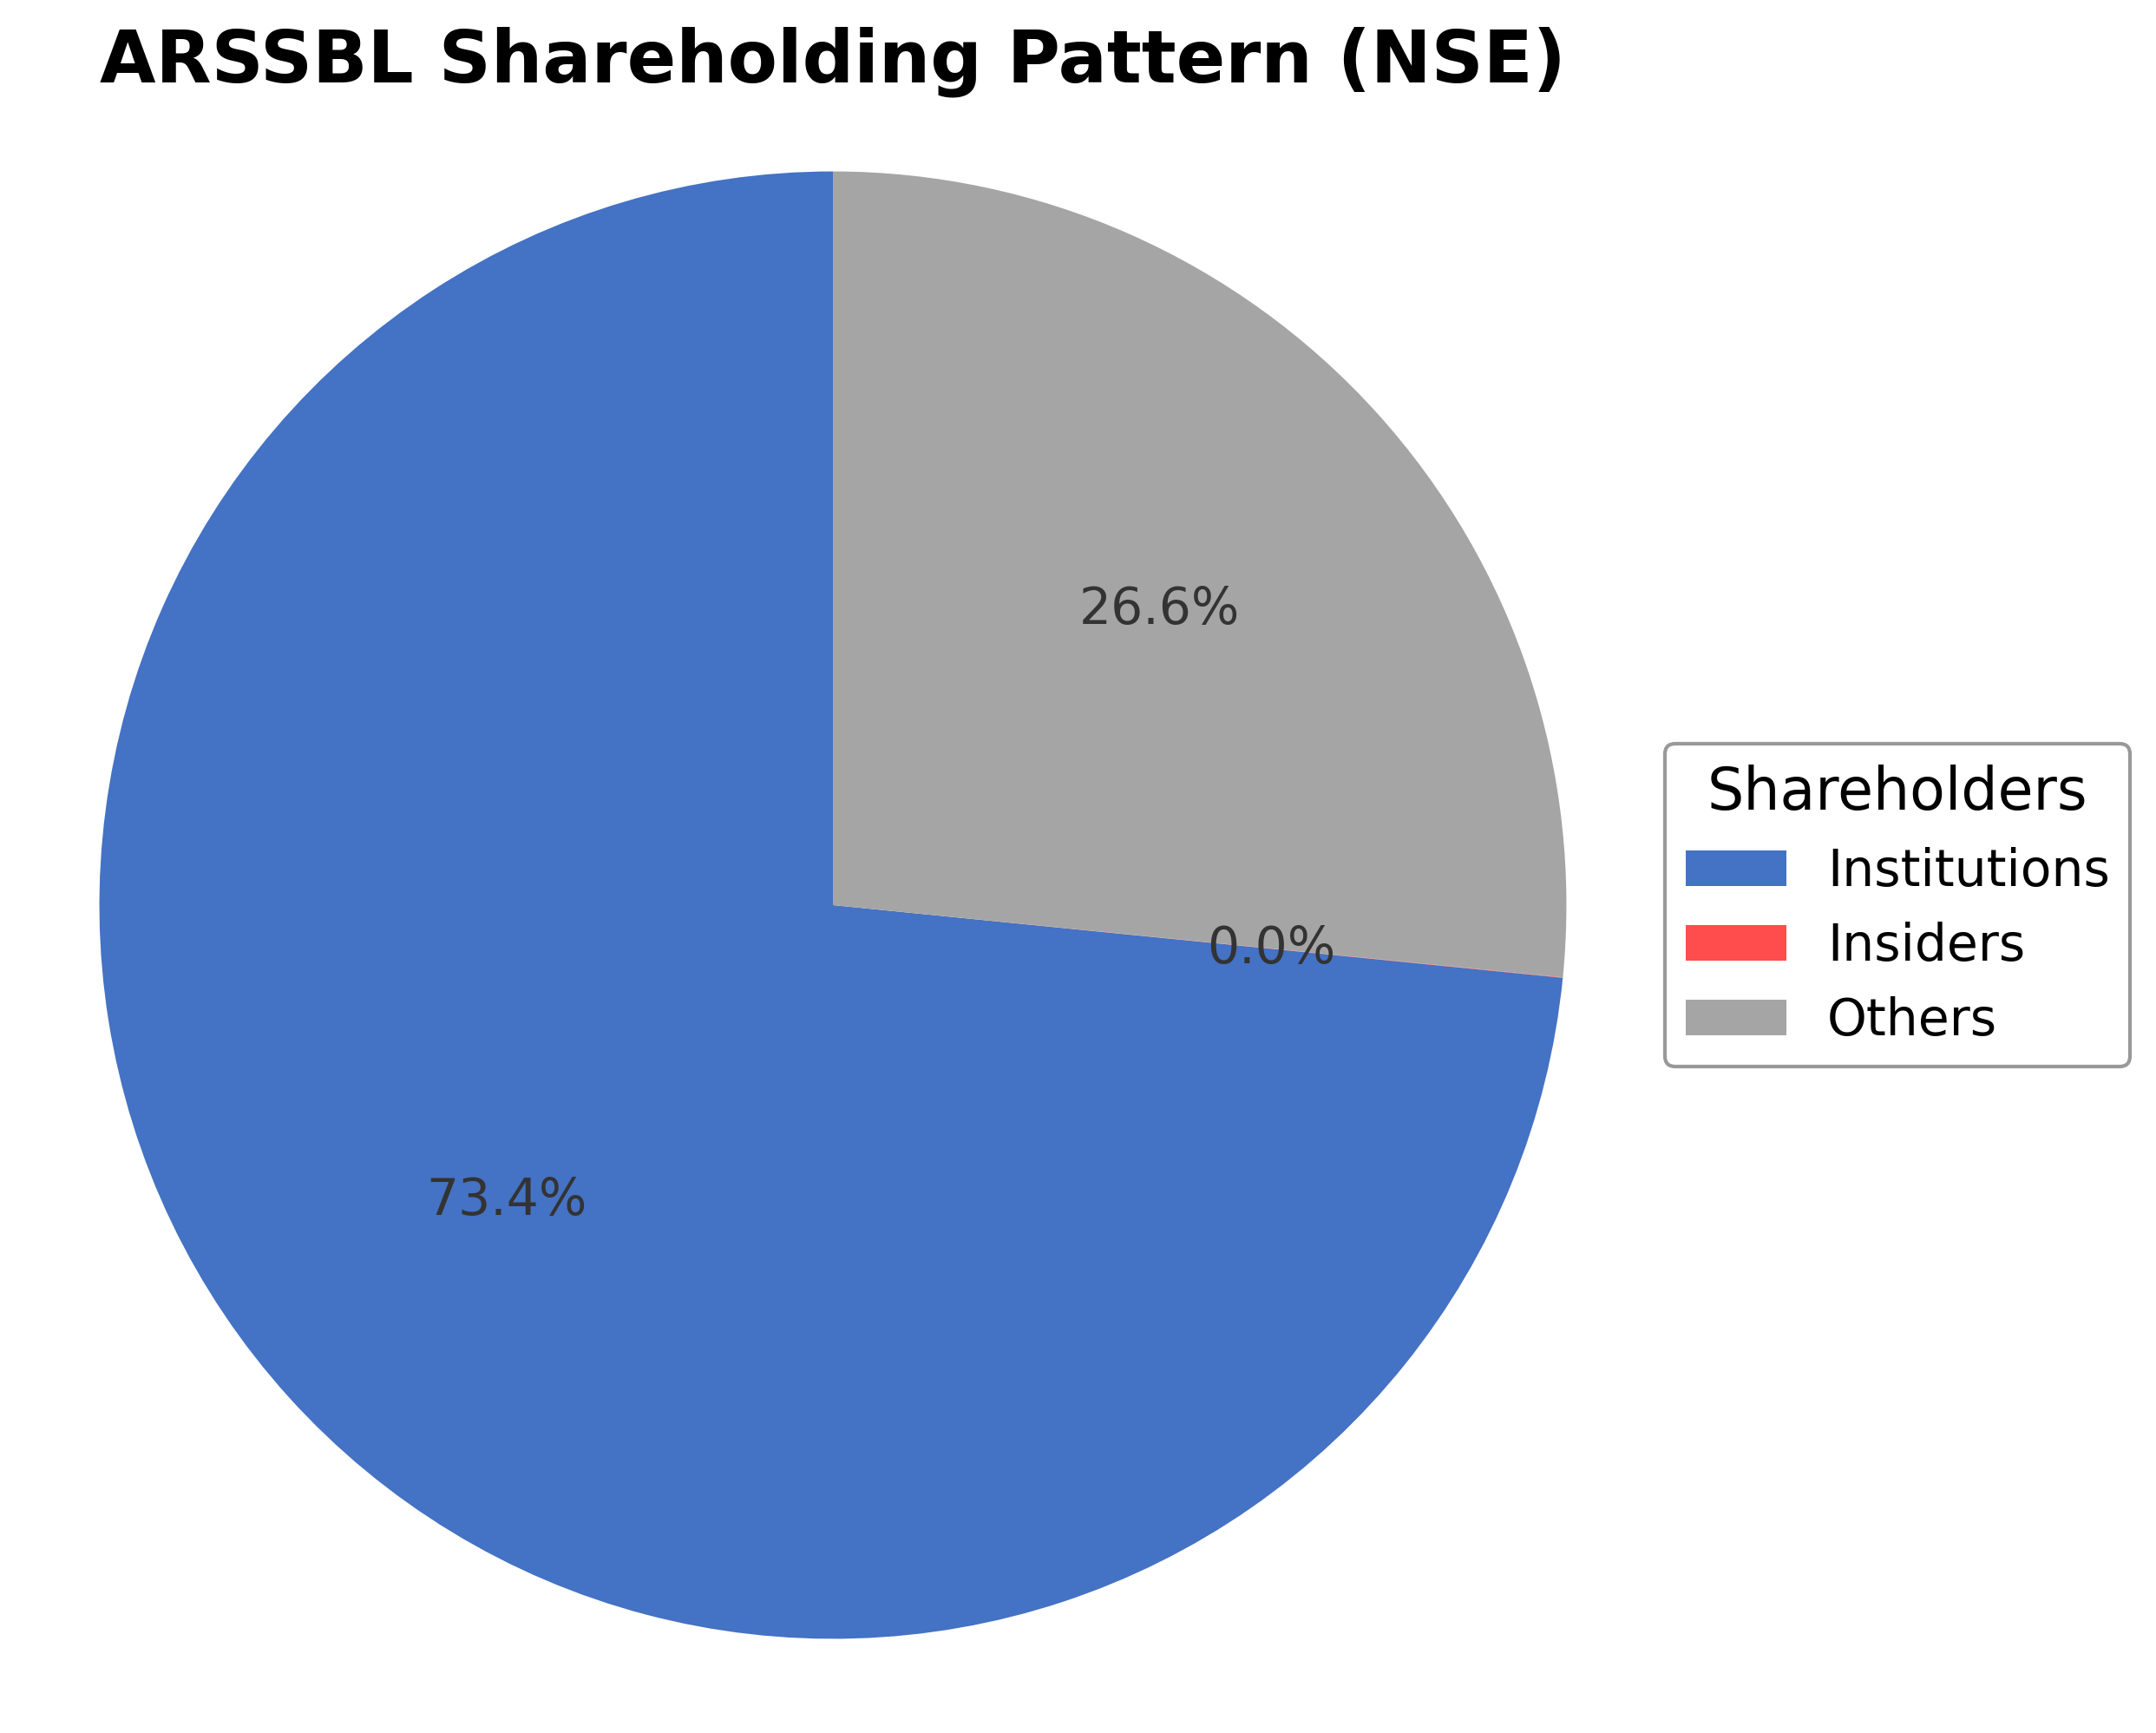
Key strengths include a robust cash position of ₹35.48 billion against total debt of ₹8.31 billion, yielding a debt-to-equity ratio of 61.64%, and a current ratio slightly above 1, indicating adequate short-term liquidity. The company’s market capitalization is ₹36.61 billion, supported by institutional ownership of approximately 73.42%. Risks involve regulatory compliance challenges, competitive pressures in the brokerage space, and macroeconomic factors affecting market volumes. Recent strategic actions include dividend declarations and maintaining a client-centric approach to strengthen market positioning.
Technically, the stock trades below its 200-day moving average of ₹560.27 but above the 50-day moving average of ₹503.30, with momentum indicators showing mixed signals. Recent news highlights strong quarterly earnings growth and dividend announcements, balanced by operational challenges such as fraud-related share reversals. Current conditions suggest a cautious stance with potential for accumulation as the company navigates evolving market dynamics.
Company and Industry Overview
Company Basics
Price Performance
Company Size
Shareholding Pattern
Sector and Industry Analysis
The Indian financial services sector, particularly the brokerage and wealth management segment, has witnessed robust growth driven by increasing retail participation and rising financial literacy. The market size has expanded significantly with digital adoption and the proliferation of online trading platforms. Key players include established full-service brokers and discount brokers, with firms like Zerodha, ICICI Securities, and Anand Rathi Share and Stock Brokers Limited commanding notable market shares.
Industry trends highlight a shift towards technology-enabled services, margin trading facilities, and diversified product offerings to cater to retail, HNI, and institutional clients. Competitive dynamics are shaped by the ability to provide seamless digital experiences, cost efficiency, and personalized wealth management solutions. Barriers to entry include regulatory compliance, technology investment, and building a trusted brand, positioning established players with multi-vertical financial services as preferred choices.
The regulatory environment is governed by the Securities and Exchange Board of India (SEBI), which enforces stringent norms on capital adequacy, client protection, and transparency. Recent regulations emphasize investor protection, enhanced disclosure, and risk management, impacting brokerage operations and product distribution. The outlook remains cautiously optimistic as regulatory frameworks evolve to balance market integrity with innovation and growth in financial services.
Note: Analysis synthesized from industry research, market reports, and regulatory filings. Information is subject to change based on market conditions.
Financial Ratios Dashboard
Illustrative Scenario Analysis
DCF Assumptions:
Method: Two-Stage EPS-Priority Model
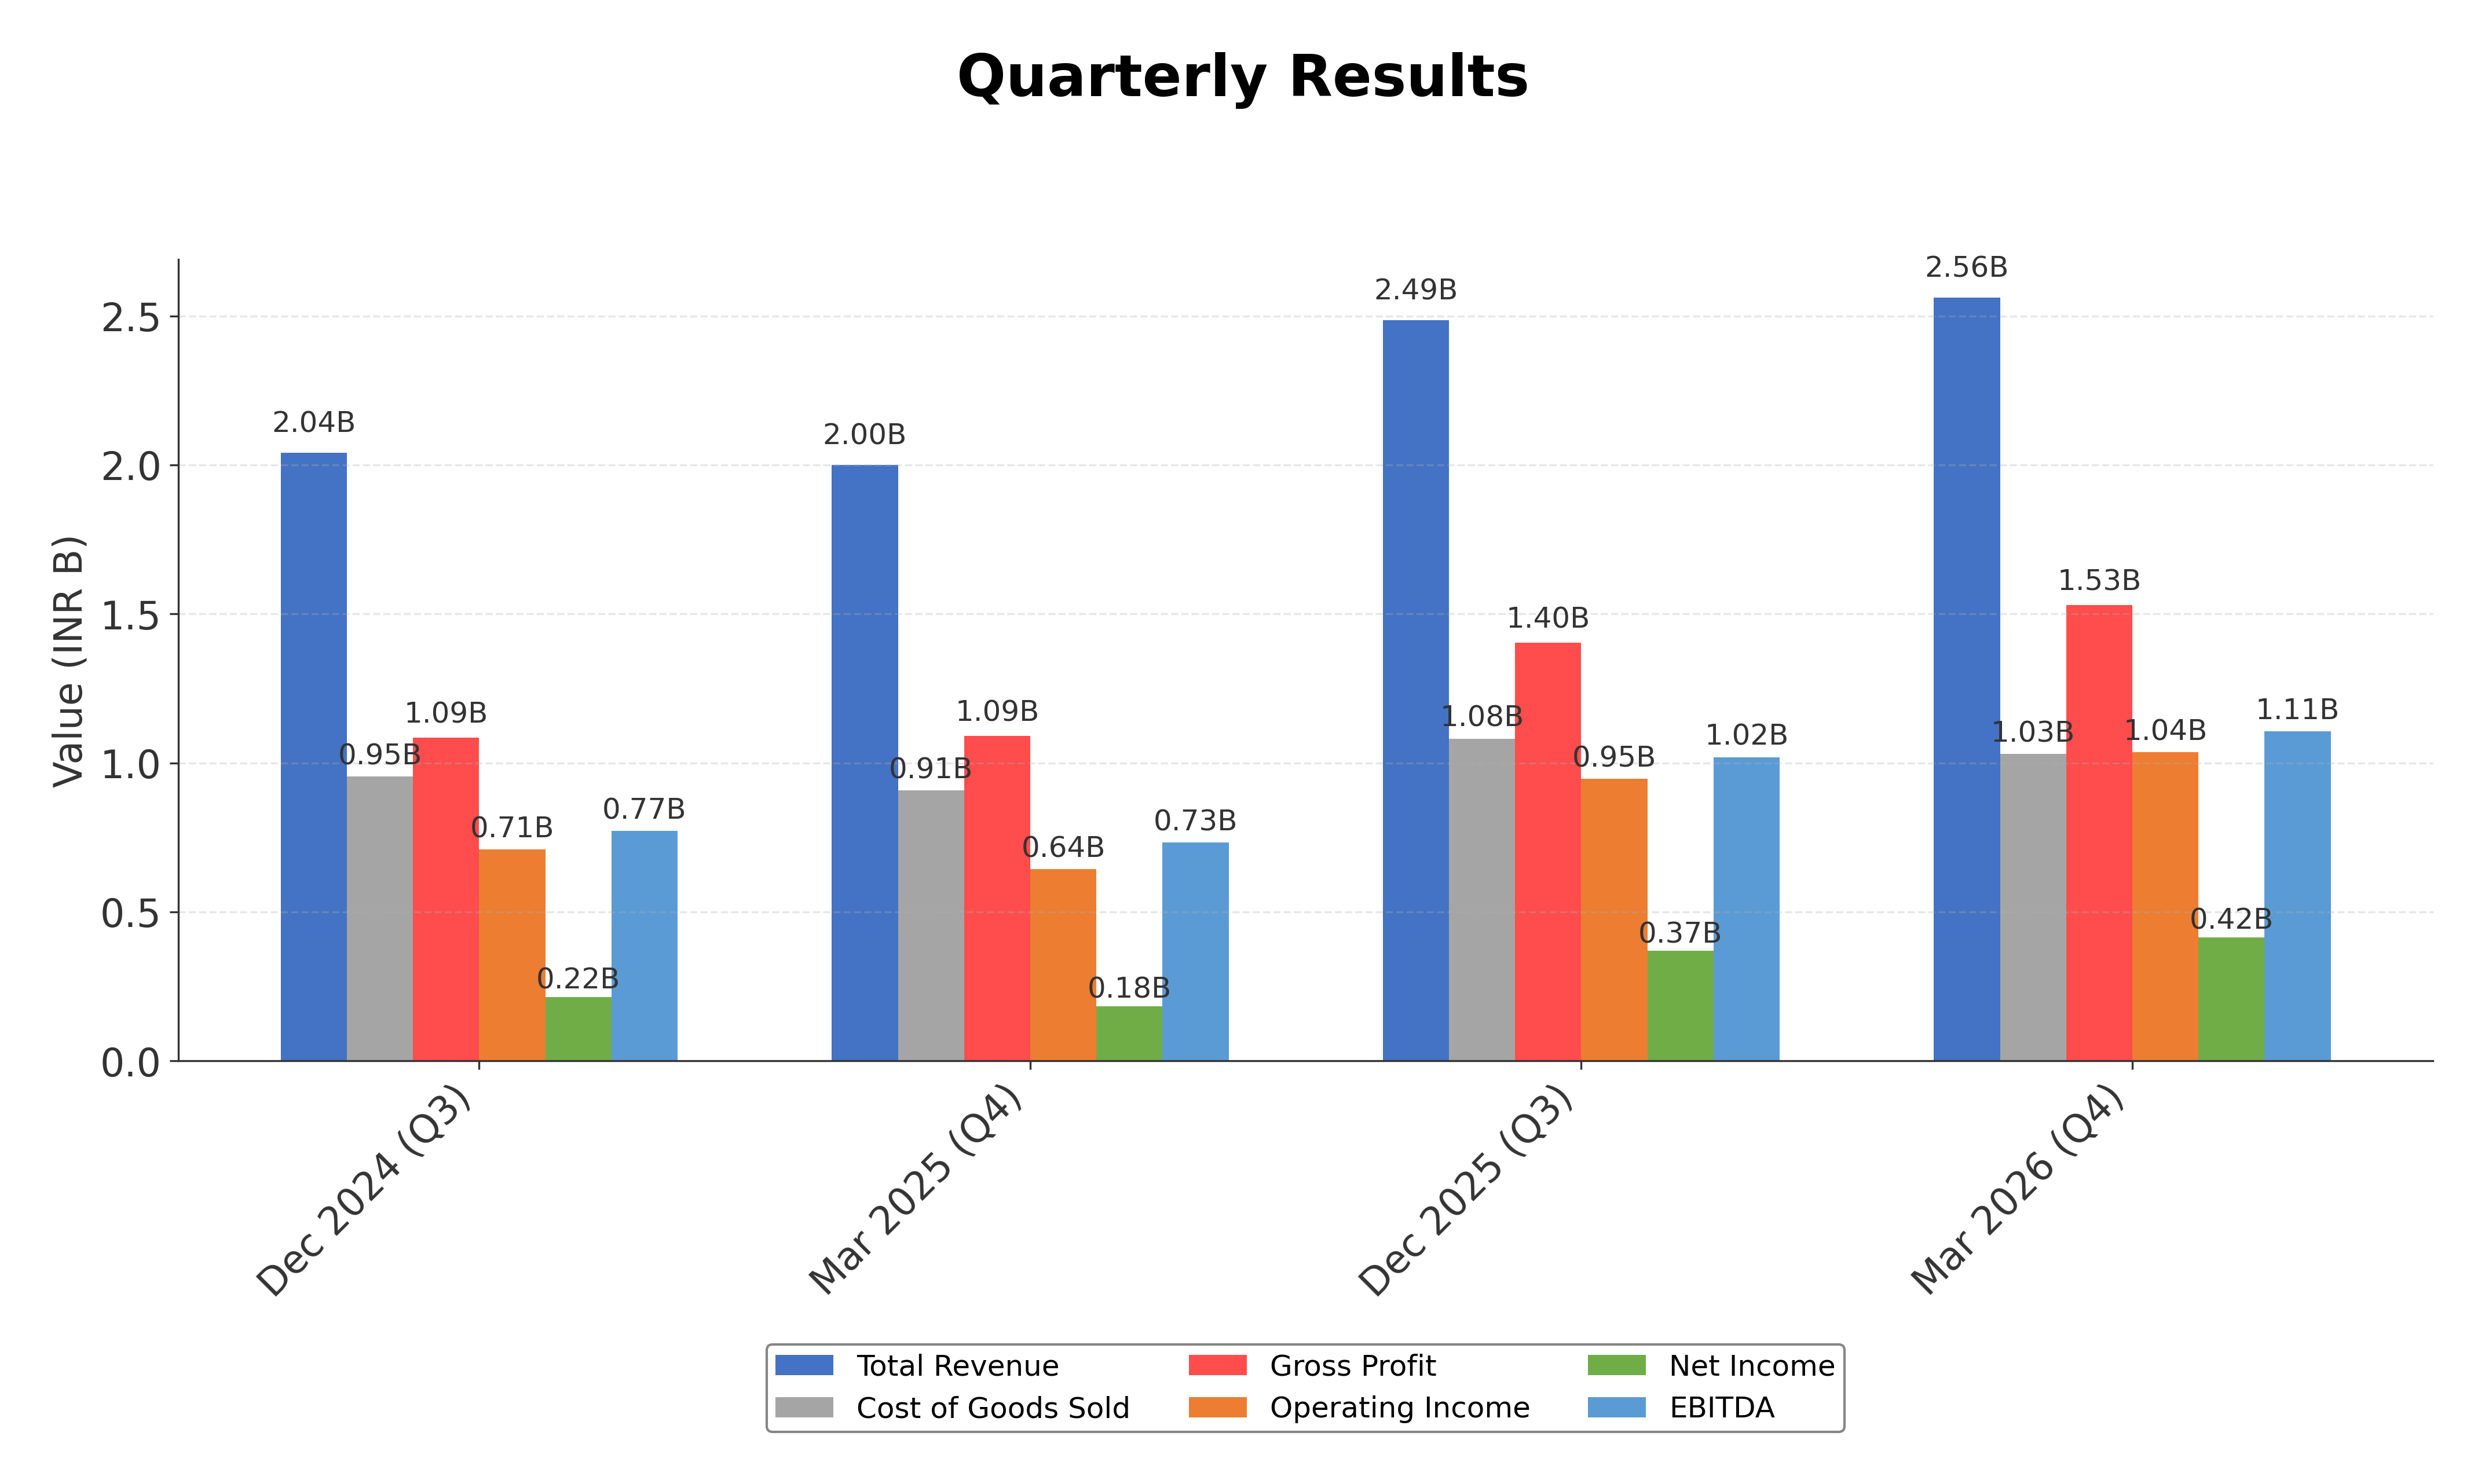
Financials
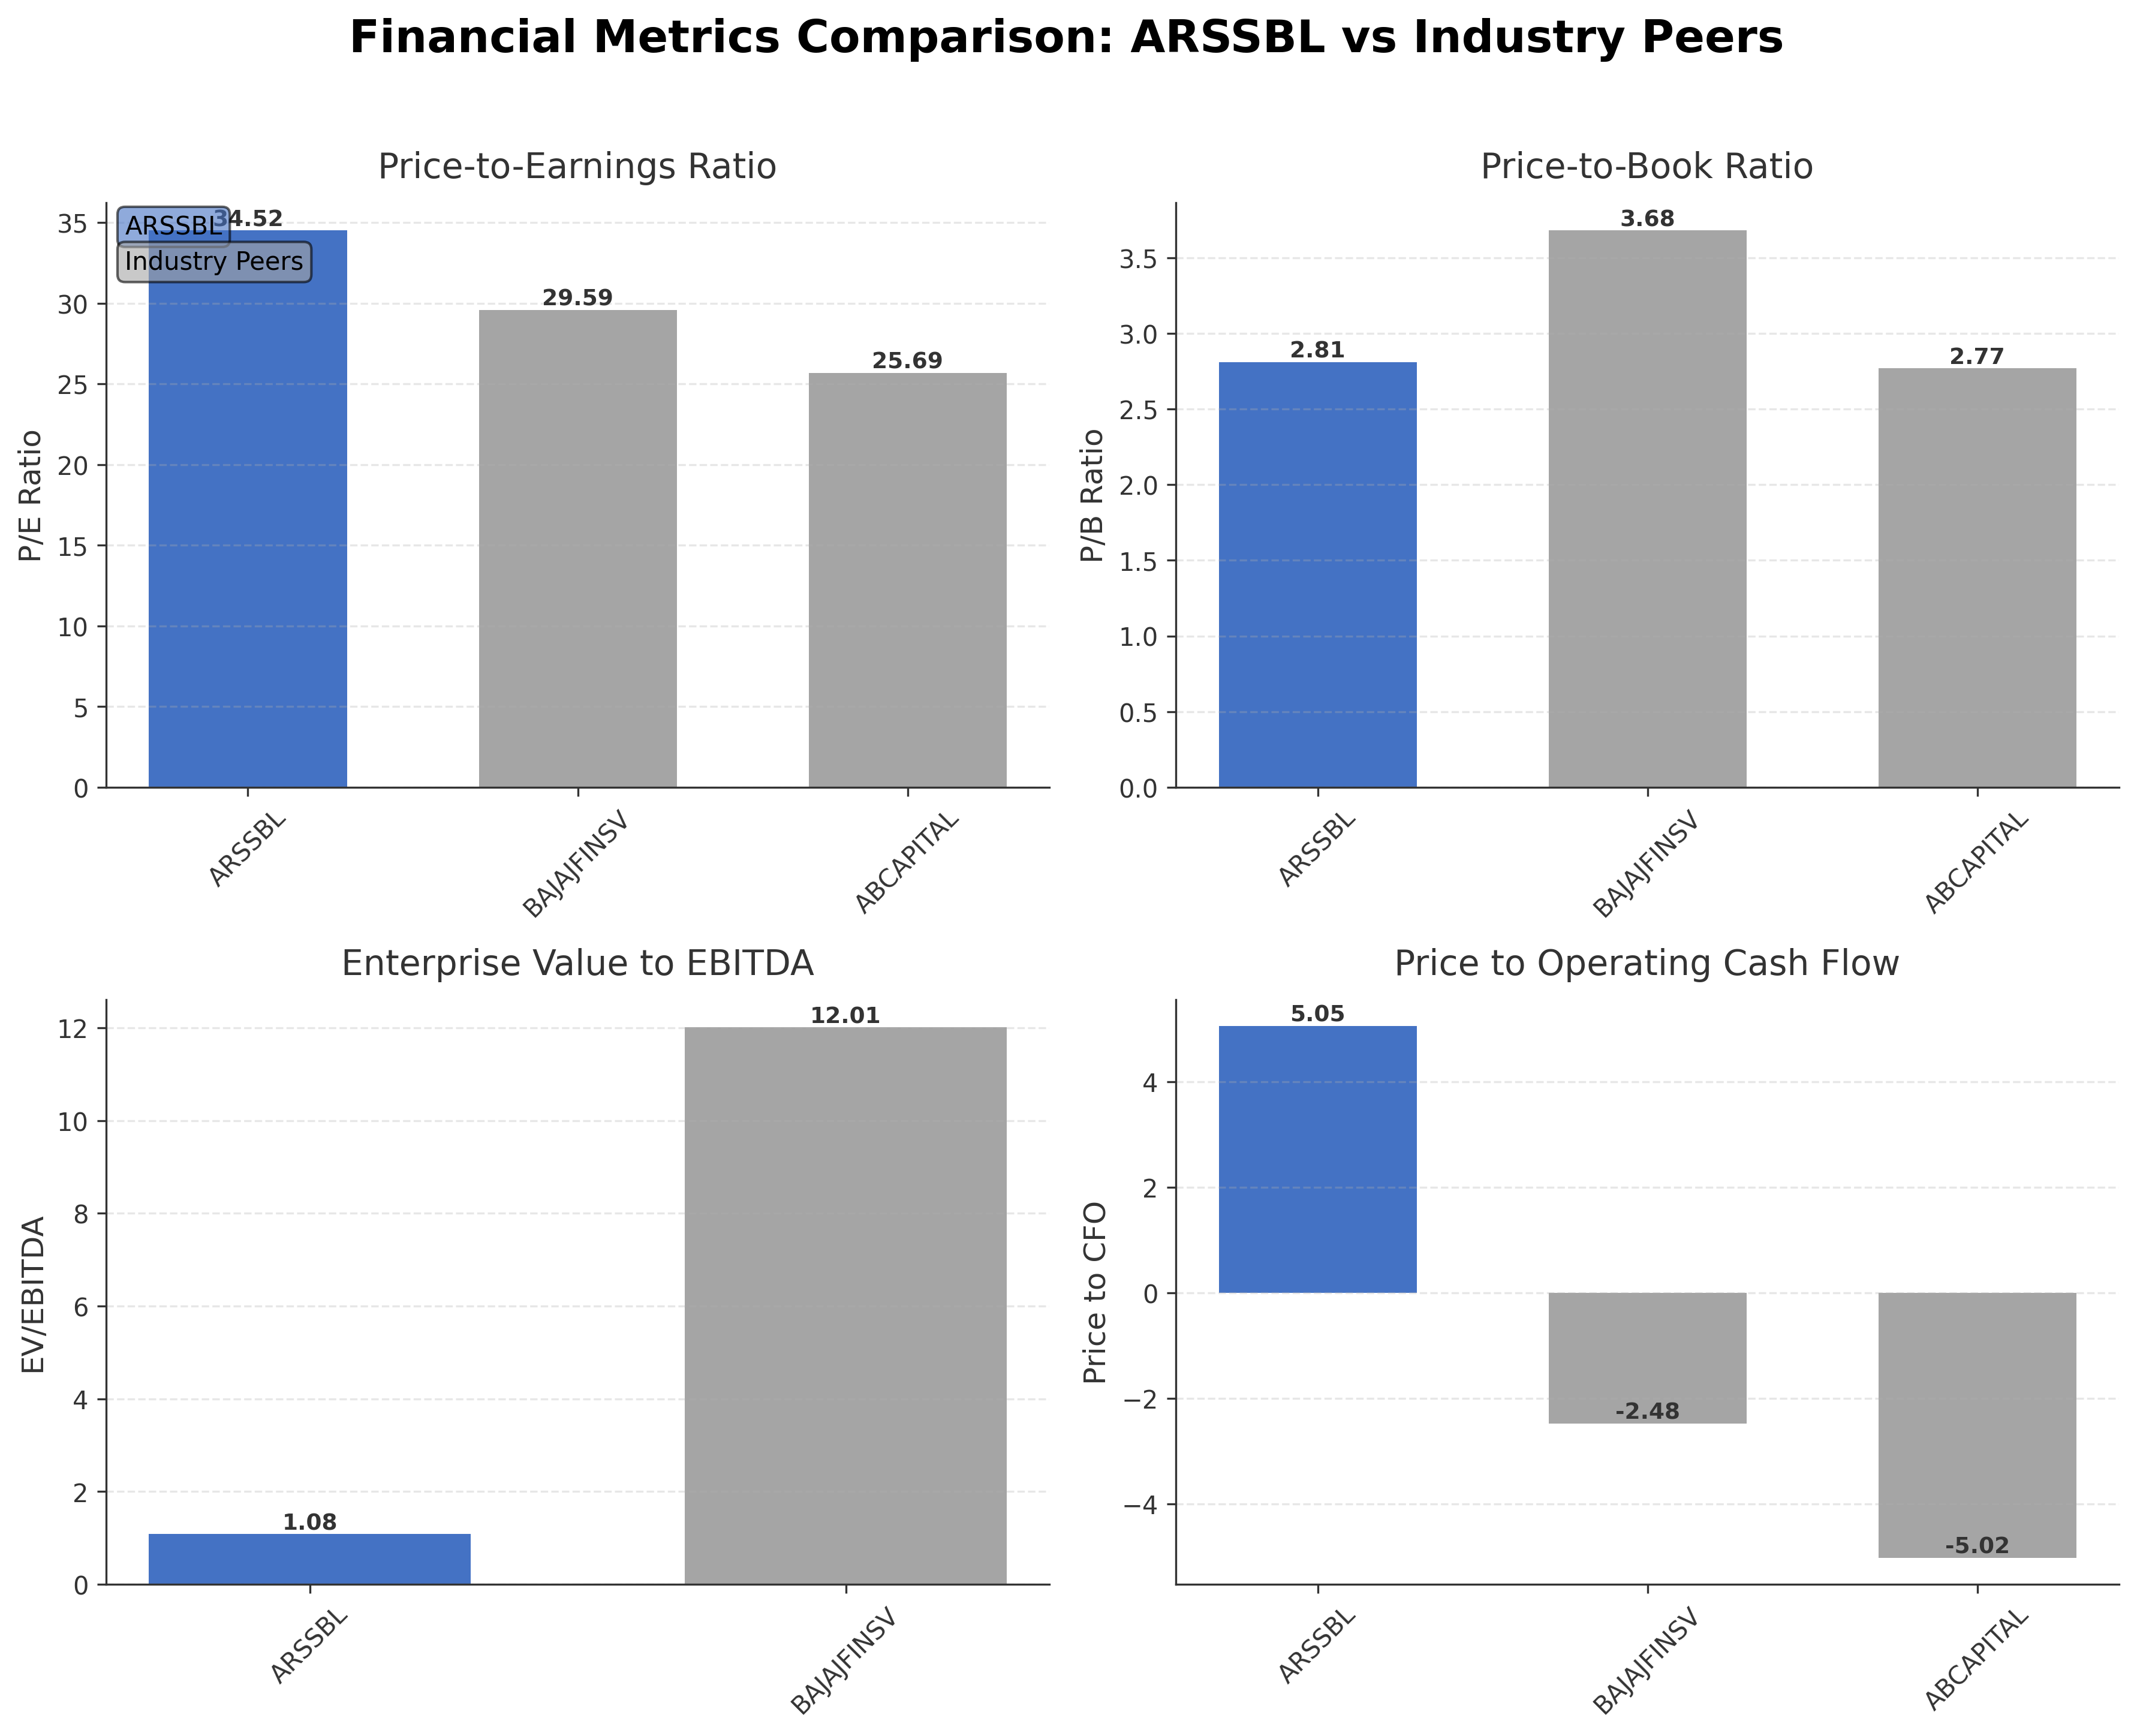
Peer Analysis
| Company Name | Market Cap | P/E Ratio | P/B Ratio | EV/EBITDA | Price to CFO |
|---|---|---|---|---|---|
| Anand Rathi Share and Stock Brokers Limited | ₹36.61B | 34.52 | 2.81 | 1.08 | 5.05 |
| Bajaj Finserv Ltd. | ₹2.83T | 29.59 | 3.68 | 12.01 | -2.48 |
| Aditya Birla Capital Ltd. | ₹892.55B | 25.69 | 2.77 | N/A | -5.02 |
| Piramal Enterprises Ltd. | ₹ 0.00 | N/A | N/A | N/A | N/A |
Comparison Analysis: Anand Rathi Share and Stock Brokers Limited exhibits a higher P/E ratio of 34.52 compared to peers Bajaj Finserv (29.59) and Aditya Birla Capital (25.69), indicating a relatively higher valuation multiple. Its P/B ratio of 2.81 is comparable to Aditya Birla Capital’s 2.77 but lower than Bajaj Finserv’s 3.68, suggesting moderate book value pricing. The EV/EBITDA ratio of 1.08 is significantly lower than Bajaj Finserv’s 12.01, reflecting a more attractive enterprise valuation relative to earnings. The company’s price to CFO ratio is positive at 5.05, contrasting with negative values for peers, indicating healthier cash flow metrics. Return on equity at 14% surpasses peers, highlighting stronger profitability. Overall, Anand Rathi demonstrates competitive financial and valuation metrics within its regional industry peer group.
Financial Metrics Comparison with Peers
Financial Statements
Comprehensive financial data including income, balance sheet, and cash flow metrics
Income Statement
| fiscal_date | 2026-03-31 | 2025-03-31 | 2024-03-31 | 2023-03-31 |
|---|---|---|---|---|
| Sales | 9.32B | 8.45B | 5.90B | 4.24B |
| Cost Of Goods | 4.02B | 4.01B | 3.42B | 2.66B |
| Gross Profit | 5.31B | 4.45B | 2.48B | 1.58B |
| Operating Expense Other Operating Expenses | 1.51B | 1.34B | 544.27M | 398.29M |
| Operating Income | 3.53B | 2.86B | 1.20B | 557.42M |
| Non Operating Interest Expense | 1.84B | 1.47B | 876.77M | 393.79M |
| Pretax Income | 1.72B | 1.40B | 1.15B | 509.91M |
| Income Tax | 423.01M | 367.72M | 381.09M | 132.46M |
| Net Income | 1.29B | 1.04B | 772.90M | 377.45M |
| Ebit | 3.56B | 2.87B | 2.03B | 903.70M |
| Ebitda | 3.82B | 3.13B | 2.24B | 1.05B |
| Net Income Continuous Operations | 1.72B | 1.40B | 1.15B | 509.91M |
| Preferred Stock Dividends | 0.00 | 0.00 | 0.00 | 0.00 |
| Operating Expense Selling General And Administrative | N/A | 329.03M | 274.31M | 245.17M |
| Non Operating Interest Income | N/A | 1.41B | 913.14M | 433.84M |
| Eps Basic | N/A | 16.52 | 12.32 | 6.02 |
| Eps Diluted | N/A | 16.52 | 12.32 | 6.02 |
| Basic Shares Outstanding | N/A | 62.73M | 62.73M | 62.73M |
| Diluted Shares Outstanding | N/A | 62.73M | 62.73M | 62.73M |
Source: Financial statements and regulatory filings
Balance Sheet
| fiscal_date | 2026-03-31 | 2025-03-31 | 2024-03-31 | 2023-03-31 |
|---|---|---|---|---|
| Cash And Cash Equivalents | 790.29M | 376.84M | 354.75M | 291.59M |
| Accounts Receivable | 3.14B | 2.53B | 2.47B | 2.04B |
| Total Assets | 70.99B | 33.65B | 25.85B | 16.29B |
| Total Liabilities | 57.51B | 28.61B | 21.92B | 13.64B |
| Long Term Debt | 8.31B | 809.65M | 2.34B | 1.25B |
| Shareholders Equity | 13.48B | 5.04B | 3.93B | 2.65B |
Source: Financial statements and regulatory filings
Cash Flow Statement
| fiscal_date | 2026-03-31 | 2025-03-31 | 2024-03-31 | 2023-03-31 |
|---|---|---|---|---|
| Operating Activities Net Income | 1.72B | 1.40B | 1.15B | 509.91M |
| Operating Activities Stock Based Compensation | 61.37M | 89.36M | 0.00 | 0.00 |
| Operating Activities Other Non Cash Items | -194.11M | -25.40M | -36.37M | -40.05M |
| Operating Activities Accounts Receivable | -4.94B | -755.59M | -2.85B | -1.34B |
| Operating Activities Other Assets Liabilities | -18.90B | -77.47M | 63.70M | 62.97M |
| Operating Activities Operating Cash Flow | -22.26B | 634.68M | -1.67B | -809.69M |
| Investing Activities Capital Expenditures | -165.17M | -388.20M | -353.66M | -109.98M |
| Investing Activities Net Intangibles | -29.87M | -40.82M | -26.20M | -19.33M |
| Investing Activities Purchase Of Investments | -12.99B | -6.66B | -6.40B | -1.68B |
| Investing Activities Investing Cash Flow | -13.16B | -7.05B | -6.68B | -1.79B |
| Financing Activities Common Stock Issuance | 7.45B | 0.00 | 500.00M | 0.00 |
| Financing Activities Financing Cash Flow | 7.45B | 263.22M | 5.06B | 1.47B |
| End Cash Position | 785.31M | 375.61M | 353.90M | 288.58M |
| Free Cash Flow | 7.05B | 6.49B | 1.49B | -57.37M |
| Financing Activities Long Term Debt Issuance | N/A | 1.35B | 4.56B | 1.47B |
| Financing Activities Long Term Debt Payments | N/A | -1.09B | N/A | N/A |
| Investing Activities Sale Of Investments | N/A | N/A | 65.67M | N/A |
Source: Financial statements and regulatory filings
Technical Analysis
Key Insights
- ARSSBL is currently in a consolidation phase with price fluctuating between the 50-day moving average (₹503.30) and 200-day moving average (₹560.27), indicating mixed short- to medium-term trend signals.
- Key support is observed near ₹500, while resistance levels are identified around ₹600 and the 52-week high of ₹794.85.
- The stock price is above the 50-day moving average but below the 200-day moving average, suggesting potential short-term strength but longer-term resistance.
- Momentum indicators show RSI near neutral levels, MACD indicates a recent bullish crossover, and Stochastic oscillators are moderately elevated, reflecting balanced momentum.
- Daily and weekly timeframes reveal sideways price action with no clear breakout, while monthly charts suggest a longer-term uptrend since listing.
- Potential scenarios include a breakout above ₹600 to test higher resistance or a retracement toward support near ₹500, contingent on broader market conditions.
Trending News
Summary: Anand Rathi Share Price: Find the latest news on Anand Rathi Stock Price. Get all the information on Anand Rathi with historic price charts for NSE / BSE. Experts & Broker view also get the Anand Rathi Ltd. buy/sell tips detailed news, announcements, Forecasts, Analysts, Valuation, Earning ...
Sentiment: neutral
Summary: Representing India in this global financial competition is Prof. Roop Bhootra, CEO of ANAND RATHI SHARE AND STOCK BROKERS LIMITED. With decades of experience
Sentiment: neutral
3. Headline: Buy City Union Bank; target of Rs 355 Anand Rathi- Moneycontrol.com
Summary: Anand Rathi is bullish on City Union Bank has recommended buy rating on the stock with a target price of Rs 355 in its research report dated April 28, 2026.
Sentiment: positive
4. Headline: SBI Cards Q4 Results Review: Anand Rathi Maintains Bullish Stance - Check Target Price, Potential Upside and More
Summary: With visible control on asset quality and credit cost, a gradual improvement in cards and spends can drive a re-rating, says Anand Rathi.
Sentiment: positive
5. Headline: Anand Rathi Wealth Unveils FY26 ESG Report, Details Sustainability Efforts | Whalesbook Corporate News
Summary: Anand Rathi Wealth has filed its FY26 Business Responsibility and Sustainability Report (BRSR), outlining its environmental, social, and governance (ESG) initiatives and compliance efforts. Discover what this means for investors.
Sentiment: neutral
Recent Updates
News Summary
As of 14 April 2026. Anand Rathi Share and Stock Brokers Limited reported a 28.1% year-on-year increase in revenue to ₹255.7 crore for the March quarter, with profit after tax more than doubling by 125.7% to ₹41.6 crore. The growth was driven by a 14.5% increase in broking-related revenues and a 34.3% rise in distribution income, offsetting a slight dip in broking revenues. The company declared a ₹5 final dividend, reflecting strong earnings and shareholder returns. Additionally, the firm reversed ₹12.15 crore worth of shares to a client following a fraud disclosure, complying with regulatory directions and limiting financial impact. These developments underscore the company’s focus on client relationships, regulatory adherence, and operational resilience amid evolving market conditions.
News Sentiment
The overall sentiment from recent updates is predominantly positive, driven by strong quarterly revenue and profit growth alongside dividend declarations that signal financial strength. The reversal of shares due to fraud disclosure introduces a neutral tone, reflecting operational challenges but limited financial impact. Positive earnings momentum and strategic dividend payouts contribute to investor confidence, while regulatory compliance actions demonstrate governance discipline. The balanced sentiment suggests a stable outlook with cautious attention to operational risks.
Source List
Analytical Overview
Analysis Summary
Anand Rathi Share and Stock Brokers Limited’s valuation metrics, including a trailing P/E of 34.52, align closely with the industry average, indicating fair valuation relative to peers. The absence of a forward P/E limits forward-looking valuation insights, but the EV/EBITDA ratio of 1.08 suggests an attractive enterprise valuation.
The company demonstrates a positive growth trajectory, with quarterly revenue growth of 28% and a 125.7% increase in quarterly earnings year-over-year, supported by healthy operating cash flow of ₹7.25 billion. Free cash flow generation of ₹1.29 billion further underscores operational efficiency.
Financial health is solid, with a total cash balance of ₹35.48 billion substantially exceeding total debt of ₹8.31 billion, resulting in a manageable debt-to-equity ratio of 61.64%. The current ratio of 1.04 indicates adequate liquidity to meet short-term obligations.
Sector-specific challenges include regulatory compliance risks and competitive pressures in India’s financial services industry, while opportunities arise from increasing market participation and digital platform expansion. India’s regulatory environment and evolving consumer trends favor firms with strong governance and innovation capabilities.
Overall Business and Market Assessment
Supporting Factors: strong revenue and earnings growth, robust cash flow generation, and a solid liquidity position
Risk Factors: regulatory compliance challenges and market competition that could impact margins
SWOT Analysis
Strengths
- Strong revenue growth of 28% year-over-year in the latest quarter.
- Robust cash position of ₹35.48 billion exceeding total debt of ₹8.31 billion.
- High return on equity at 13.96%, indicating efficient capital utilization.
- Comprehensive service offerings across multiple financial products and client segments.
Weaknesses
- Relatively high trailing P/E ratio of 34.52 compared to some peers.
- Limited insider ownership at approximately 0.015%, potentially impacting governance alignment.
- Current ratio near 1.04, indicating only marginal short-term liquidity buffer.
- Dependence on market conditions affecting brokerage and distribution income.
Opportunities
- Expansion of digital platforms to capture growing retail investor base.
- Increasing financial inclusion and market participation in India.
- Potential for strategic partnerships and product diversification.
- Rising demand for wealth management and advisory services.
Threats
- Regulatory compliance risks in a highly regulated financial sector.
- Intense competition from other brokerage and financial services firms.
- Market volatility impacting trading volumes and revenue streams.
- Operational risks including cybersecurity and fraud incidents.
Company Description
Anand Rathi Share and Stock Brokers Limited is a leading financial services provider in India, operating as the brokerage arm of the Anand Rathi Group. Established in 1994, the firm offers a broad spectrum of brokerage and investment services, including equity, derivatives, commodities, and currency trading, as well as margin trading and distribution of diverse financial products. Anand Rathi Share and Stock Brokers Limited caters to a wide client base—retail investors, high-net-worth individuals, and institutional clients—through a mix of physical branches and advanced digital platforms, ensuring accessibility across the country. As a wholly owned subsidiary of Anand Rathi Financial Services Limited, the company forms a strategic pillar within the group, complementing its private wealth and insurance businesses. The organization is renowned for its client-centric approach, robust research capabilities, and a commitment to ethical standards and innovation. With a seasoned leadership team and more than three decades of sector experience, Anand Rathi Share and Stock Brokers Limited plays a pivotal role in supporting the growth, diversification, and financial inclusion within India’s capital markets.