


American Electric Power Company, Inc (AEP)
Stock Analysis Report
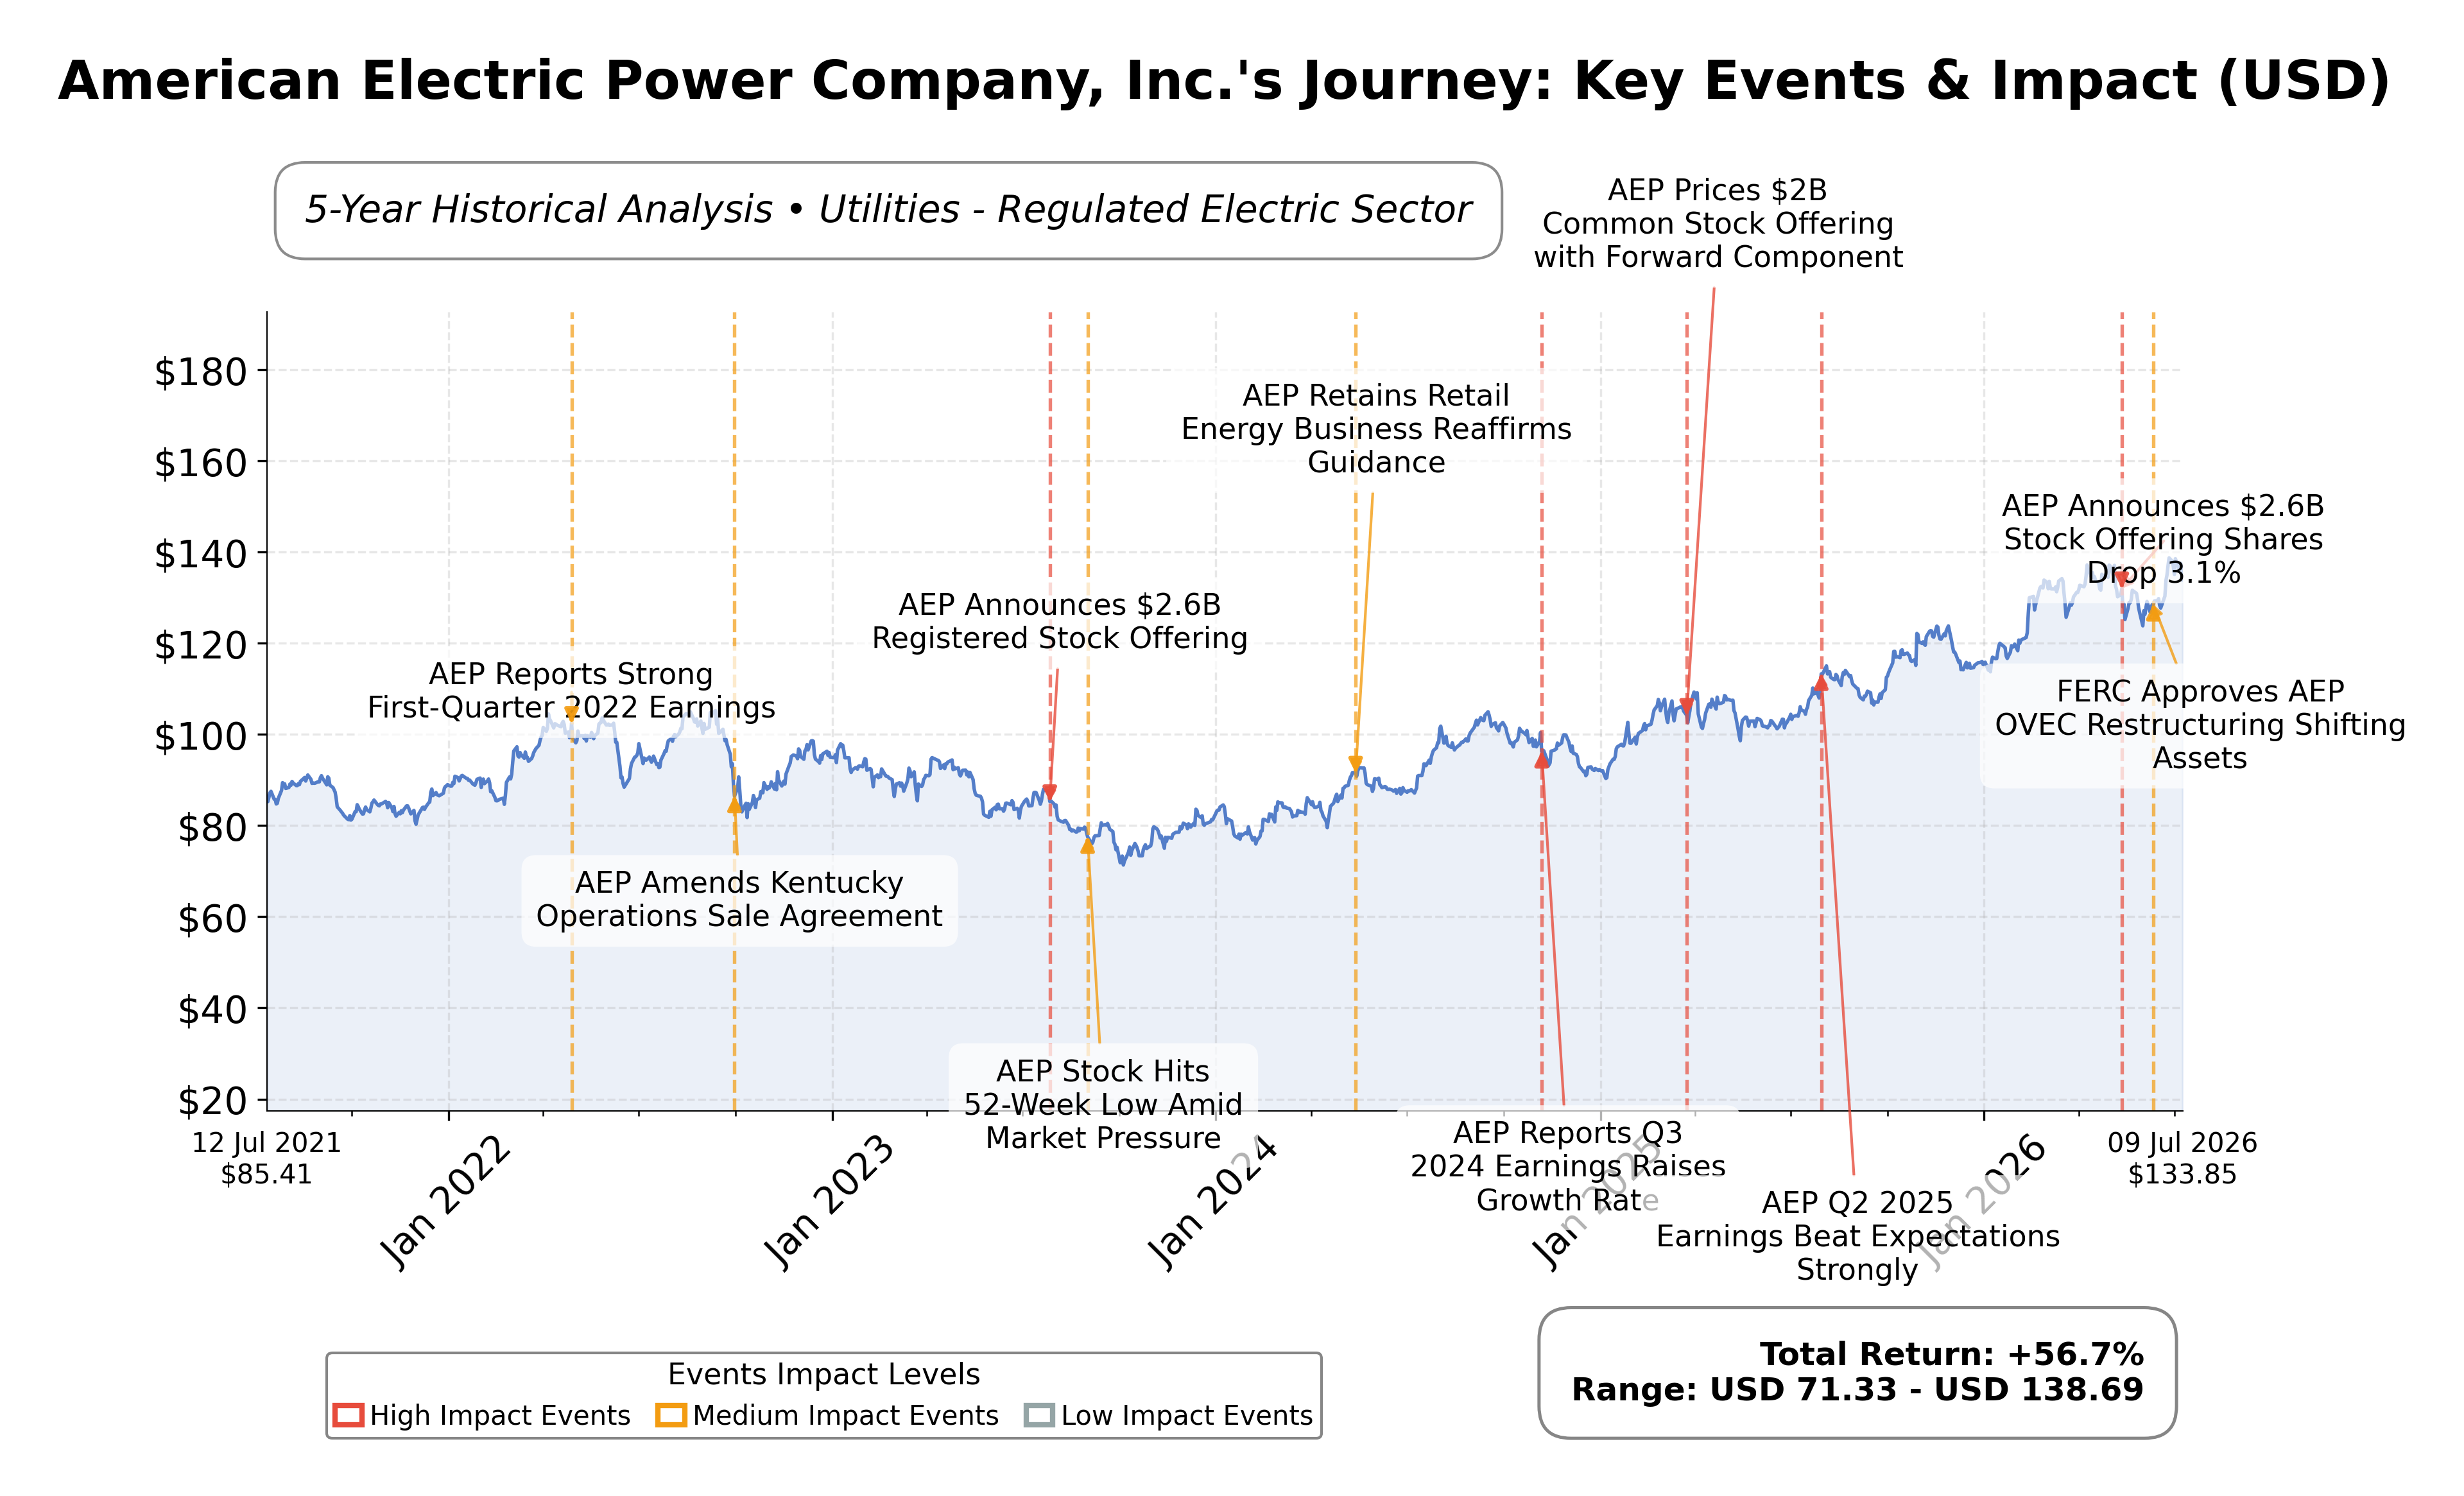
Stock Journey
Key Positives and Key Risks
Pros
- Return on equity of 12.58% indicates efficient use of shareholder capital and strong profitability.
- Quarterly revenue growth of 10.2% demonstrates robust demand and business expansion.
- Market capitalization of $75.36 billion with valuation metrics near industry averages suggests fair market pricing.
Cons
- High debt-to-equity ratio of 157.1% poses financial leverage risks and potential pressure on credit metrics.
- Negative free cash flow of approximately $6.95 billion TTM reflects heavy capital expenditure burden.
- Current ratio of 0.526 indicates limited short-term liquidity, which may affect operational flexibility.
Disclosure: This information is for general awareness and does not constitute investment advice
Report Summary
American Electric Power Company, Inc. (AEP) is a leading U.S.-based electric utility operating in the regulated electric utilities sector and listed on NASDAQ. The company engages in the generation, transmission, and distribution of electricity across multiple states, serving residential, commercial, industrial, and institutional customers. Its operations include managing a diverse portfolio of power generation assets and an extensive high-voltage transmission network, positioning it as a critical infrastructure provider within the Utilities sector. AEP’s business segments include regulated utility territories such as AEP Ohio and AEP Texas, emphasizing grid reliability and energy delivery.
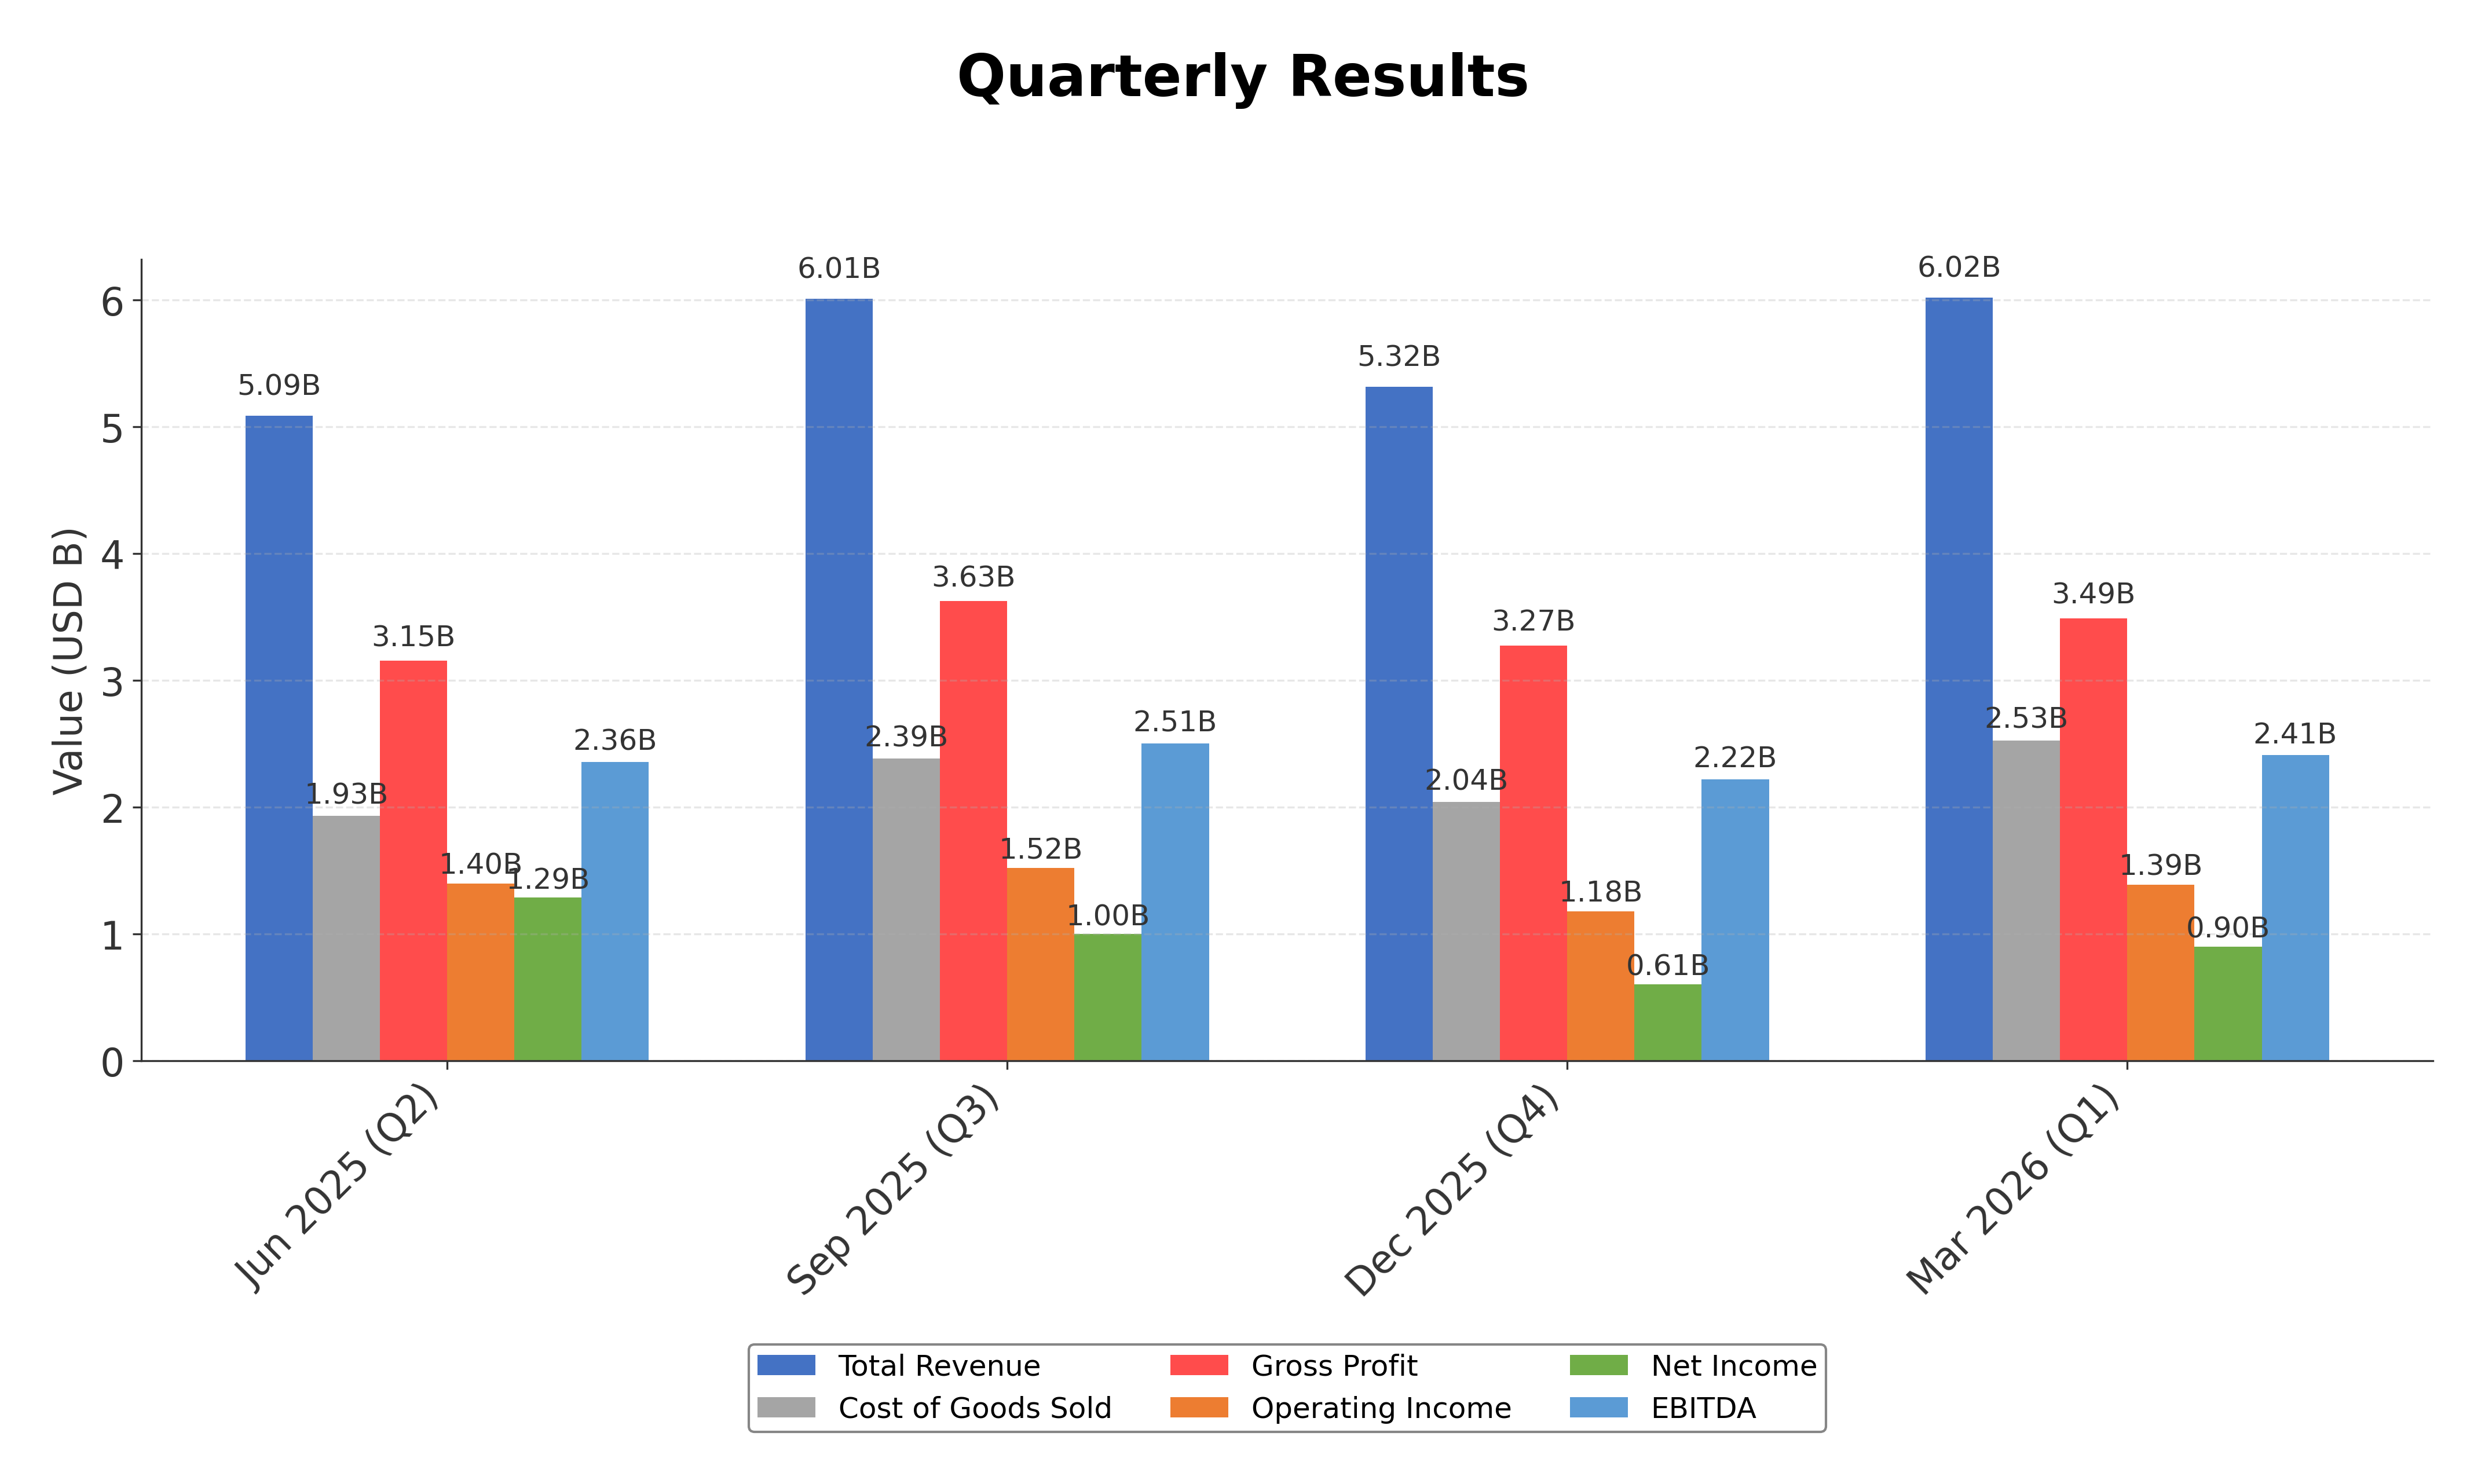
Financially, AEP reported trailing twelve months (TTM) revenue of approximately $22.43 billion with a gross margin of 57.99%, an operating margin of 23.74%, and a net profit margin of 16.29%. The company’s return on equity (ROE) stands at 12.58%, return on assets (ROA) at 3.17%, and return on invested capital (ROIC) is consistent with its operating efficiency. These metrics indicate solid profitability and operational effectiveness within the regulated utilities industry. Quarterly revenue growth is 10.2%, and earnings per share (EPS) diluted TTM is $6.76, reflecting steady growth.
Valuation metrics show a trailing price-to-earnings (P/E) ratio of 20.49 and a forward P/E of 20.19, with a price-to-book (P/B) ratio of 2.37 and an enterprise value to EBITDA (EV/EBITDA) multiple of 13.98. The market capitalization is approximately $75.36 billion. The stock trades near its 52-week high of $139.44, currently priced at $134.70, indicating it is close to its peak valuation range over the past year. These valuation multiples are broadly in line with industry averages, suggesting the stock is fairly valued relative to its fundamentals.
AEP’s strengths include strong cash flow generation with operating cash flow of $7.01 billion TTM, a leading market position in the regulated electric utilities sector, and a substantial capital investment plan totaling $78 billion through 2030. Key risks involve high debt levels with a total debt to equity ratio of 157.1%, potential regulatory challenges, and exposure to financing costs associated with its large capital expenditures. Recent strategic actions include a $274 million ESOP-related equity filing and signing 7 GW of new energy project agreements, reflecting ongoing growth initiatives.
Technically, the stock shows a stable uptrend with price levels near all-time highs and trading above its 50-day and 200-day moving averages. Momentum indicators such as RSI and MACD suggest moderate strength without overextension. Recent news highlights positive investor sentiment driven by earnings growth and capital investment announcements. Overall, the data suggests a market environment conducive to continued monitoring of the stock’s performance amid evolving sector dynamics and capital deployment.
Company and Industry Overview
Company Basics
Price Performance
Company Size
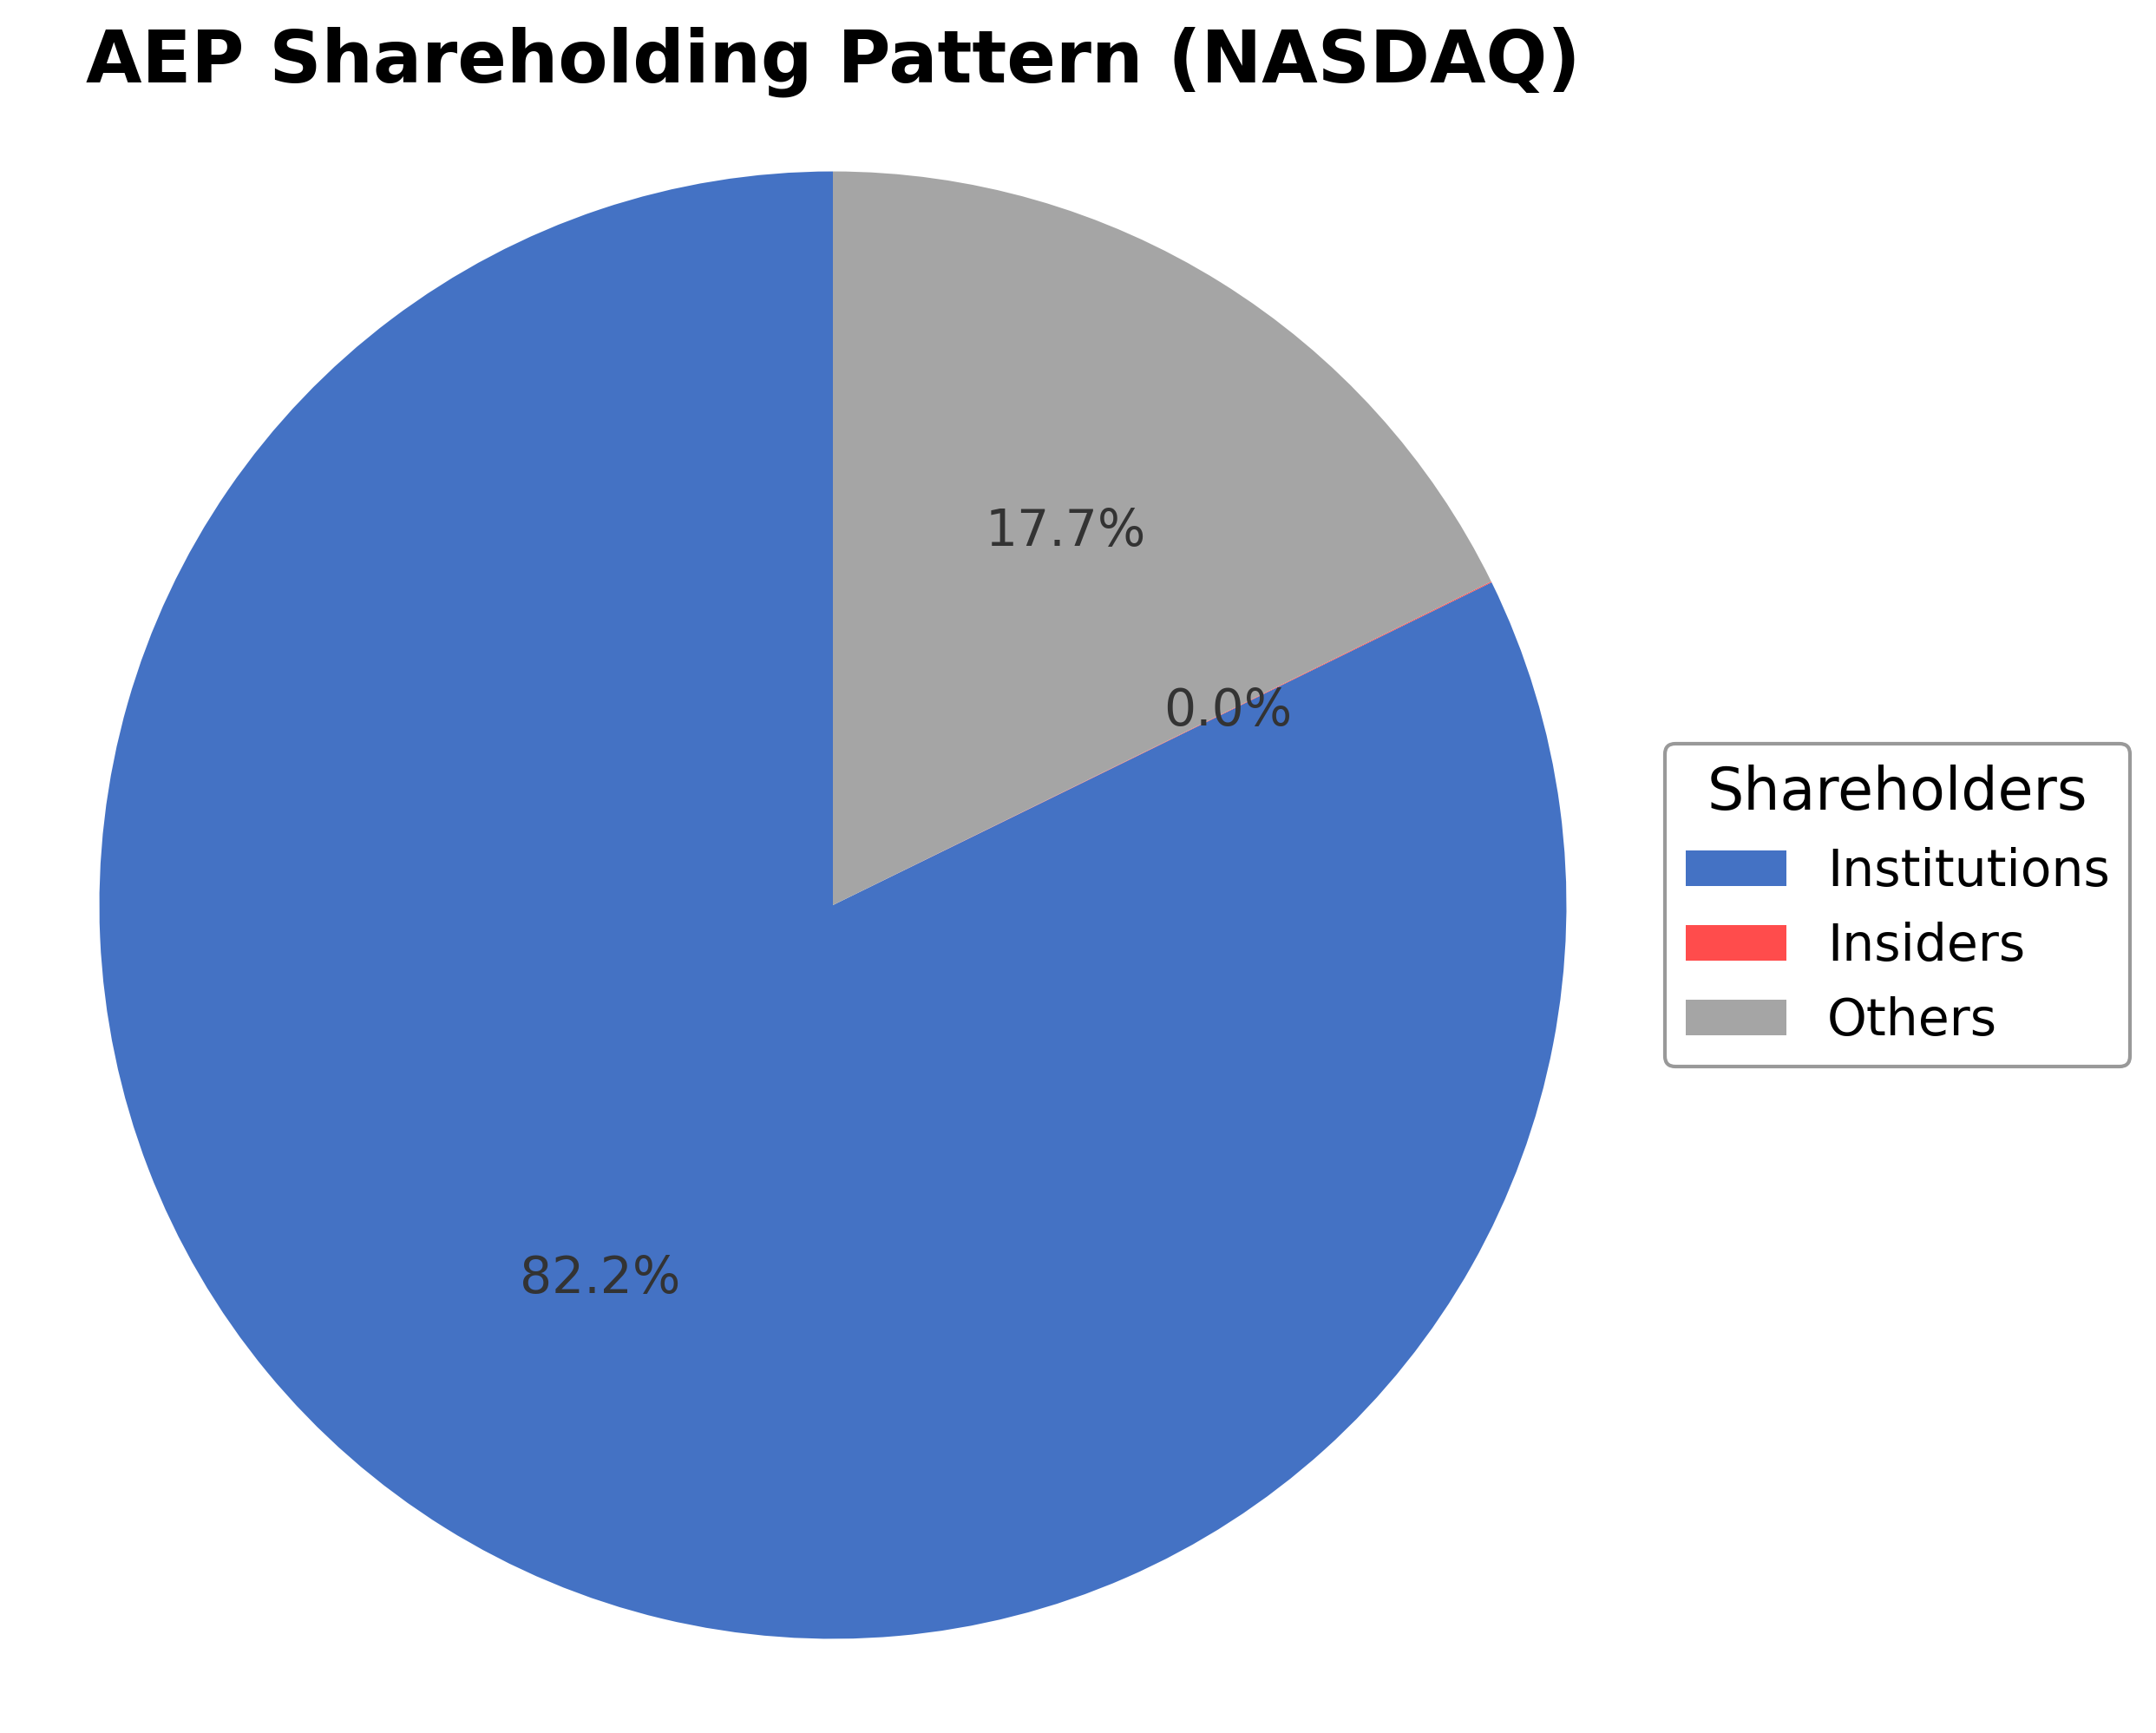
Shareholding Pattern
Sector and Industry Analysis
The utilities sector, encompassing electric, gas, and water services, represents a substantial portion of the U.S. economy with market capitalization in the hundreds of billions. It is characterized by steady growth driven by population expansion, urbanization, and increasing demand for reliable energy. Major players include regulated electric utilities such as American Electric Power, Duke Energy, and NextEra Energy, which serve millions of customers across multiple states.
Within the regulated electric utility industry, there is a notable shift toward modernization and sustainability, with companies investing heavily in grid infrastructure, renewable energy sources, and advanced technologies. Barriers to entry remain high due to capital intensity, regulatory requirements, and the need for extensive transmission networks. Competitive dynamics favor vertically integrated utilities with diversified generation portfolios and strong regulatory relationships, enabling them to capitalize on growing commercial and industrial electricity demand.
The regulatory environment for utilities is complex and evolving, with state and federal agencies imposing standards on rates, emissions, and reliability. Policies promoting clean energy and grid resilience are driving significant capital investments, while rate cases and return on equity determinations impact financial performance. Utilities like AEP benefit from regulatory frameworks that allow recovery of infrastructure investments and support earnings growth, although they must navigate ongoing scrutiny related to environmental compliance and customer affordability.
Note: Analysis synthesized from industry research, market reports, and regulatory filings. Information is subject to change based on market conditions.
Financial Ratios Dashboard
Illustrative Scenario Analysis
DCF Assumptions:
Method: Two-Stage EPS-Priority Model
Financials
Peer Analysis
| Company Name | Market Cap | P/E Ratio | P/B Ratio | EV/EBITDA | Price to CFO |
|---|---|---|---|---|---|
| American Electric Power Company, Inc. | $75.36B | 20.49 | 2.37 | 13.98 | 10.75 |
| Dominion Energy, Inc. | $61.35B | 20.58 | 2.18 | 14.41 | 12.12 |
| The Southern Company | $110.45B | 25.06 | 2.98 | 13.47 | 11.30 |
| NextEra Energy, Inc. | $184.24B | 22.42 | 3.34 | 21.05 | 14.94 |
| Duke Energy Corporation | $101.04B | 19.91 | 1.89 | 11.72 | 8.66 |
| National Grid plc Sponsored ADR | $82.45B | 19.18 | 9.56 | 76.83 | 7.88 |
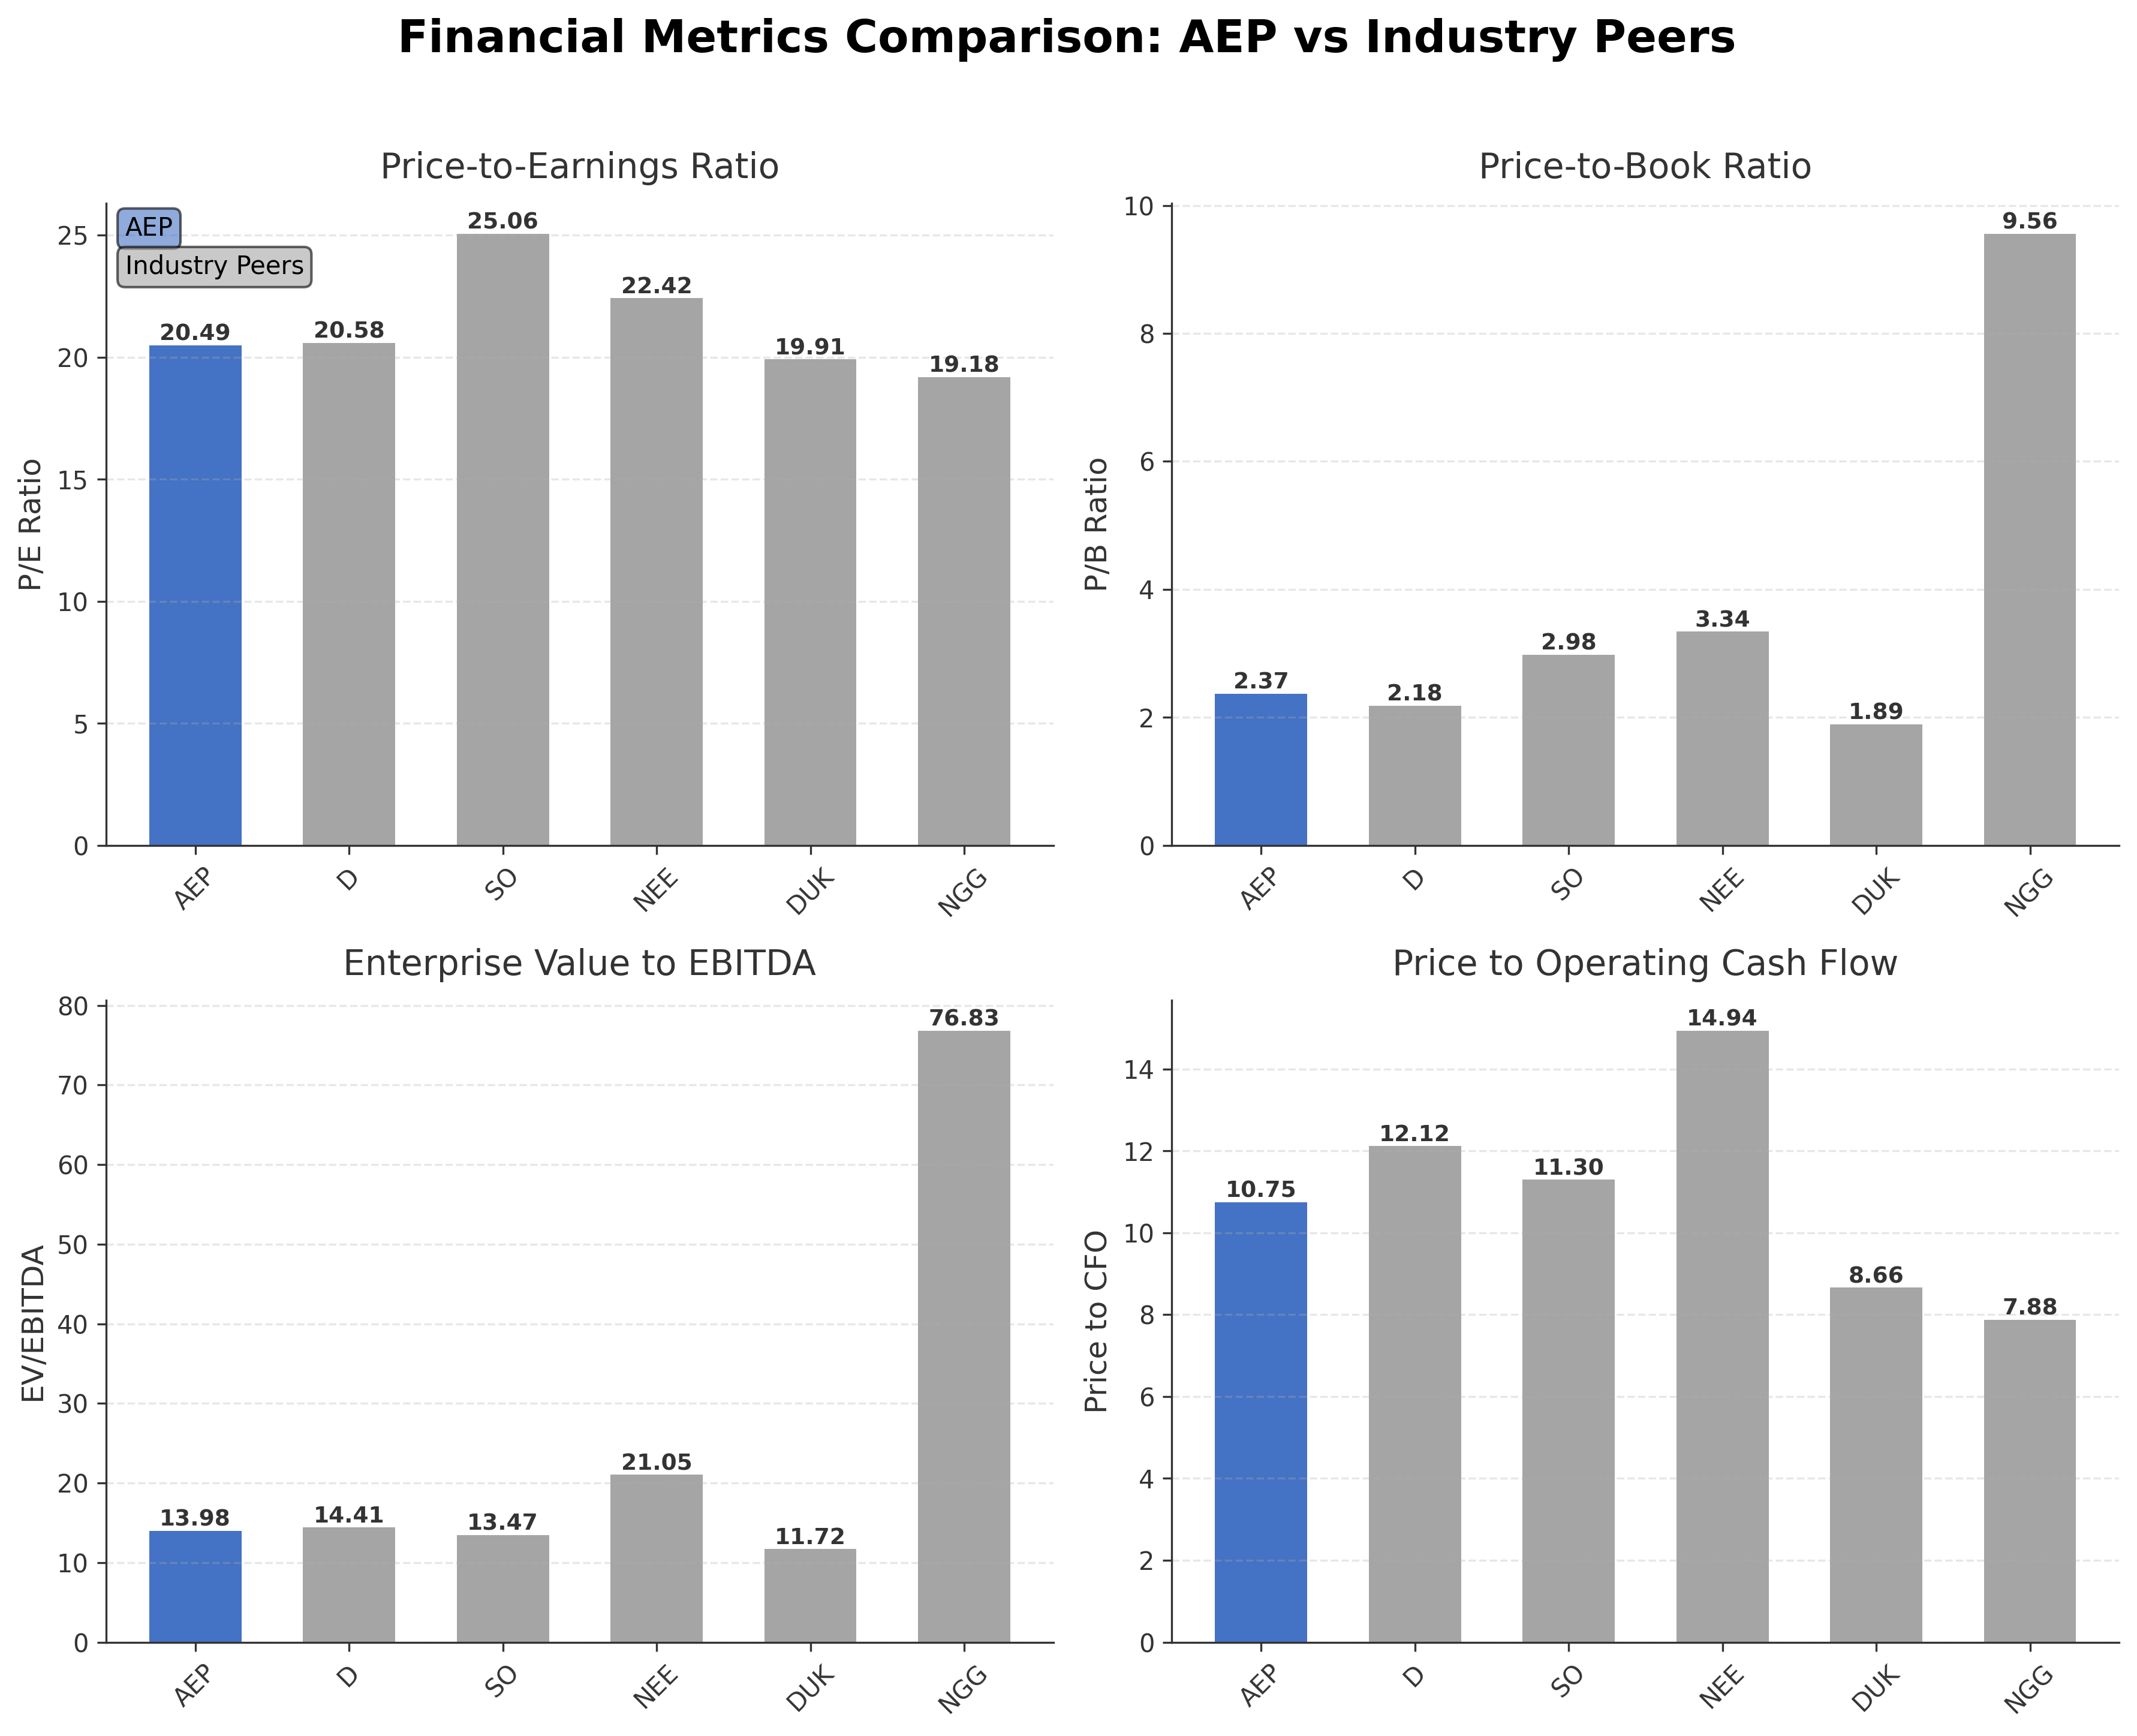
Comparison Analysis: American Electric Power Company, Inc. maintains a competitive position among its regional utility peers with a market capitalization of $75.36 billion, placing it in the mid-range relative to larger peers like NextEra Energy ($184.24 billion) and Southern Company ($110.45 billion). Its P/E ratio of 20.49 is slightly below Southern Company’s 25.06 and NextEra Energy’s 22.42, indicating relatively more moderate valuation. The P/B ratio of 2.37 is higher than Duke Energy’s 1.89 but lower than NextEra’s 3.34 and National Grid’s 9.56, reflecting balanced asset valuation. AEP’s EV/EBITDA multiple of 13.98 is in line with industry peers, though lower than NextEra’s premium multiple of 21.05. Its return on equity of 12.58% is the highest among the peer group, suggesting superior profitability and capital efficiency. Overall, AEP demonstrates solid financial metrics and valuation positioning within the regulated utilities sector.
Financial Metrics Comparison with Peers
Financial Statements
Comprehensive financial data including income, balance sheet, and cash flow metrics
Income Statement
| fiscal_date | 2025-12-31 | 2024-12-31 | 2023-12-31 | 2022-12-31 | 2021-12-31 |
|---|---|---|---|---|---|
| Sales | 21.88B | 19.72B | 18.98B | 19.64B | 16.79B |
| Cost Of Goods | 8.53B | 7.26B | 7.85B | 8.35B | 6.59B |
| Gross Profit | 13.35B | 12.46B | 11.13B | 11.29B | 10.20B |
| Operating Expense Other Operating Expenses | 2.95B | 3.13B | 2.81B | 2.84B | 2.55B |
| Operating Income | 5.38B | 4.45B | 3.73B | 3.78B | 3.42B |
| Non Operating Interest Expense | 2.03B | 1.86B | 1.81B | 1.40B | 1.20B |
| Other Income Expense | 365.00M | 259.60M | 281.10M | 38.00M | 288.10M |
| Pretax Income | 3.72B | 2.84B | 2.21B | 2.42B | 2.51B |
| Income Tax | 129.00M | -39.20M | 54.60M | 5.40M | 115.50M |
| Net Income | 3.70B | 2.98B | 2.21B | 2.31B | 2.49B |
| Eps Basic | 6.70 | 5.60 | 4.26 | 4.51 | 4.97 |
| Eps Diluted | 6.66 | 5.58 | 4.24 | 4.49 | 4.96 |
| Basic Shares Outstanding | 534.54M | 530.09M | 518.90M | 511.84M | 500.52M |
| Diluted Shares Outstanding | 534.54M | 530.09M | 518.90M | 511.84M | 500.52M |
| Ebit | 5.75B | 4.71B | 4.02B | 3.82B | 3.71B |
| Ebitda | 9.30B | 8.03B | 7.21B | 7.26B | 6.63B |
| Net Income Continuous Operations | 3.70B | 2.98B | 2.21B | 2.31B | 2.49B |
| Minority Interests | -116.00M | -8.70M | -4.50M | 1.60M | 0.00 |
Data provided by Twelve Data
Balance Sheet
| fiscal_date | 2025-12-31 | 2024-12-31 | 2023-12-31 | 2022-12-31 | 2021-12-31 |
|---|---|---|---|---|---|
| Cash And Cash Equivalents | 197.00M | 202.90M | 330.10M | 509.40M | 403.40M |
| Accounts Receivable | 1.17B | 1.10B | 1.03B | 1.15B | 720.90M |
| Total Assets | 114.46B | 103.08B | 96.68B | 93.40B | 87.67B |
| Total Liabilities | 82.24B | 76.09B | 71.40B | 69.28B | 64.99B |
| Long Term Debt | 44.71B | 39.81B | 38.17B | 34.87B | 31.79B |
| Shareholders Equity | 32.22B | 26.99B | 25.29B | 24.12B | 22.68B |
Data provided by Twelve Data
Cash Flow Statement
| fiscal_date | 2025-12-31 | 2024-12-31 | 2023-12-31 | 2022-12-31 | 2021-12-31 |
|---|---|---|---|---|---|
| Operating Activities Net Income | 3.70B | 2.98B | 2.21B | 2.31B | 2.49B |
| Operating Activities Depreciation | 3.49B | 3.39B | 3.19B | 3.29B | 3.05B |
| Operating Activities Deferred Taxes | 269.00M | 12.90M | 144.00M | -178.40M | 39.60M |
| Operating Activities Other Non Cash Items | -801.00M | -149.60M | 58.70M | -386.50M | -2.09B |
| Operating Activities Accounts Receivable | -246.00M | -156.00M | 236.50M | -681.70M | -119.70M |
| Operating Activities Accounts Payable | 252.00M | 85.10M | -253.20M | 489.20M | 200.60M |
| Operating Activities Other Assets Liabilities | 303.00M | 341.00M | -709.30M | -150.60M | -63.30M |
| Operating Activities Operating Cash Flow | 6.96B | 6.50B | 4.88B | 4.68B | 3.50B |
| Investing Activities Capital Expenditures | -130.00M | -139.90M | -128.20M | -100.70M | -104.50M |
| Investing Activities Net Acquisitions | -3.45B | -285.50M | -155.20M | -1.21B | -767.20M |
| Investing Activities Purchase Of Investments | -2.98B | -2.92B | -2.86B | -2.78B | -1.96B |
| Investing Activities Sale Of Investments | 2.94B | 2.88B | 2.80B | 2.74B | 1.90B |
| Investing Activities Other Investing Activity | 143.00M | 504.10M | 1.46B | 268.30M | 151.10M |
| Investing Activities Investing Cash Flow | -3.49B | 34.20M | 1.11B | -1.08B | -774.30M |
| Financing Activities Long Term Debt Issuance | 8.26B | 5.12B | 5.46B | 4.65B | 6.49B |
| Financing Activities Long Term Debt Payments | -5.04B | -3.78B | -4.62B | -3.64B | -4.31B |
| Financing Activities Short Term Debt Issuance | -1.02B | -306.40M | -1.28B | 1.50B | 134.70M |
| Financing Activities Common Stock Issuance | 775.00M | 552.10M | 999.60M | 826.50M | 600.50M |
| Financing Activities Common Dividends | -2.01B | -1.90B | -1.76B | -1.65B | -1.52B |
| Financing Activities Other Financing Charges | 2.71B | -49.80M | -78.60M | -105.40M | -41.60M |
| Financing Activities Financing Cash Flow | 3.68B | -371.00M | -1.27B | 1.58B | 1.35B |
| End Cash Position | 268.00M | 246.00M | 379.00M | 556.50M | 451.40M |
| Free Cash Flow | -1.64B | -966.30M | -2.49B | -1.48B | -1.92B |
Data provided by Twelve Data
Technical Analysis
Key Insights
- Price action indicates a sustained uptrend with the stock trading near its 52-week high of $139.44, reflecting positive momentum over recent months.
- Key support levels are identified near $130 and $120, while resistance is observed close to the 52-week high at $139.44.
- The stock is currently trading above its 10-day, 50-day ($131.31), and 200-day ($124.12) moving averages, indicating bullish medium- and long-term trends.
- Momentum indicators show RSI in a moderate range around 60-65, MACD remains positive but not overextended, and Stochastic oscillators suggest no immediate overbought conditions.
- Analysis across daily, weekly, and monthly timeframes confirms a consistent upward trend with no significant reversal signals at present.
- Potential scenarios include continuation of the uptrend supported by strong fundamentals and technicals or a consolidation phase near resistance levels before further directional moves.
Trending News
1. Headline: Quantum Portfolio Management LLC Makes New Investment in American Electric Power Company, Inc. $AEP - Stock Observer
Summary: Why Exxon Could Be the Market’s Next Big Comeback Stock · The Market Just Got Shaken—These 3 ETFs May Come Out Stronger · Meta Platforms’ Cloud Push: Growth Opportunity Versus AI Concerns · Want to see what other hedge funds are holding AEP? Visit HoldingsChannel.com to get the latest 13F filings and insider trades for American Electric Power Company, Inc. (NASDAQ:AEP – Free Report). Receive News ...
Sentiment: positive
2. Headline: Why Is Bloom Energy Stock Sinking Wednesday? - Bloom Energy (NYSE:BE) - Benzinga
Summary: Stocks slid and Brent reclaimed $80 after Trump declared the Iran ceasefire "over," lifting rate-hike fears and hammering gold, chips and consumer names. ... Additionally, key projects driving the company’s $20 billion backlog, including Oracle Corp.’s (NYSE:ORCL) Project Jupiter in New Mexico and an American Electric Power ...
Sentiment: positive
3. Headline: American Electric Power outlines long-term grid investment. The utility leans on regulated earnings
Summary: More on American Electric Power stockInvestor Relations · American Electric Power's generation fleet includes legacy fossil-fuel plants alongside newer natural gas and renewable facilities. Over time, the company has been reducing the share of coal in its mix, retiring older units or converting ...
Sentiment: neutral
4. Headline: American Electric Power Company stock hits all-time high at 139.5 USD By Investing.com
Summary: Citi says SpaceX stock has path to $900+ valuation. Here’s how ... American Electric Power Company Inc. (AEP) stock has reached an all-time high, touching 139.51 USD. The $75.85 billion utility company now trades within 1% of its 52-week high of 139.44 USD.
Sentiment: positive
5. Headline: American Electric Power’s Quarterly Earnings Preview: What You Need to Know
Summary: Moreover, its operating EPS is projected to increase over 8% year-over- year to $6.86 in fiscal 2027. ... AEP stock has soared 34.1% over the past 52 weeks, surpassing both the S&P 500 Index's ($SPX) 19.2% return and the State Street Utilities Select Sector SPDR ETF's (XLU) 12.7% gain over the same period. ... Shares of American Electric Power rose 1.8% on May 5 after the company ...
Sentiment: positive
Powered by Brave
Recent Updates
News Summary
As of July 9, 2026. American Electric Power has outlined a comprehensive long-term grid investment plan focused on expanding transmission infrastructure and integrating new natural gas and renewable energy projects to meet increasing electricity demand. The company’s Q2 2026 earnings preview anticipates operating EPS growth to $1.48, up 3.5% year-over-year, supported by a robust capital investment plan raised to $78 billion through 2030. Additionally, AEP filed a $274 million shelf registration for 2 million common shares tied to an ESOP, reflecting ongoing capital allocation efforts amid significant infrastructure expansion. These developments underscore AEP’s strategic focus on modernizing its energy delivery systems and capitalizing on rising demand, particularly from data centers. The company’s projected revenue and earnings growth through 2029 further reinforce its growth narrative within the regulated utilities sector.
News Sentiment
The overall sentiment from recent updates is cautiously optimistic, driven by positive earnings expectations, increased capital expenditure plans, and strategic equity filings. Institutional investment interest and strong contracted load growth support a constructive view of AEP’s operational and financial trajectory. Neutral tones arise from the modest scale of the ESOP-related equity offering and the inherent risks associated with large capital needs and financing costs. This balanced sentiment reflects confidence in AEP’s growth strategy tempered by awareness of execution and funding challenges.
Source List
- https://finance.yahoo.com/markets/stocks/articles/aep-esop-linked-share-filing-110749234.html
- https://simplywall.st/stocks/us/utilities/nasdaq-aep/american-electric-power/news/is-american-electric-power-company-aep-undervalued-as-7-gw-d
Analytical Overview
Analysis Summary
American Electric Power’s valuation metrics, including a trailing P/E of 20.49 and forward P/E of 20.19, align closely with industry averages, indicating a fairly valued stock relative to its utility peers. The PEG ratio of 2.79 suggests moderate growth expectations priced into the stock. Revenue growth of 10.2% quarterly and positive earnings growth trends demonstrate a solid growth trajectory supported by increasing electricity demand and capital investments.
The company’s financial health shows a high debt-to-equity ratio of 157.1%, reflecting significant leverage associated with its capital-intensive business model. Operating cash flow of $7.01 billion TTM supports ongoing investments, though free cash flow remains negative, indicating substantial capital expenditures. Sector-specific challenges include regulatory scrutiny and financing costs, while opportunities arise from rising data center demand and infrastructure modernization.
Considering market positioning, AEP benefits from a strong regulated utility footprint and institutional investor confidence, which support its long-term capital plans. The company’s strategic focus on transmission upgrades and renewable integration aligns with broader energy transition trends, enhancing its competitive advantages in the U.S. utilities sector.
Overall Business and Market Assessment
Supporting Factors: steady revenue and earnings growth driven by rising electricity demand, a robust capital investment plan totaling $78 billion through 2030, and strong institutional ownership underpinning governance and strategic execution
Risk Factors: the high leverage and associated financing costs, regulatory uncertainties, and the execution risks of large-scale infrastructure projects
SWOT Analysis
Strengths
- Strong market position as a leading regulated electric utility in the United States.
- Robust revenue growth of 10.2% quarterly supported by rising electricity demand.
- High return on equity of 12.58% indicating efficient capital utilization.
- Extensive capital investment plan of $78 billion through 2030 for infrastructure modernization.
Weaknesses
- High debt-to-equity ratio of 157.1% reflecting significant financial leverage.
- Negative free cash flow of approximately $6.95 billion TTM due to heavy capital expenditures.
- Low current ratio of 0.526 indicating limited short-term liquidity.
- Minimal insider ownership at 0.023%, potentially limiting direct executive alignment with shareholders.
Opportunities
- Increasing electricity demand driven by data center growth and urbanization.
- Expansion of transmission infrastructure and integration of renewable energy sources.
- Potential for operational efficiencies through modernization and technology adoption.
- Growing institutional investor interest supporting capital allocation and governance.
Threats
- Regulatory risks related to utility rate approvals and environmental policies.
- Rising financing costs due to large capital expenditure requirements.
- Competitive pressures from alternative energy providers and technological disruptions.
- Macroeconomic factors impacting energy demand and capital market conditions.
Company Description
American Electric Power Company, Inc. is a U.S.-based electric utility company that generates, transmits, and distributes electricity to residential, commercial, industrial, and institutional customers across multiple states. The company operates a diverse portfolio of power generation assets and manages an extensive high-voltage transmission network, positioning it as a key player in maintaining grid reliability and supporting regional power markets. American Electric Power Company, Inc. serves regulated utility territories through local operating companies such as AEP Ohio and AEP Texas, providing essential services like energy delivery, billing, outage response, and customer support. Its operations span urban, suburban, and rural areas, supplying power to households, businesses, manufacturers, and public infrastructure. Headquartered in Columbus, Ohio, and founded in 1906, the company plays a central role in the U.S. electric power sector by linking generation resources with end users through its transmission and distribution systems, and by coordinating with regional grid operators and other utilities to support the stability and efficiency of the broader energy ecosystem.