

ALL E TECHNOLOGIES (ALLETEC.SM)
Stock Analysis Report
Stock Journey
Key Positives and Key Risks
Pros
- Strong profitability metrics with ROCE at 22.2% and ROE at 17.1%, indicating efficient capital utilization.
- Low debt levels supporting financial stability and reducing leverage risk.
- Consistent profit growth at a 25.3% CAGR over the last five years, demonstrating growth momentum.
Cons
- Significant portion of earnings includes other income of ₹10.3 crore, which may distort core profitability.
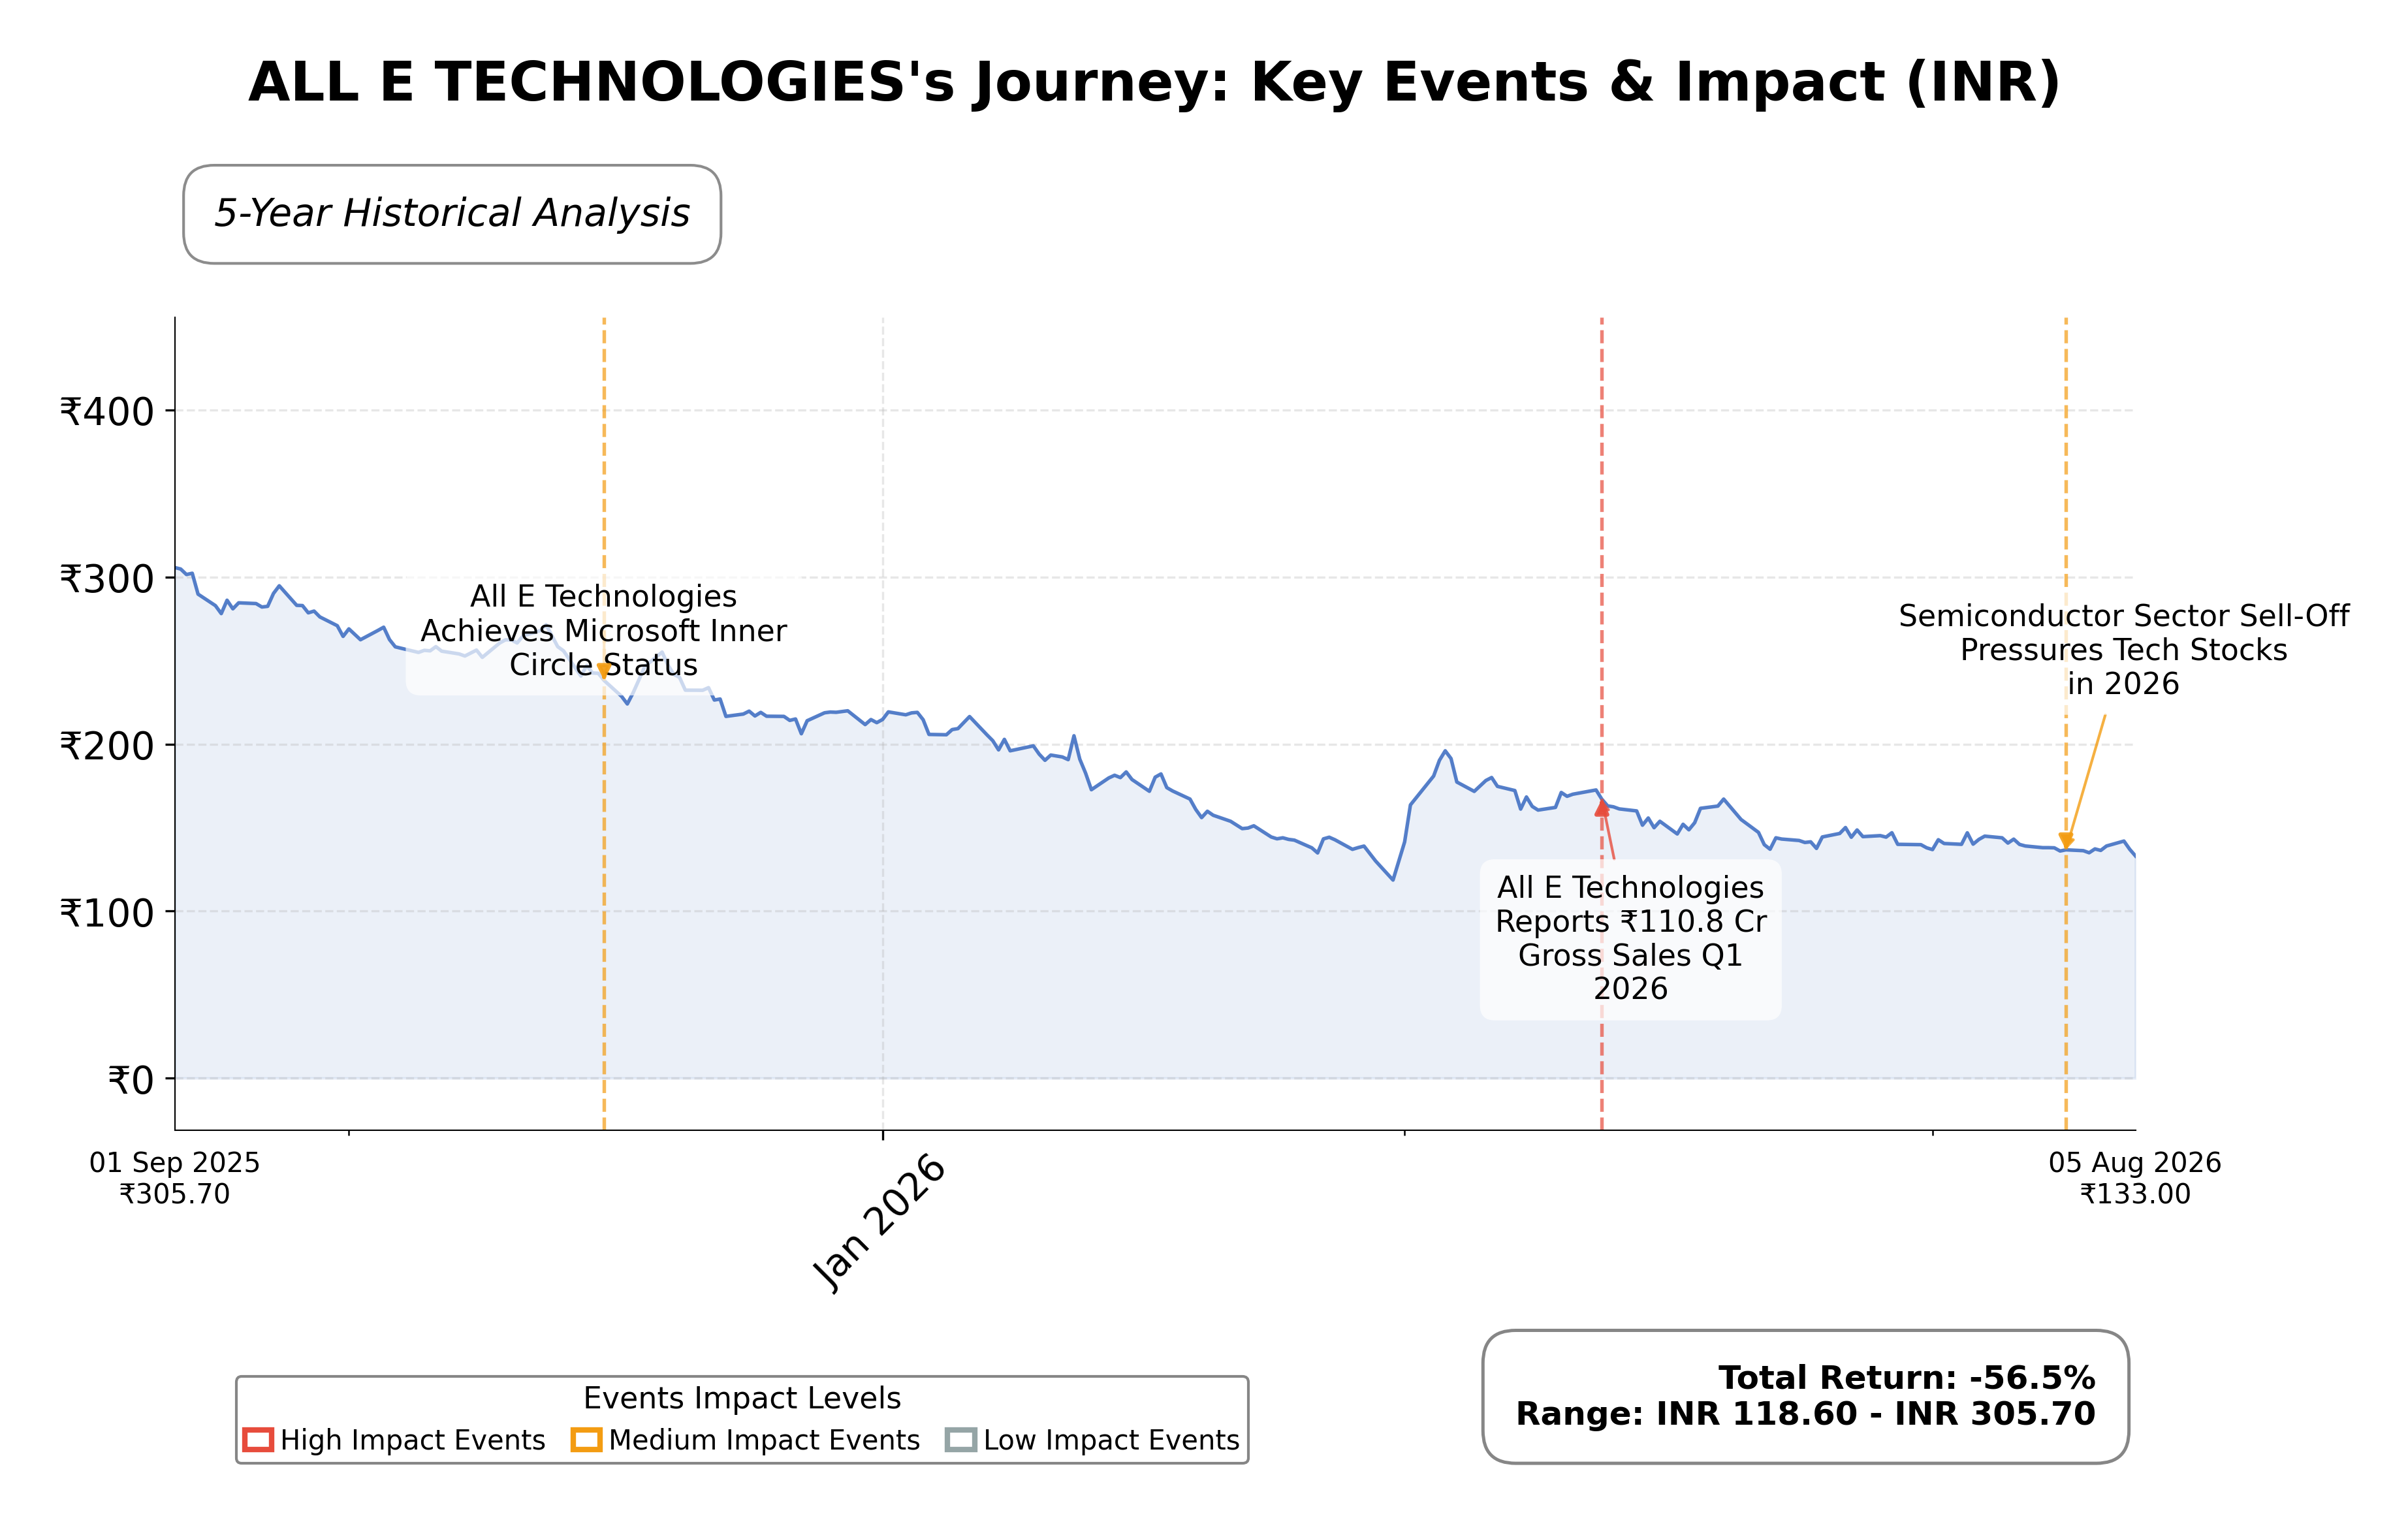
- Stock price has declined substantially from a 52-week high of ₹309.9 to current levels near ₹134, reflecting market volatility.
- Limited availability of detailed financial data and shareholding information restricts comprehensive analysis.
Disclosure: This information is for general awareness and does not constitute investment advice
Report Summary
All E Technologies operates as a technology-based business solutions provider, delivering services across business applications, intelligent cloud, automation, data engineering, and artificial intelligence. The company is listed on the National Stock Exchange of India (NSE) under the symbol ALLETEC.SM. Positioned within the Indian technology sector, All E Technologies serves a diverse client base with innovative digital transformation offerings, contributing to its niche presence in the evolving IT services market.
Financially, the company reported a market capitalization of approximately ₹271 crore with a current stock price near ₹134. It has demonstrated a return on capital employed (ROCE) of 22.2% and a return on equity (ROE) of 17.1%, reflecting efficient capital utilization and profitability. The reported price-to-earnings (P/E) ratio stands at about 10.1, indicating a relatively moderate valuation relative to earnings. Dividend yield is modest at 1.13%, and the company maintains a low debt profile, supporting financial stability.
Valuation metrics reveal a price-to-book (P/B) ratio of approximately 1.59, suggesting the stock trades modestly above its book value. The 52-week price range spans from ₹115.8 to ₹309.9, with the current price near the lower end of this range, indicating a significant price correction over the past year. Enterprise value and EBITDA multiples are not available, limiting comprehensive valuation comparisons. The absence of extensive peer data constrains relative market positioning analysis.
Strengths include a nearly debt-free balance sheet and a compound annual growth rate (CAGR) in profits of 25.3% over the last five years, underscoring robust earnings growth. However, earnings include other income of ₹10.3 crore, which may affect core profitability assessment. Key risks involve limited publicly available financial data, sector competition, and potential regulatory challenges in the Indian IT services landscape. Recent strategic updates or leadership changes were not prominently disclosed.
Technically, the stock has experienced downward pressure, trading near its 52-week low with average volumes around 15,000 shares. The lack of moving average data and momentum indicators limits detailed technical insights. Overall, the data suggests a cautious stance with potential for accumulation if fundamental improvements are realized, while acknowledging prevailing market uncertainties.
Company and Industry Overview
Company Basics
Price Performance
Company Size
Shareholding Pattern
The current shareholding structure of All E Technologies is not explicitly detailed in the available data. There is no specific breakdown of insider ownership, institutional investors, or public shareholders. No significant changes in ownership positions have been reported over the past 12 to 24 months. The lack of detailed shareholding information limits insights into institutional accumulation or distribution trends. This absence of transparency suggests a need for cautious interpretation of market sentiment and governance implications. The ownership structure's impact on future corporate actions remains unclear due to insufficient data.
Sector and Industry Analysis
The Information Technology sector is a vast and rapidly expanding market, valued at approximately USD 10.04 trillion in 2026 and projected to reach USD 13.8 trillion by 2030, growing at a compound annual growth rate (CAGR) of 8.3%. This growth is driven by diverse segments including IT services, computer hardware, telecommunications, and software products. Major global players such as IBM, Cisco, Microsoft, and emerging firms collectively shape the competitive landscape, with leading companies holding about 21% market share and mid-tier firms 17%.
Industry trends highlight significant advancements in e-commerce, cybersecurity, and electronic security systems, with the latter expected to grow at a 9.01% CAGR to USD 27.31 billion by 2035. Innovation intensity surpasses 49%, fueled by emerging firms that hold 62% of the market share, emphasizing agility and speed-to-market as critical competitive advantages. Barriers to entry include the need for continuous technological innovation, scale, and the ability to navigate complex supply chains and rapidly evolving customer demands.
The regulatory environment in the IT sector is increasingly complex, with data privacy, cybersecurity standards, and cross-border data flow regulations playing pivotal roles. Regulatory dynamics influence strategic decisions, particularly in cybersecurity and electronic security markets, where compliance requirements drive investments and operational adjustments. Overall, regulatory frameworks are expected to evolve alongside technological advancements, impacting market entry strategies and innovation trajectories.
Note: Analysis synthesized from industry research, market reports, and regulatory filings. Information is subject to change based on market conditions.
Illustrative Scenario Analysis
DCF Assumptions:
Method: Two-Stage EPS-Priority Model
Peer Analysis
| Company Name | Market Cap | P/E Ratio | P/B Ratio | EV/EBITDA | Price to CFO |
|---|---|---|---|---|---|
| ALL E TECHNOLOGIES | 0.00 | N/A | N/A | N/A | N/A |
Comparison Analysis: Due to the absence of listed peers and comprehensive financial metrics for All E Technologies, a direct peer comparison is not feasible. The company lacks available valuation ratios such as P/E, P/B, and EV/EBITDA, which limits benchmarking against industry counterparts. This data gap restricts the ability to identify relative strengths or weaknesses within its sector.
Financial Metrics Comparison with Peers
Financial Statements
Comprehensive financial data including income, balance sheet, and cash flow metrics
Income Statement
Data not available
Balance Sheet
Data not available
Cash Flow Statement
Data not available
Technical Analysis
Key Insights
- The stock is currently trading near its 52-week low of ₹115.8, with the current price at ₹133, indicating a significant downward trend over the past year.
- Key support level is near the 52-week low at ₹115.8, while resistance is observed near the mid-point of the 52-week range around ₹220 to ₹310.
- Data on 10-day, 50-day, and 200-day moving averages is unavailable, limiting assessment of trend confirmation through moving averages.
- Momentum indicators such as RSI, MACD, and Stochastic readings are not provided, restricting evaluation of overbought or oversold conditions.
- Multi-timeframe analysis cannot be conclusively performed due to limited data; however, the downward price movement over the past year suggests bearish momentum on monthly and weekly charts.
- Current technical setup implies potential consolidation near support levels with risk of further downside if support fails, or possible recovery if buying interest increases.
Trending News
Summary: 911,500,000 Class A Common Stock of Space Exploration Technologies Corp. are subject to a Lock-Up Agreement Ending on 6-AUG-2026. These Class A Common Stock will be under lockup for 56 days starting...
Sentiment: neutral
Summary: Zoominfo Technologies Inc., through its operating subsidiaries, offers a go-to-market intelligence and engagement platform for sales, marketing, operations, and recruiting professionals.
Sentiment: positive
3. Headline: 10 Information Technology Stocks With Whale Alerts In Today’s Session - Micron Technology (NASDAQ:MU), De - Benzinga
Summary: This whale alert can help traders discover the next big trading opportunities. Whales are entities with large sums of money and we track their transactions here at Benzinga on our options activity scanner. Traders often
Sentiment: neutral
4. Headline: Teledyne Technologies stock hits all-time high at $693.50 By Investing.com
Summary: The stock’s ascent to this new peak highlights its resilience and the successful execution of its strategic initiatives over the past year. In other recent news, Teledyne Technologies reported second-quarter results that surpassed both company guidance and Wall Street expectations.
Sentiment: positive
5. Headline: MU Stock Slides As AI Chip Euphoria Unwinds
Summary: COMP Stock Climbs As Earnings Beat Ignites Bullish Targets · Yet MU trades around a mid‑teens to high‑teens price‑to‑earnings multiple and over 10 times sales, rich versus traditional memory cycles. That valuation leaves less room for error when sentiment sours, which is exactly what traders are seeing now on the chart. The recent tape in MU is all about momentum unwinding. News that Micron Technology ...
Sentiment: positive
Powered by Brave
Recent Updates
News Summary
As of 06 August 2026. All E Technologies Ltd, incorporated in 2000, specializes in technology-based business solutions including business applications, intelligent cloud, automation, data engineering, and AI. The company currently has a market capitalization of approximately ₹271 crore with a stock price around ₹134. Financial metrics indicate a P/E ratio near 10.1, ROCE of 22.2%, and ROE of 17.1%, reflecting solid profitability and capital efficiency. The company is nearly debt-free and has achieved a 25.3% CAGR in profit growth over the last five years, although reported earnings include other income of ₹10.3 crore, which may influence core earnings evaluation. Regular investor calls have been conducted through 2023 and 2024, indicating active shareholder engagement. The stock trades within a 52-week range of ₹115.8 to ₹309.9, currently near the lower bound, suggesting recent price weakness.
News Sentiment
The overall sentiment from recent updates is cautiously positive. Financial results and growth metrics demonstrate strong profitability and operational efficiency, supported by a low debt profile and consistent investor communication. However, the inclusion of other income in earnings and the significant decline from the 52-week high temper enthusiasm. Market data and news coverage show stable trading activity without major volatility. The neutral tone in investor communications and absence of significant strategic announcements suggest a balanced outlook with no immediate catalysts or concerns dominating sentiment.
Source List
- https://www.screener.in/company/ALLETEC/consolidated/
- https://economictimes.indiatimes.com/all-e-technologies-ltd/stocks/companyid-50985.cms
- https://www.alletec.com/investors-alletec/
Analytical Overview
Analysis Summary
The company’s valuation metrics, including a P/E ratio of approximately 10.1 and a P/B ratio near 1.59, are moderate relative to typical industry averages in the Indian technology sector, indicating a reasonable valuation level. Revenue growth and cash flow trends show a 25.3% CAGR profit growth over five years, reflecting a positive growth trajectory, although detailed cash flow data is limited. Financial health appears robust with minimal debt and a strong return on capital employed of 22.2%, supporting operational stability. Sector-specific challenges include competitive pressures in IT services and the need for continuous innovation, while opportunities exist in cloud, AI, and automation services. Considering the Indian market environment, regulatory stability and growing digital adoption provide a supportive backdrop for the company’s offerings.
Overall Business and Market Assessment
Supporting Factors: Key supporting factors include the company’s strong profitability metrics with ROCE of 22.2% and ROE of 17.1%, a low debt position, and consistent profit growth over five years. Risks to monitor involve the reliance on other income within earnings, limited publicly available financial disclosures, and competitive dynamics in the technology sector. A medium-term investment horizon is appropriate to assess the company’s ability to sustain growth and improve valuation metrics. Overall, the analysis reflects a balanced profile with solid fundamentals tempered by data limitations and market uncertainties.
Risk Factors: No data
SWOT Analysis
Strengths
- Strong profitability with ROCE of 22.2% and ROE of 17.1%.
- Nearly debt-free financial structure supporting stability.
- Consistent profit growth at a 25.3% CAGR over five years.
- Diverse technology solutions including AI, cloud, and automation.
Weaknesses
- Earnings include significant other income impacting core profitability assessment.
- Limited availability of detailed financial and valuation data.
- Stock price has declined substantially from 52-week high.
- Lack of transparent shareholding pattern information.
Opportunities
- Growing demand for digital transformation and AI services in India.
- Expansion potential in intelligent cloud and automation segments.
- Increasing adoption of technology solutions by enterprises.
- Potential to leverage innovation for competitive differentiation.
Threats
- Intense competition within the Indian IT services industry.
- Regulatory changes impacting technology sector operations.
- Market volatility affecting stock price stability.
- Dependence on continued technological advancements to sustain growth.
Company Description
COMPANY DESCRIPTION