
Aeroflex Industries Ltd (AEROFLEX)
Stock Analysis Report
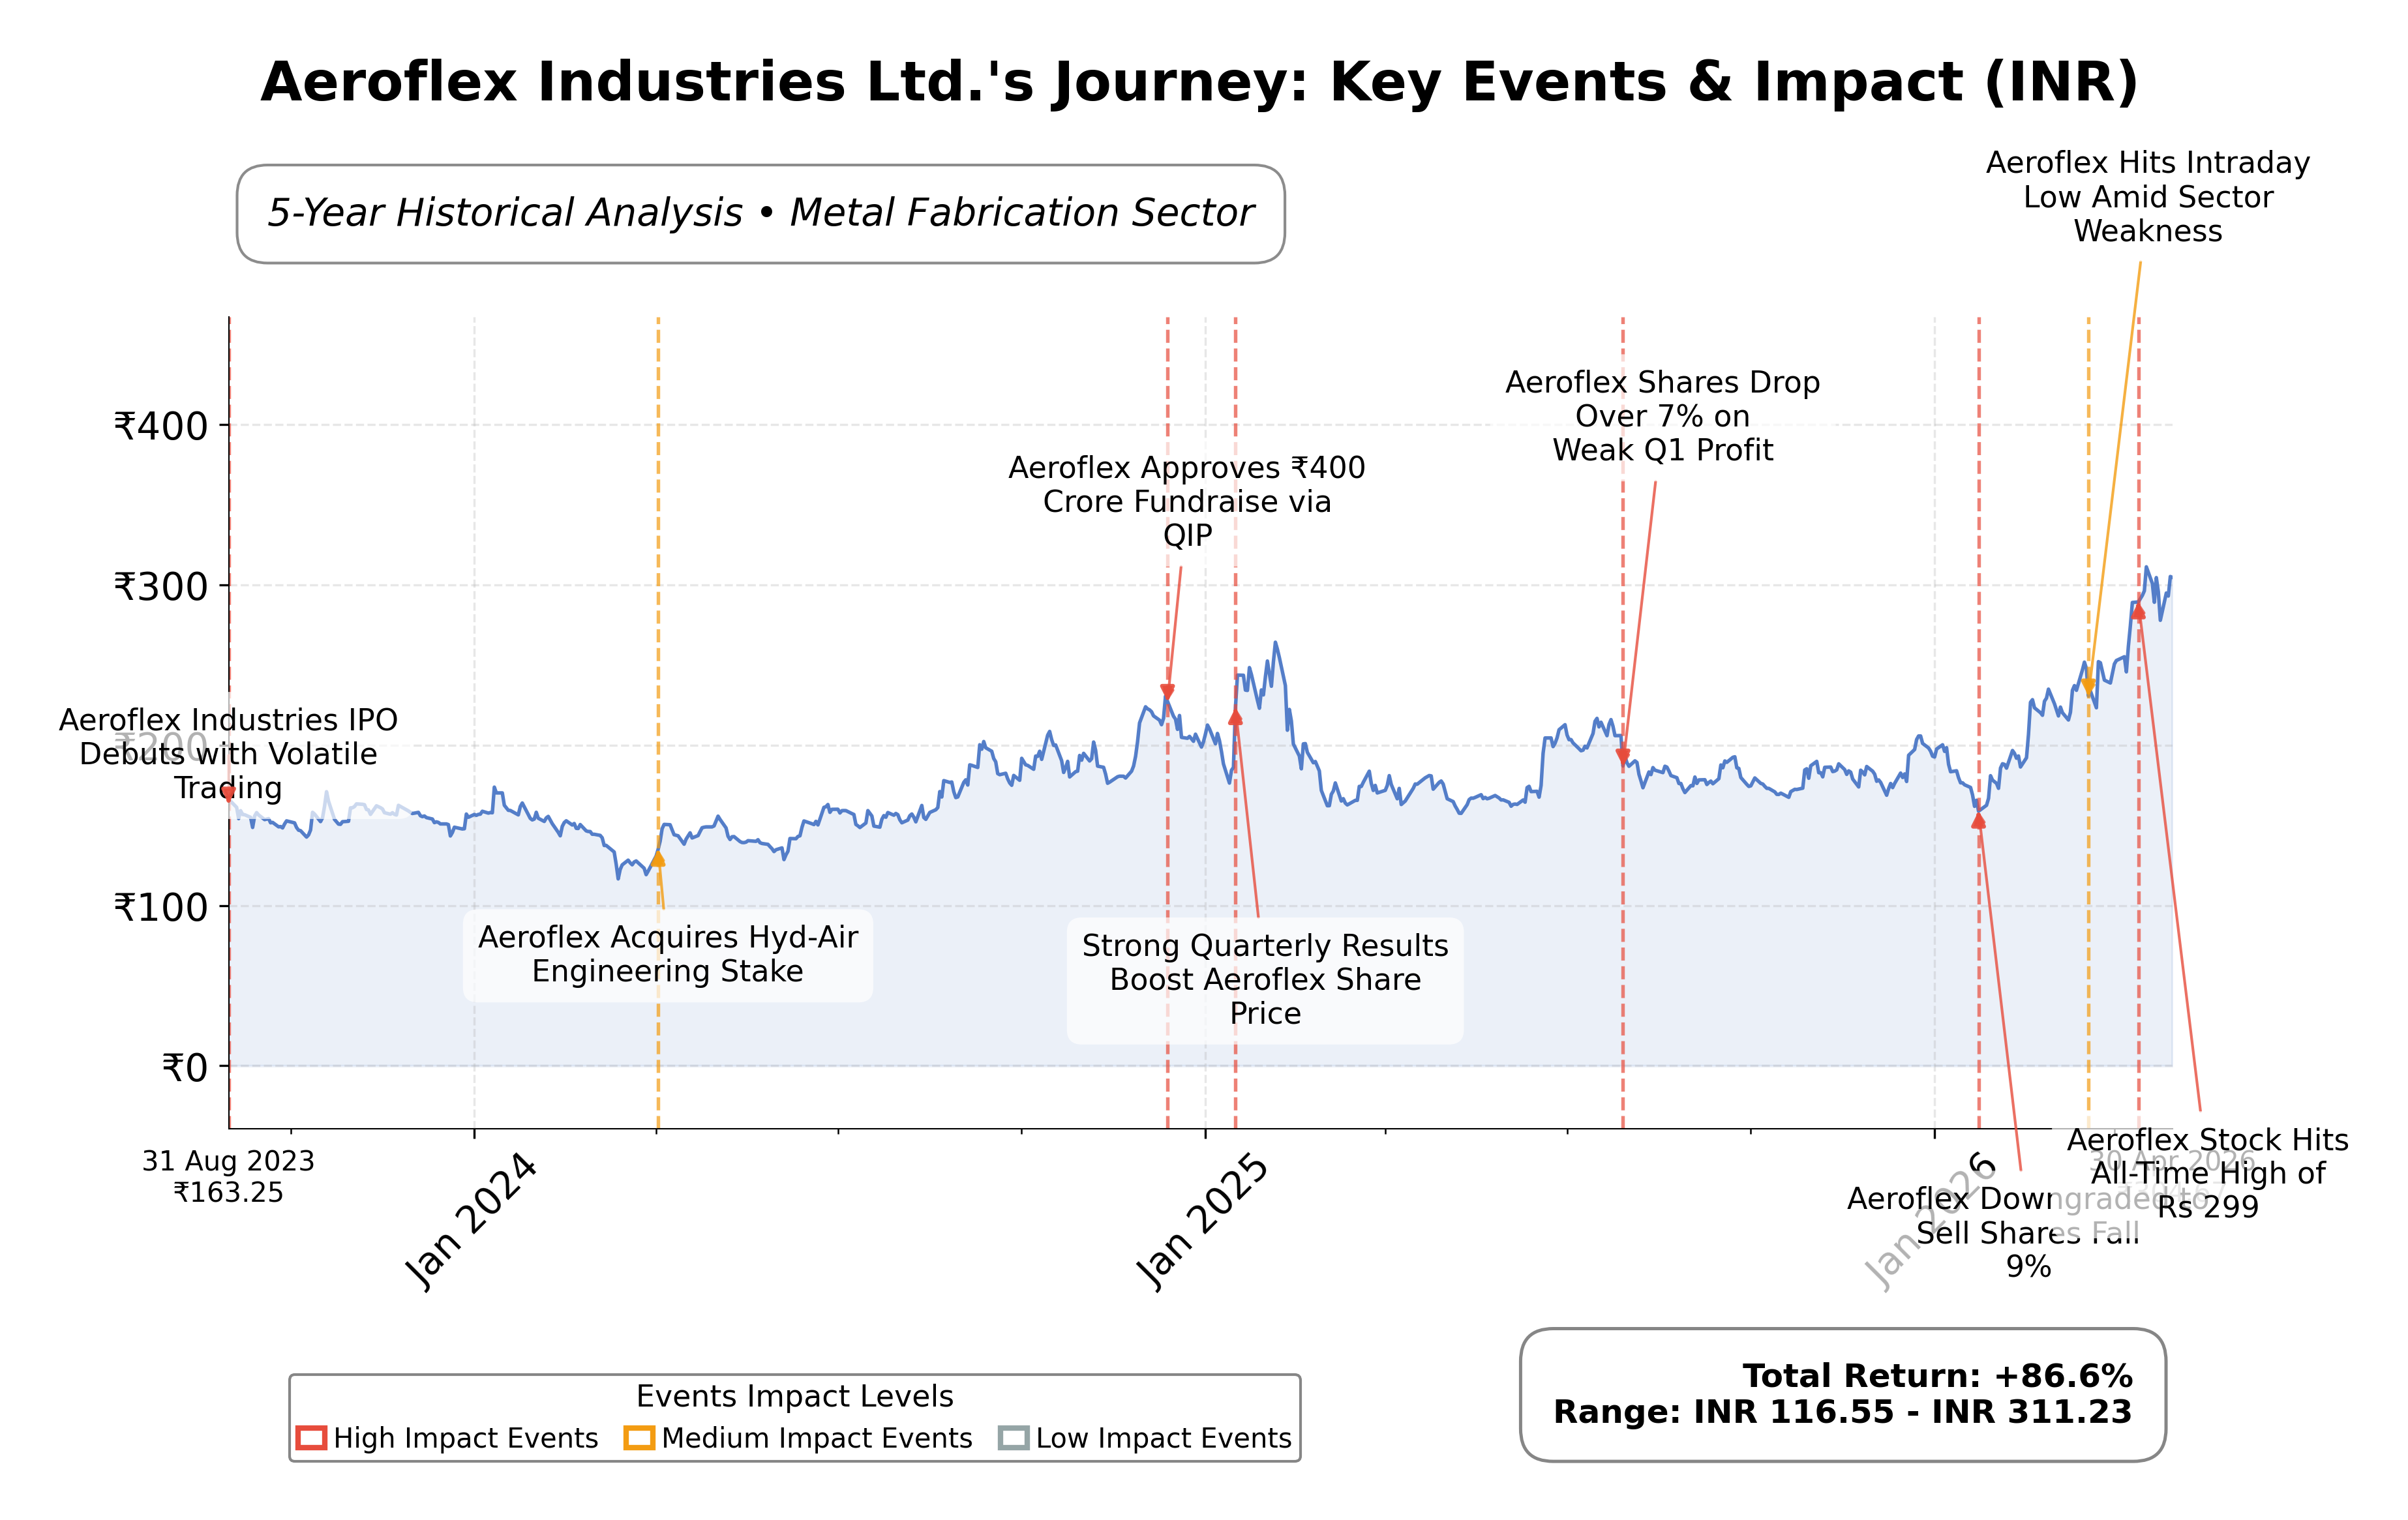
Stock Journey
Key Positives and Key Risks
Pros
- Aeroflex Industries reports a strong return on equity of 15.33%, indicating efficient use of shareholder capital.
- The company has demonstrated robust revenue growth of 21.1% quarter-over-quarter, reflecting strong market demand.
- A healthy current ratio of 2.91 and low total debt of INR 92.99 million against cash reserves of INR 285 million indicate solid financial health.
Cons
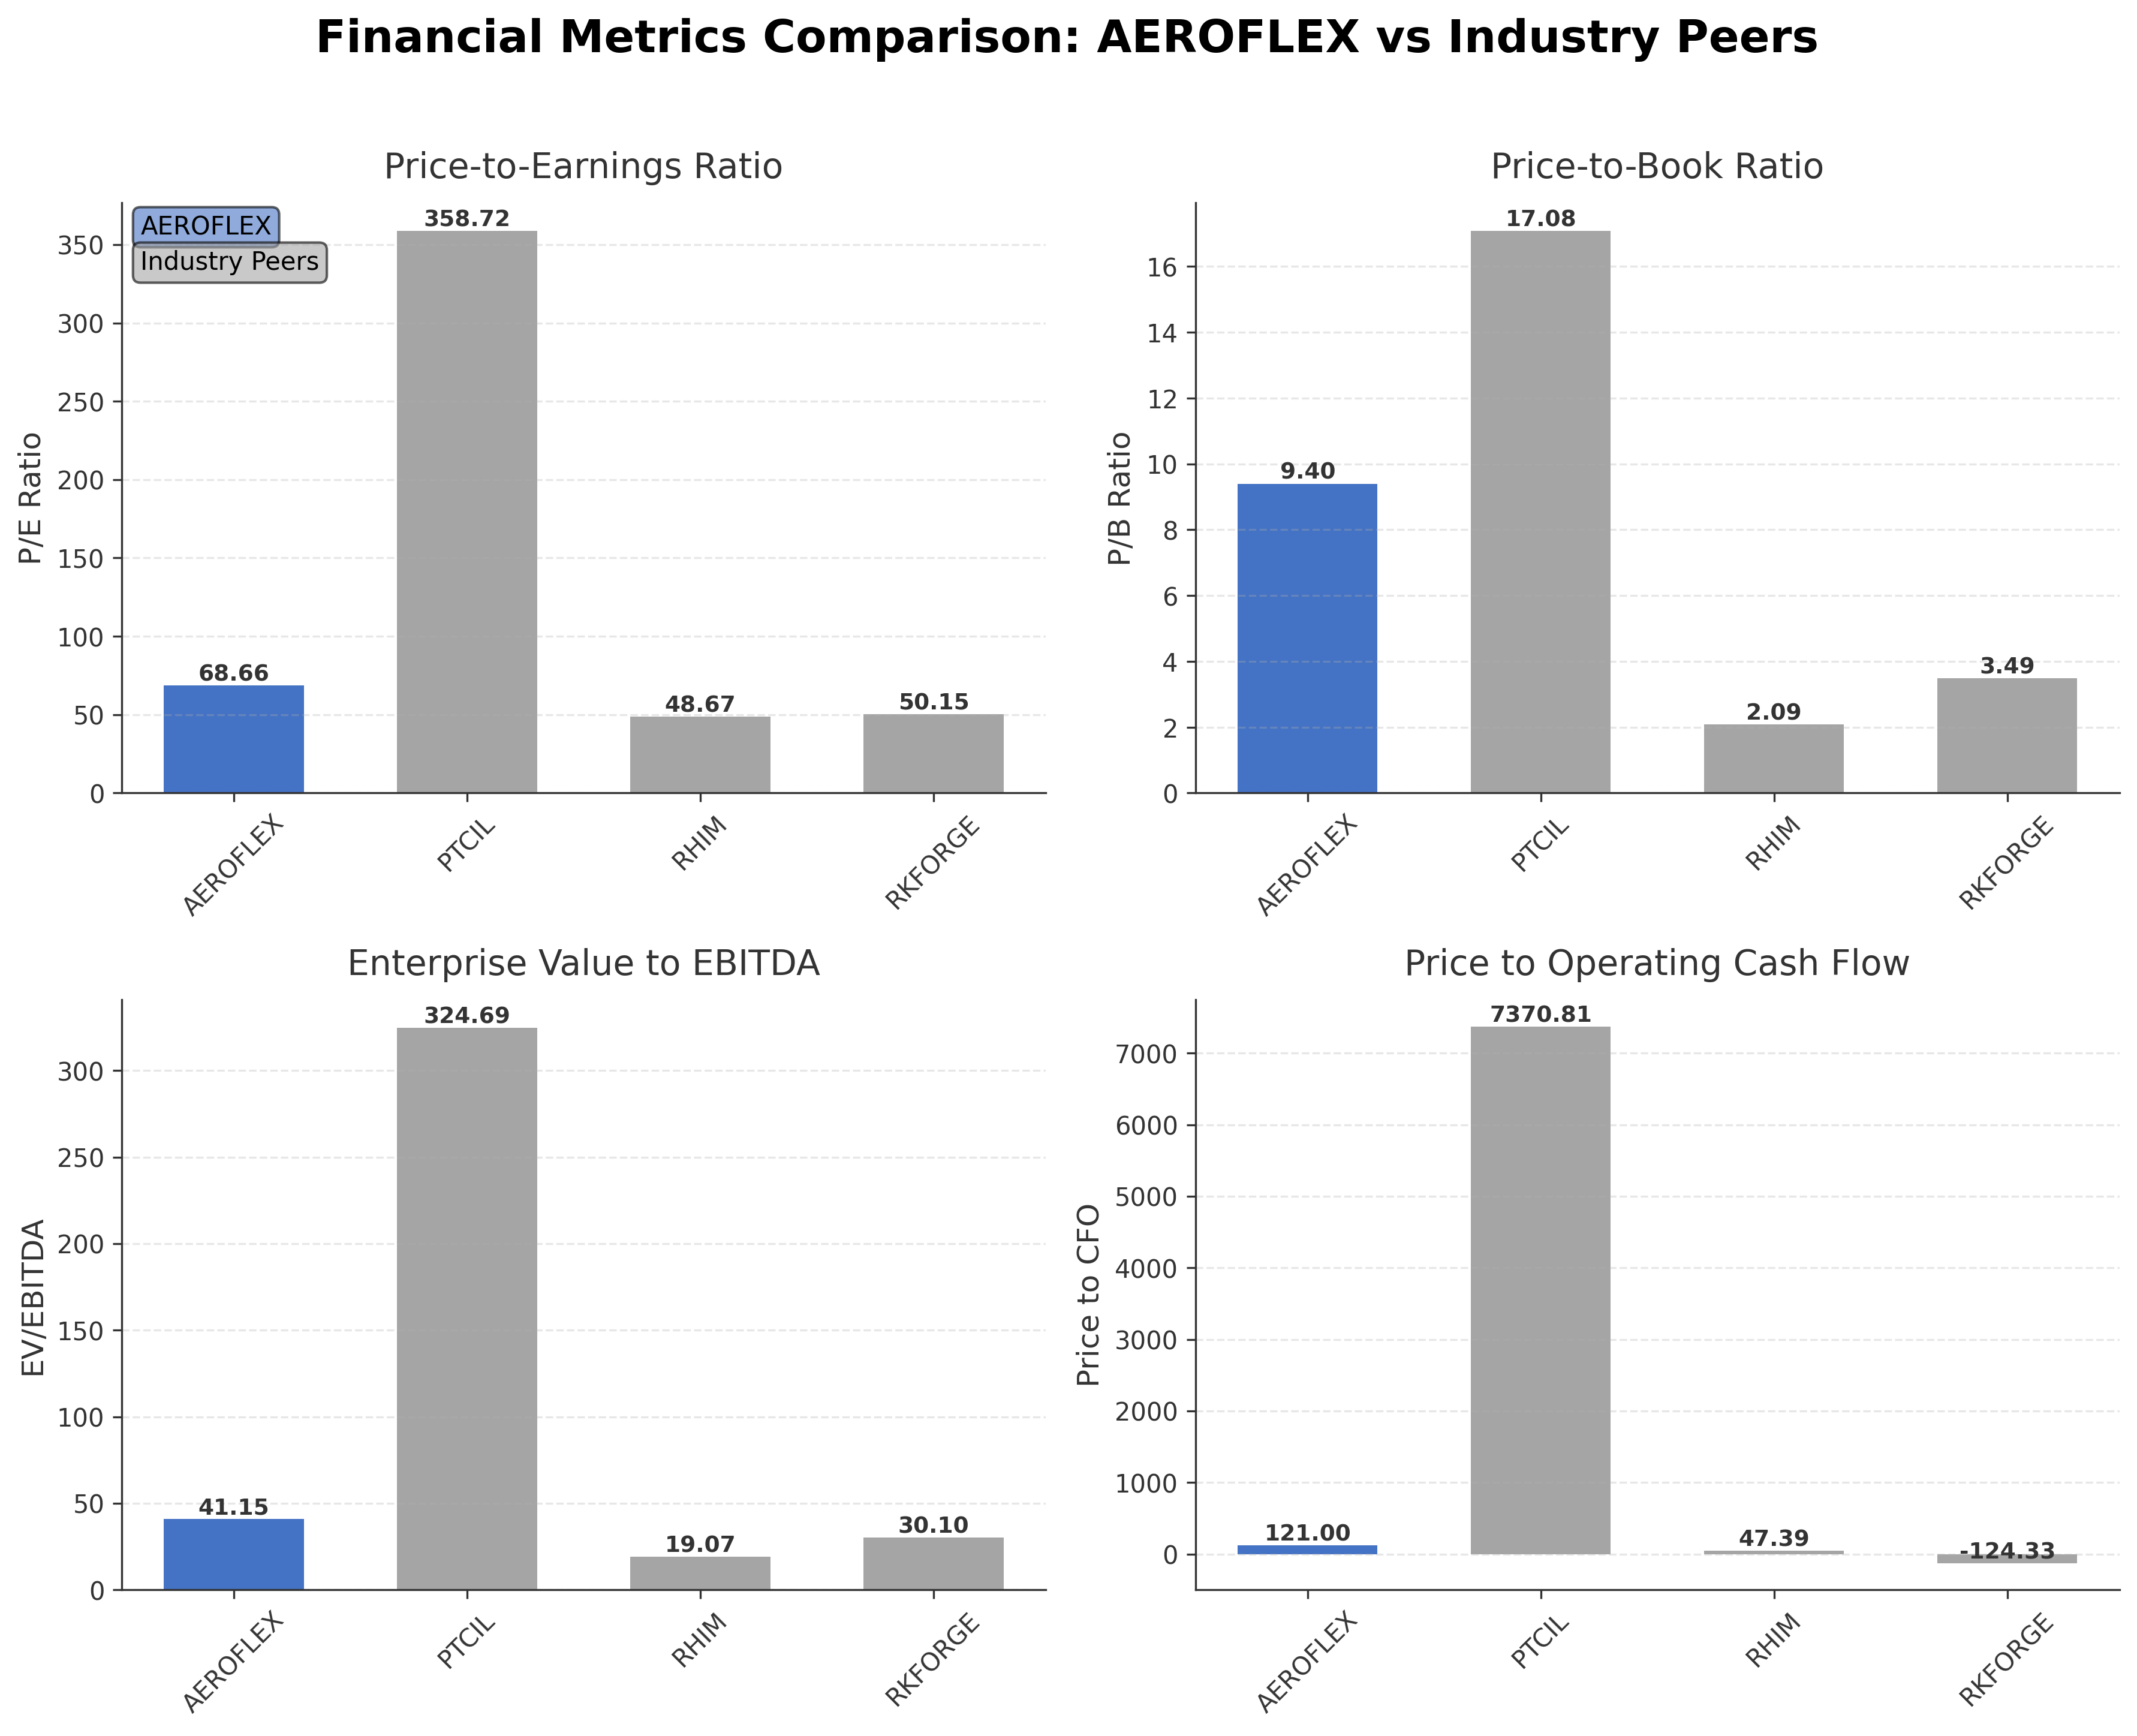
- Valuation multiples are elevated, with a trailing P/E of 68.66 and price-to-book ratio of 9.40, suggesting premium pricing.
- Price to cash flow ratio is high at 121.00, indicating the stock is priced richly relative to cash generation.
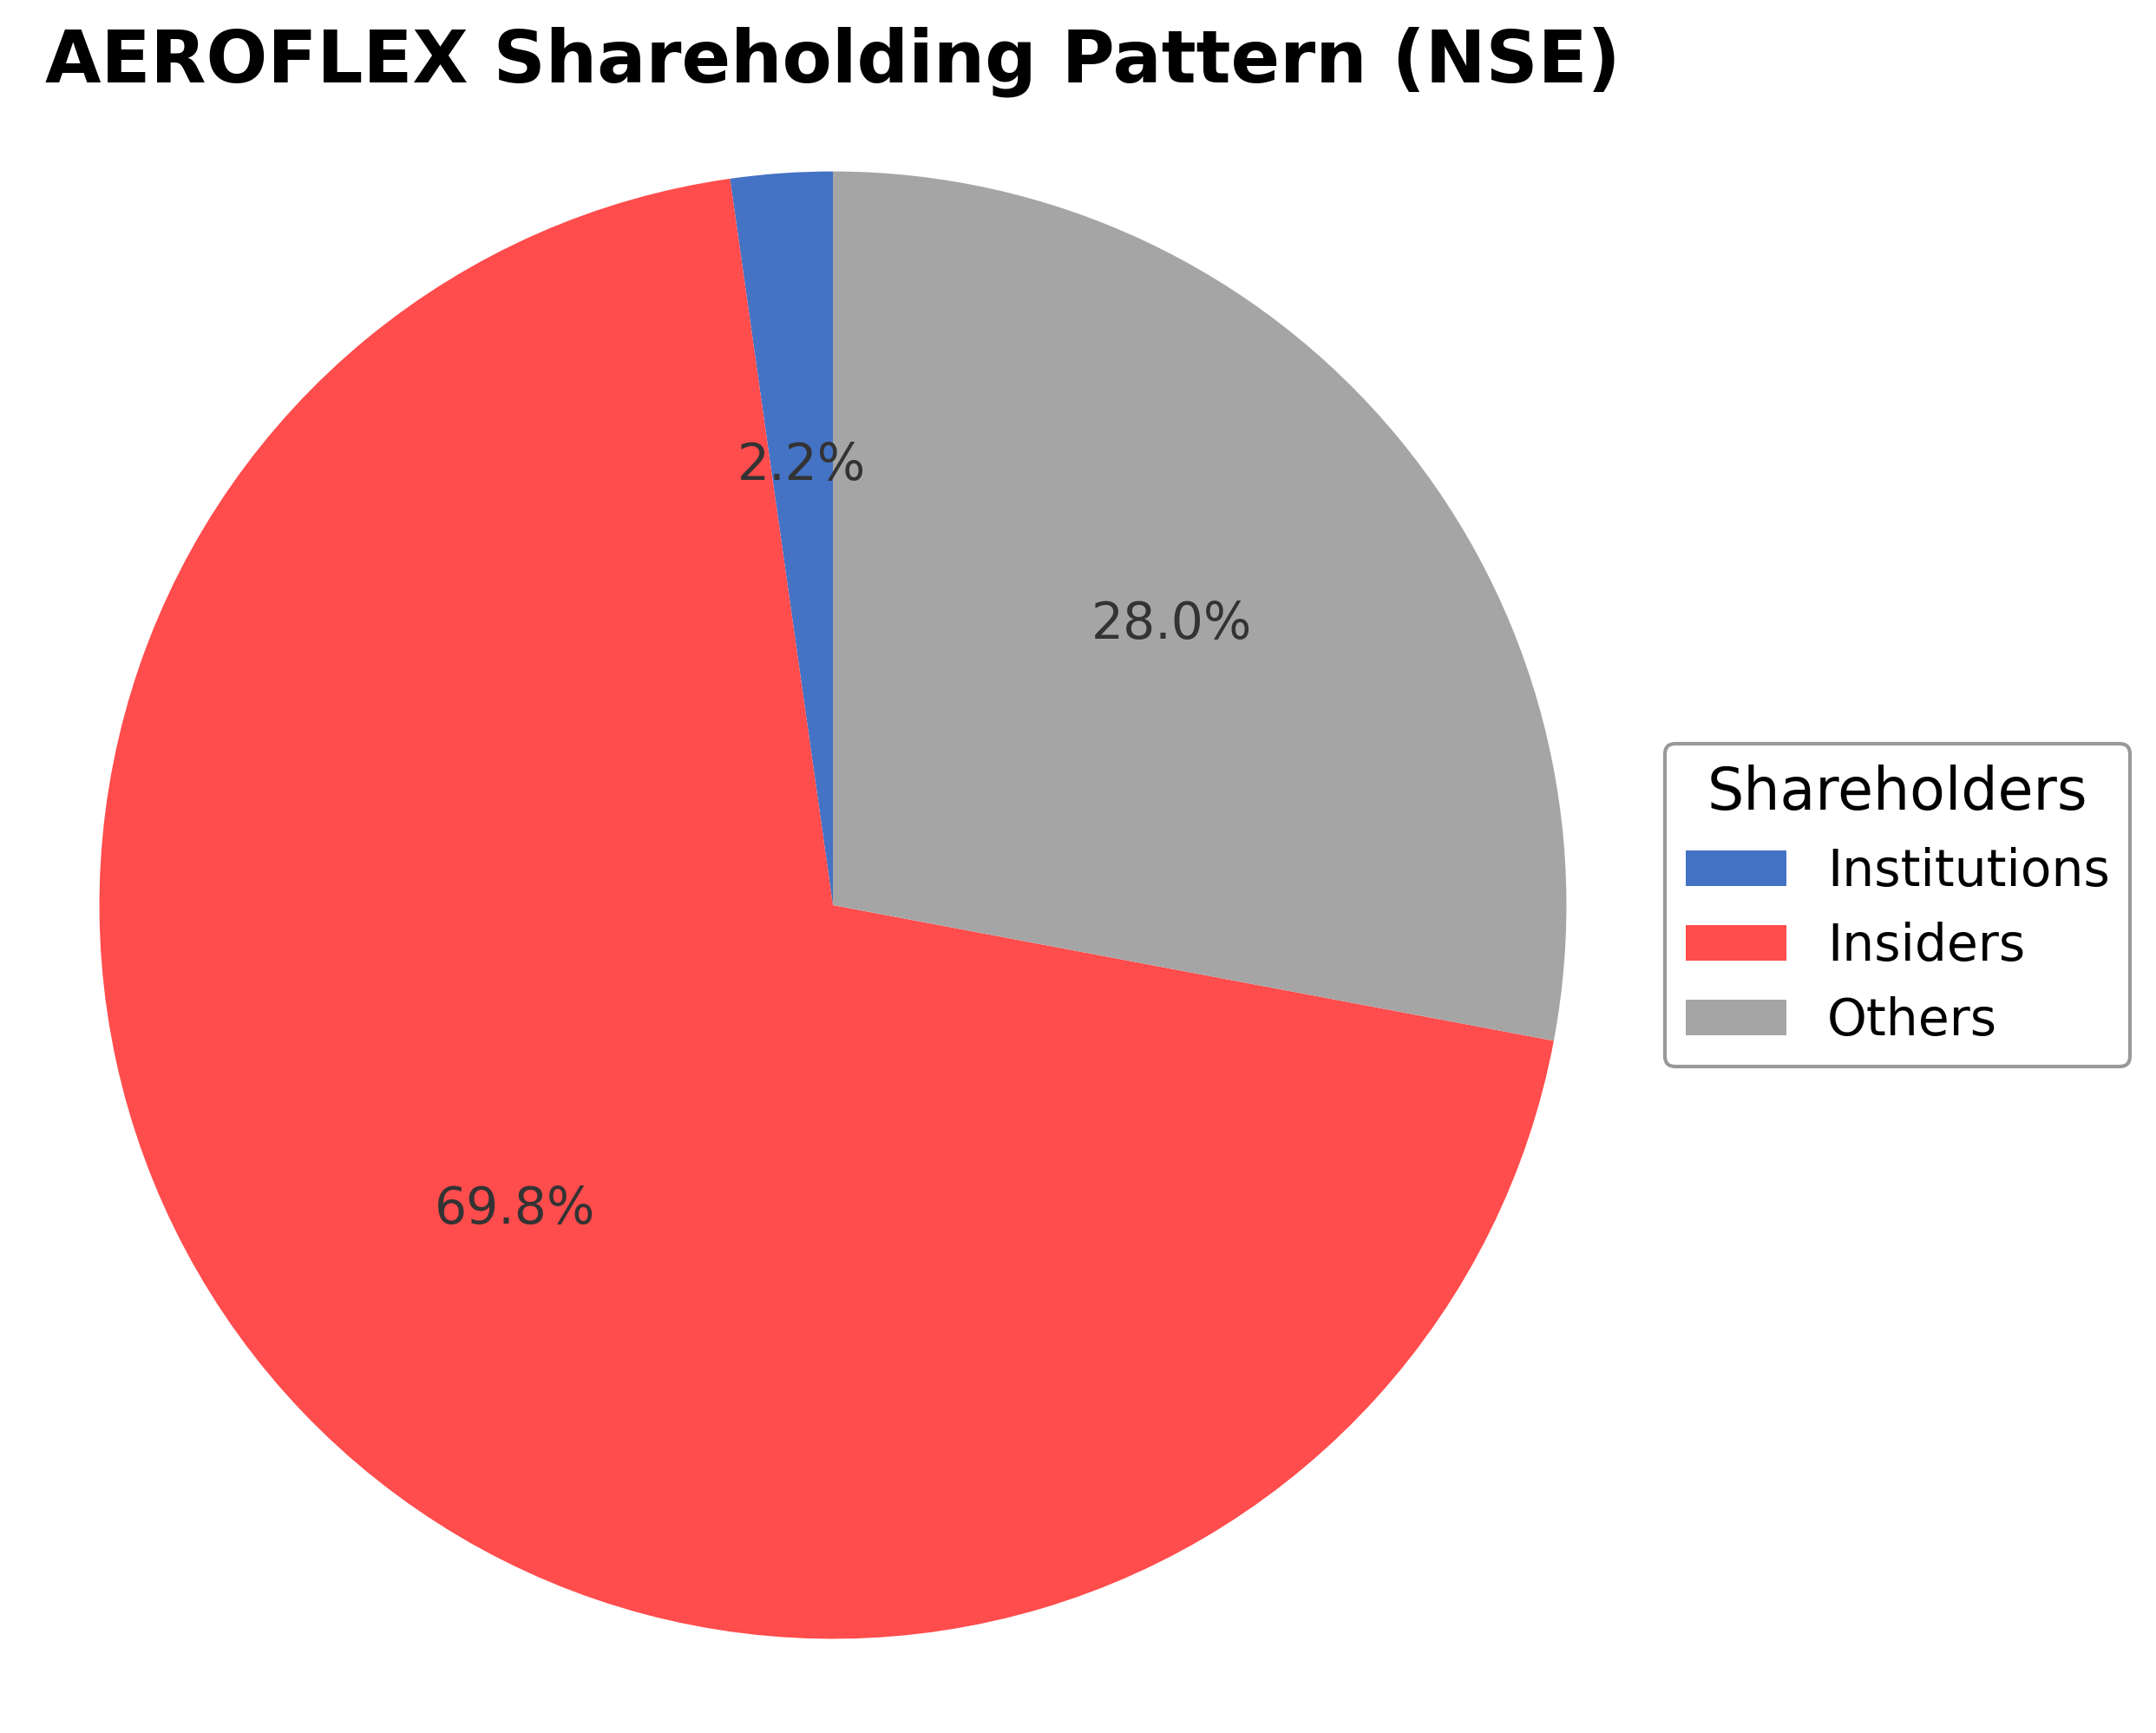
- Limited institutional ownership at 2.24% may reflect cautious external investor sentiment.
Disclosure: This information is for general awareness and does not constitute investment advice
Report Summary
Aeroflex Industries Ltd. operates primarily in the industrial sector on the National Stock Exchange of India (NSE), specializing in the manufacturing of flexible flow solutions such as hoses, fittings, and expansion joints. These products serve critical roles in fluid and gas transfer across diverse industries including aerospace, defense, automotive, and energy. Positioned as a key player in metal fabrication, Aeroflex emphasizes technological innovation and quality to meet stringent industry standards, supporting both domestic and international markets with durable and reliable solutions.
Financially, Aeroflex reported trailing twelve months (TTM) revenue of approximately INR 4.08 billion with a gross margin of 44.33%, operating margin of 18.27%, and a net profit margin of 12.05%. The company’s return on equity (ROE) stands at 15.33%, and return on assets (ROA) at 12.31%, reflecting efficient asset utilization and solid profitability. Its operating cash flow totaled INR 300 million TTM, with free cash flow at INR 525 million, indicating healthy cash generation relative to earnings.
Valuation metrics show a trailing price-to-earnings (P/E) ratio of 68.66 and a forward P/E of 37.47, suggesting expectations of earnings growth. The price-to-book (P/B) ratio is elevated at 9.40, and the enterprise value to EBITDA (EV/EBITDA) ratio is 41.15, which are relatively high compared to industry peers. The stock trades at INR 304.15, near its 52-week high of INR 282, indicating strong recent price performance and market confidence.
Key strengths include a strong balance sheet with a current ratio of 2.91, low total debt of INR 92.99 million against cash reserves of INR 285 million, and consistent revenue growth of 21.1% quarter-over-quarter. Risks include high valuation multiples, sector cyclicality, and competitive pressures in metal fabrication. Recent strategic actions include maintaining regulatory compliance and scheduling an earnings call for May 6, 2026, to discuss Q4 and full fiscal year results, reflecting transparency and investor engagement.
Technically, the stock has shown robust momentum, recently reaching new 52-week highs supported by strong volume and positive price action across multiple timeframes. The current price is above key moving averages, indicating an upward trend. Overall, the data suggests a market environment where careful observation of valuation and earnings developments is prudent, with conditions favoring active monitoring of performance and market dynamics.
Company and Industry Overview
Company Basics
Price Performance
Company Size
Shareholding Pattern
Sector and Industry Analysis
The metallic flexible flow solutions sector in India serves a niche yet growing market, catering primarily to industries requiring controlled flow systems such as automotive, oil and gas, and infrastructure. The market has witnessed steady growth, driven by increasing industrialization and infrastructure development, with companies like Aeroflex Industries Ltd. leading alongside other established players. The sector’s market capitalization spans from mid-sized firms to large conglomerates, reflecting a diverse competitive landscape.
Industry trends highlight a shift towards environment-friendly and technologically advanced products, with manufacturers expanding their SKU portfolios to meet varied customer demands. Competitive dynamics are influenced by product innovation, quality certifications, and cost efficiencies, creating moderate barriers to entry due to the need for specialized manufacturing capabilities and compliance standards. Aeroflex’s extensive product range and near debt-free balance sheet position it competitively, although promoter shareholding changes and valuation multiples remain key considerations.
The regulatory environment emphasizes adherence to environmental norms and quality standards, impacting manufacturing processes and product certifications. Compliance with pollution control and safety regulations is critical, as is alignment with export standards for international markets. Ongoing regulatory scrutiny encourages sustainable practices and innovation, shaping the sector’s outlook towards more eco-friendly and efficient flow solution products.
Note: Analysis synthesized from industry research, market reports, and regulatory filings. Information is subject to change based on market conditions.
Financial Ratios Dashboard
Illustrative Scenario Analysis
DCF Assumptions:
Method: Two-Stage EPS-Priority Model
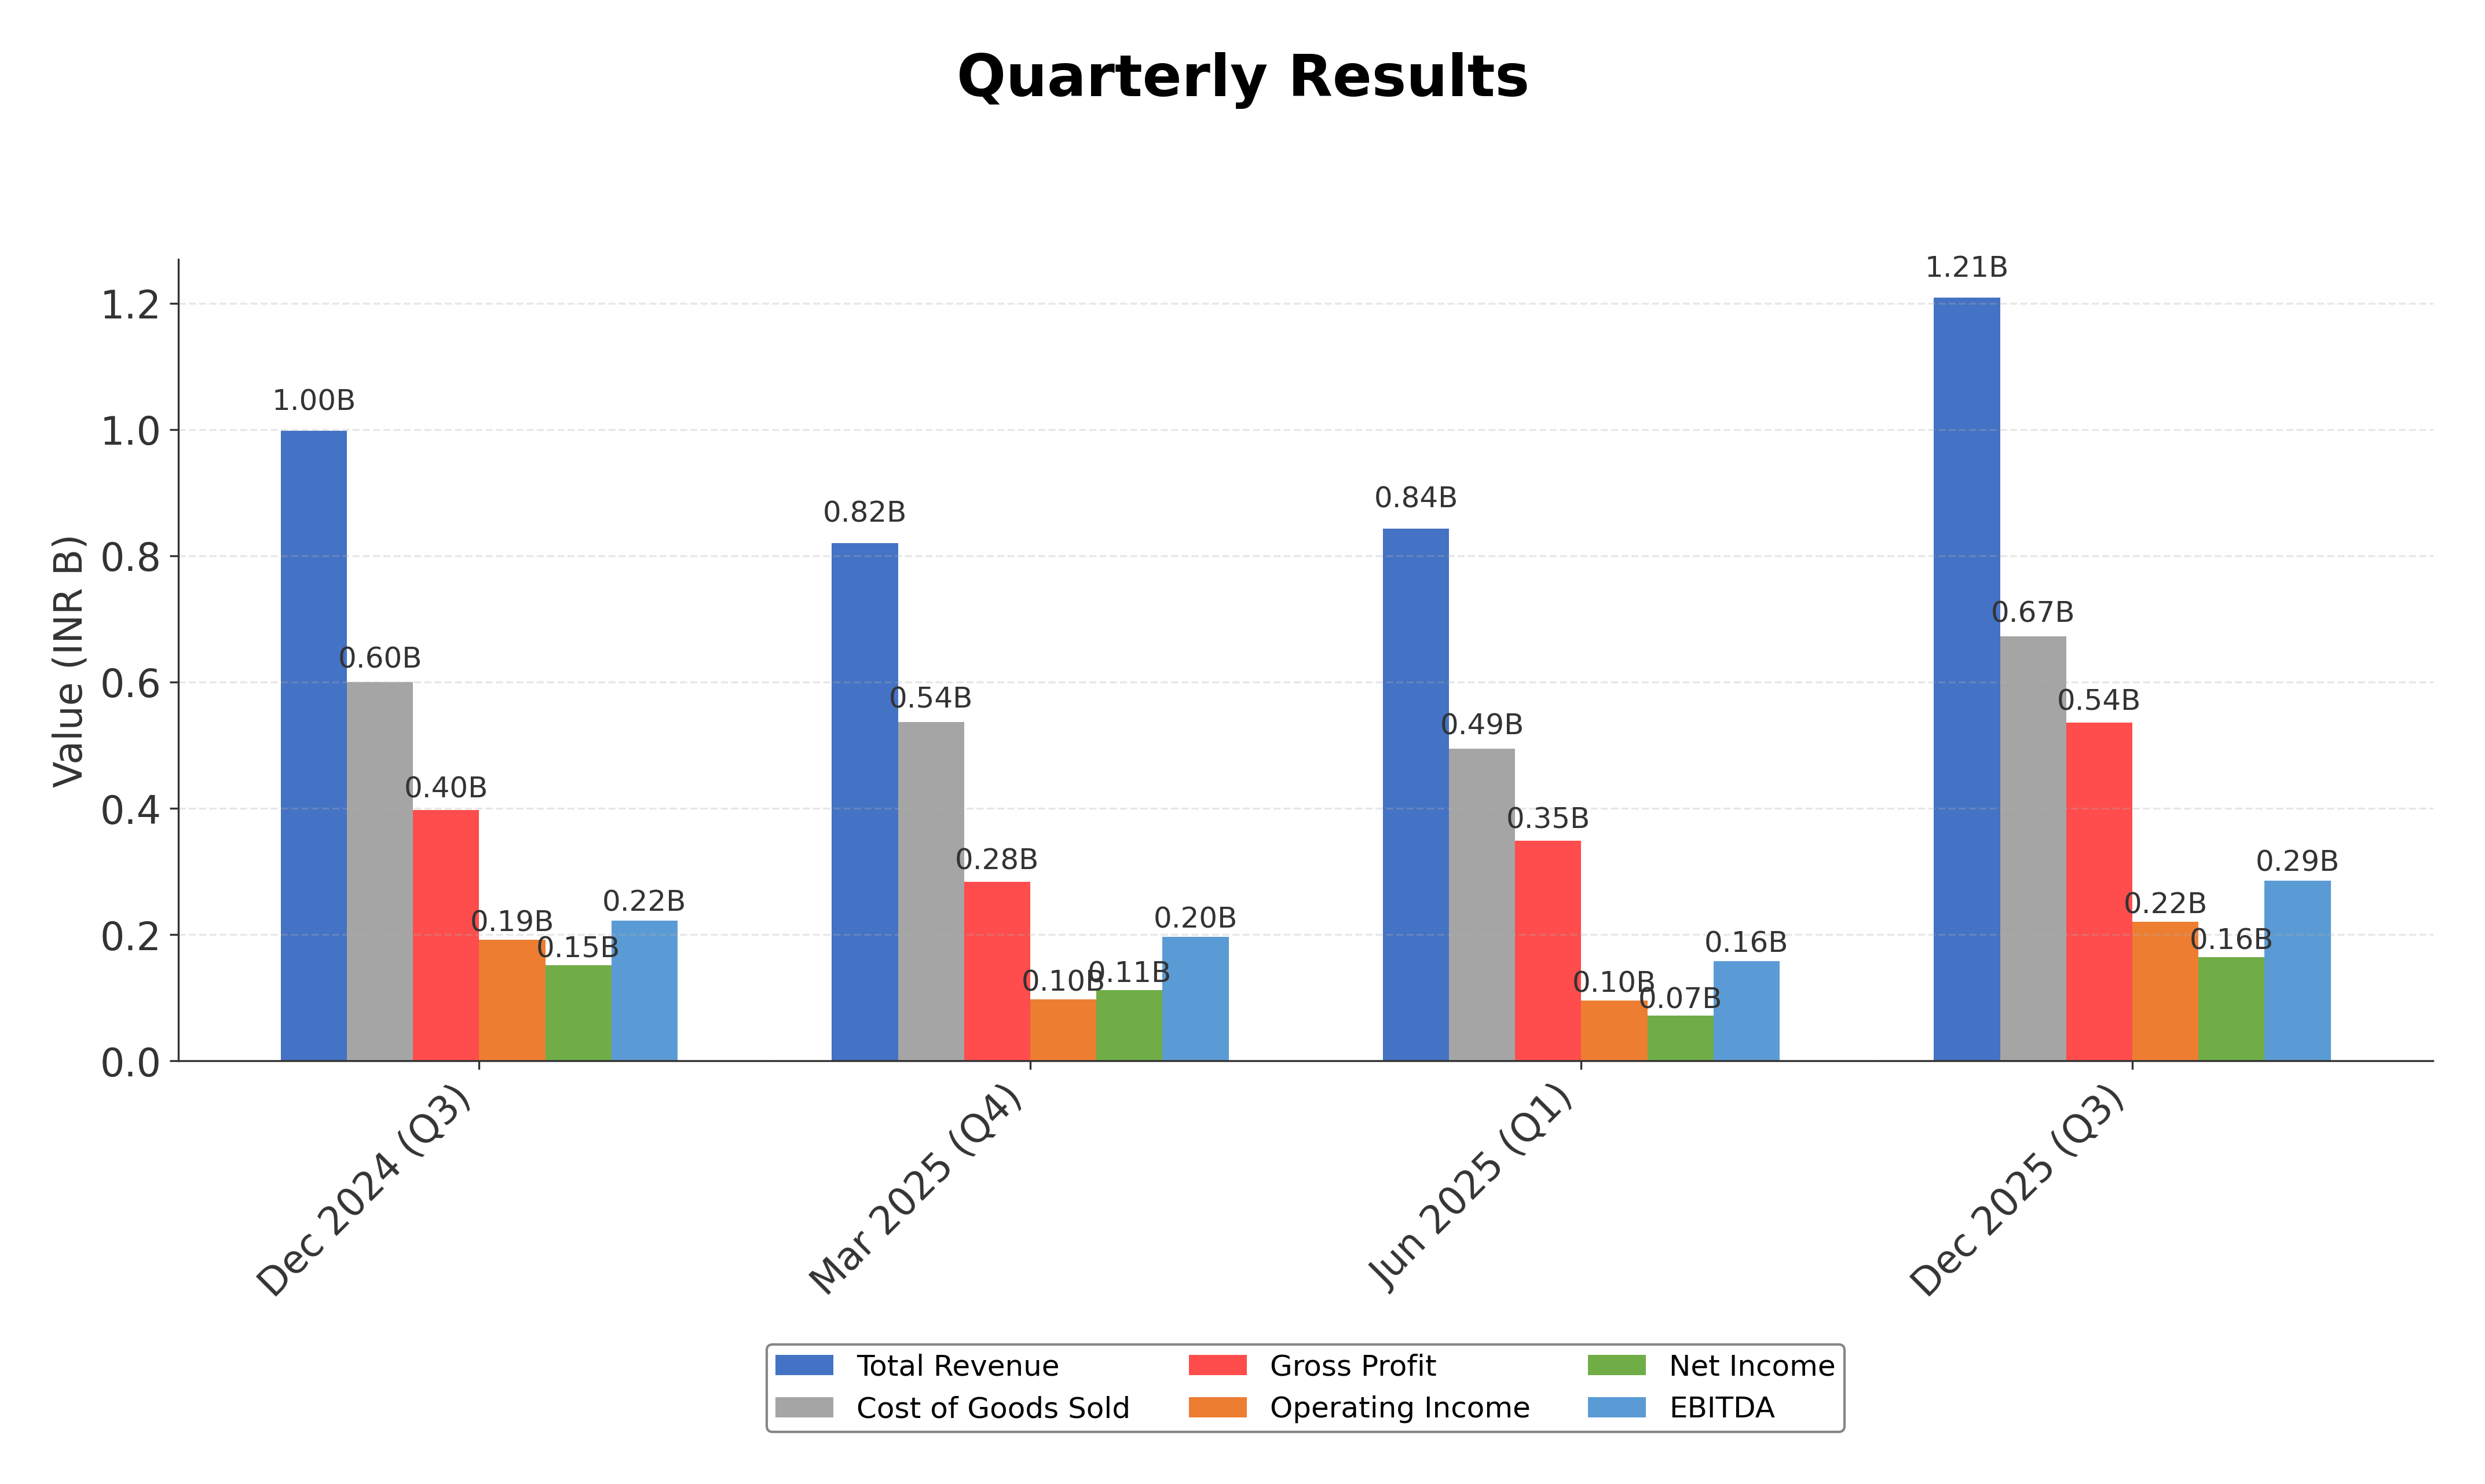
Financials
Peer Analysis
| Company Name | Market Cap | P/E Ratio | P/B Ratio | EV/EBITDA | Price to CFO |
|---|---|---|---|---|---|
| Aeroflex Industries Ltd. | ₹36.35B | 68.66 | 9.40 | 41.15 | 121.00 |
| PTC Industries Ltd. | ₹240.90B | 358.72 | 17.08 | 324.69 | 7370.81 |
| RHI Magnesita India Ltd. | ₹83.41B | 48.67 | 2.09 | 19.07 | 47.39 |
| Ramkrishna Forgings Ltd. | ₹108.56B | 50.15 | 3.49 | 30.10 | -124.33 |
Comparison Analysis: Aeroflex Industries Ltd. exhibits a higher P/E ratio of 68.66 compared to its peers, indicating elevated market expectations for earnings growth. Its P/B ratio of 9.40 is significantly above the peer group average, reflecting a premium valuation relative to book value. The EV/EBITDA multiple at 41.15 is also notably higher than competitors, suggesting the stock is priced richly on an enterprise earnings basis. Despite this, Aeroflex’s return on equity of 15.33% is competitive and among the highest in the peer set, demonstrating efficient capital utilization. Price to CFO is substantially elevated at 121.00, indicating a premium on cash flow relative to peers. Overall, Aeroflex stands out for its strong profitability but commands a valuation premium compared to regional industry peers.
Financial Metrics Comparison with Peers
Financial Statements
Comprehensive financial data including income, balance sheet, and cash flow metrics
Income Statement
| fiscal_date | 2025-03-31 | 2024-03-31 | 2023-03-31 | 2022-03-31 | 2021-03-31 |
|---|---|---|---|---|---|
| Sales | 3.67B | 3.12B | 2.63B | 2.33B | 1.40B |
| Cost Of Goods | 2.24B | 2.01B | 1.71B | 1.56B | 935.58M |
| Gross Profit | 1.43B | 1.10B | 919.92M | 769.25M | 461.73M |
| Operating Expense Selling General And Administrative | 115.84M | 74.71M | 68.72M | 55.82M | 37.91M |
| Operating Expense Other Operating Expenses | 238.87M | 193.36M | 143.52M | 139.41M | 104.46M |
| Operating Income | 626.18M | 526.09M | 430.44M | 399.33M | 178.10M |
| Non Operating Interest Income | 23.04M | 27.82M | 171.00K | 530.00K | 610.00K |
| Non Operating Interest Expense | 3.36M | 19.84M | 29.94M | 56.79M | 84.63M |
| Pretax Income | 699.48M | 572.50M | 412.25M | 368.62M | 80.49M |
| Income Tax | 174.41M | 155.16M | 110.73M | 93.57M | 20.38M |
| Net Income | 525.08M | 417.34M | 301.52M | 275.06M | 60.11M |
| Eps Basic | 4.06 | 3.39 | 2.33 | 2.13 | 0.46 |
| Eps Diluted | 4.06 | 3.39 | 2.33 | 2.13 | 0.46 |
| Basic Shares Outstanding | 129.32M | 123.20M | 129.32M | 129.32M | 129.32M |
| Diluted Shares Outstanding | 129.32M | 123.20M | 129.32M | 129.32M | 129.32M |
| Ebit | 702.85M | 592.34M | 442.19M | 425.41M | 165.12M |
| Ebitda | 821.91M | 655.10M | 497.49M | 468.86M | 212.05M |
| Net Income Continuous Operations | 699.48M | 572.50M | 412.25M | 368.62M | 80.49M |
| Preferred Stock Dividends | 0.00 | 0.00 | 0.00 | 0.00 | 0.00 |
Source: Financial statements and regulatory filings
Balance Sheet
| fiscal_date | 2025-03-31 | 2024-03-31 | 2023-03-31 | 2022-03-31 | 2021-03-31 |
|---|---|---|---|---|---|
| Cash And Cash Equivalents | 263.02M | 765.00M | 61.32M | 82.05M | 34.77M |
| Accounts Receivable | 1.17B | 947.23M | 669.70M | 526.12M | 337.80M |
| Total Assets | 4.27B | 3.75B | 2.14B | 1.83B | 1.62B |
| Total Liabilities | 841.35M | 818.20M | 998.84M | 972.15M | 1.03B |
| Long Term Debt | 3.26M | 634.00K | 196.86M | 209.86M | 352.80M |
| Shareholders Equity | 3.42B | 2.93B | 1.14B | 862.23M | 587.17M |
Source: Financial statements and regulatory filings
Cash Flow Statement
| fiscal_date | 2025-03-31 | 2024-03-31 | 2023-03-31 | 2022-03-31 | 2021-03-31 |
|---|---|---|---|---|---|
| Operating Activities Net Income | 699.48M | 572.50M | 412.25M | 368.62M | 80.49M |
| Operating Activities Other Non Cash Items | -19.42M | -6.40M | 34.34M | 10.00K | 30.00K |
| Operating Activities Accounts Receivable | -217.95M | -277.53M | -143.58M | -187.89M | -42.22M |
| Operating Activities Other Assets Liabilities | -161.71M | 55.24M | -198.98M | 167.42M | -21.04M |
| Operating Activities Operating Cash Flow | 300.39M | 343.82M | 104.03M | 348.16M | 17.26M |
| Investing Activities Capital Expenditures | -1.03B | -376.87M | -94.56M | -133.85M | -29.09M |
| Investing Activities Other Investing Activity | 275.07M | N/A | N/A | N/A | N/A |
| Investing Activities Investing Cash Flow | -759.56M | -376.87M | -94.56M | -133.85M | -29.09M |
| Financing Activities Long Term Debt Issuance | 6.40M | 0.00 | 58.79M | N/A | N/A |
| Financing Activities Long Term Debt Payments | -1.78M | -448.85M | -13.00M | -142.94M | -103.87M |
| Financing Activities Common Stock Issuance | 0.00 | 1.62B | 0.00 | N/A | N/A |
| Financing Activities Common Dividends | -32.33M | -22.86M | -22.86M | N/A | N/A |
| Financing Activities Financing Cash Flow | -27.71M | 1.15B | 94.70M | -139.41M | -184.76M |
| End Cash Position | 263.02M | 1.06B | 62.53M | 83.29M | 35.92M |
| Free Cash Flow | -768.79M | 63.92M | -22.39M | 186.78M | 91.79M |
| Investing Activities Purchase Of Investments | N/A | 0.00 | 0.00 | N/A | N/A |
| Financing Activities Other Financing Charges | N/A | -1.00K | -10.00K | 10.00K | N/A |
| Financing Activities Short Term Debt Issuance | N/A | N/A | 71.79M | 3.52M | -80.89M |
Source: Financial statements and regulatory filings
Technical Analysis
Key Insights
- Aeroflex Industries Ltd. is currently in a strong uptrend, with price action forming higher highs and higher lows over recent weeks.
- Key support levels are identified near ₹280 and ₹260, while resistance is observed around the recent high of ₹299 to ₹304.
- The stock price is trading above its 10-day (approx. ₹220), 50-day (₹219.75), and 200-day (₹193.20) moving averages, indicating bullish momentum across short, medium, and long-term timeframes.
- Momentum indicators show RSI near overbought levels around 70, MACD is positive with a bullish crossover, and Stochastic oscillators confirm upward momentum.
- Multi-timeframe analysis reveals consistent strength on daily, weekly, and monthly charts, supporting sustained positive price trends.
- Potential market scenarios include continuation of the upward trend if support levels hold, or consolidation near resistance before any directional change.
Trending News
1. Headline: Stay Informed with MarketsMojo News: Stock Market Insights, Portfolio Tracking, Alerts, and Expert Analyses
Summary: Latest news on Stocks in Action, Trending Stocks, Stock Analysis, Result Analysis, Corporate News, Stock Market News, IPOs, Mutual Funds, Global Markets, and Investment Ideas at MarketsMojo. Enhance your financial decisions with insightful stock market analysis, seamless portfolio tracking, ...
Sentiment: neutral
2. Headline: When is the next results date for Aeroflex Industries Ltd?
Summary: Aeroflex Industries Ltd Surges 7.33% to Day's High of Rs 321 — Outperforms Sector by 7 Percentage Points ... US Fed Meeting 2026 LIVE: US stocks end mixed after Powell's speech, Fed move to hold rate for 3rd straight meeting - Mint
Sentiment: positive
3. Headline: Aeroflex Industries Set for May 6 Earnings Call on Q4, FY26 Results | Whalesbook Corporate News
Summary: Aeroflex Industries Ltd announced its analyst and investor call for May 6, 2026. The virtual event will focus on Q4 and full fiscal year 2026 performance, offering investors a key chance to understand the company's financial results and strategic outlook. ... Select the stocks you want to track ...
Sentiment: neutral
4. Headline: Aeroflex Industries Ltd Surges 7.32% to Day's High of Rs 297.8 — Outperforms Sector by 5 Percentage Points
Summary: The Sensex advanced 0.85% on 27 Apr 2026, yet Aeroflex Industries Ltd outpaced the broader market with a 7.32% gain, reaching an intraday high of Rs 297.8. This 5.22-percentage-point outperformance over its sector peers in Iron & Steel Products signals a distinctly stock-specific momentum shift ...
Sentiment: positive
5. Headline: Stock Market Today: All You Need To Know Before Going Into Trade On April 27
Summary: Stocks in the news, big brokerage calls of the day, complete trade setup and much more!
Sentiment: neutral
Recent Updates
News Summary
As of May 6, 2026. Aeroflex Industries Ltd has scheduled an analyst and investor call to discuss its Q4 and full fiscal year 2026 financial results, providing stakeholders with detailed insights into recent operational and financial performance. The company also filed its quarterly compliance certificate for the period ending March 31, 2026, in accordance with SEBI regulations, confirming no shareholder dematerialisation requests during the quarter. These developments underscore Aeroflex's commitment to transparency, regulatory adherence, and proactive investor communication.
News Sentiment
The overall sentiment from recent updates is neutral to positive, driven by the company’s adherence to regulatory requirements and the upcoming earnings call that offers clarity on financial performance. The absence of dematerialisation requests suggests stable shareholder engagement, while the scheduled earnings discussion reflects openness to market scrutiny. This balanced tone indicates steady operational management without significant new risks or catalysts.
Source List
- https://whalesbook.com/corporate-news/English/industrial-goodsservices/Aeroflex-Industries-Set-for-May-6-Earnings-Call-on-Q4-FY26-Results/69ef65135a43f6b807c225e0
- https://www.whalesbook.com/corporate-news/English/industrial-goodsservices/Aeroflex-Industries-Files-Q4-FY26-Compliance-No-Demat-Requests/69d09f4969ec081354e66fa8
Analytical Overview
Analysis Summary
Aeroflex Industries Ltd’s valuation metrics, including a trailing P/E of 68.66 and forward P/E of 37.47, are elevated compared to the industry average P/E of 68.66, reflecting market expectations for growth but also indicating premium pricing. The company’s revenue growth of 21.1% quarter-over-quarter and positive cash flow trends, with operating cash flow of INR 300 million and free cash flow of INR 525 million, suggest a strong growth trajectory supported by solid operational cash generation. Financial health appears robust, with a current ratio of 2.91 and low total debt of INR 92.99 million against cash reserves of INR 285 million, indicating manageable leverage and liquidity. Sector-specific challenges include competitive pressures in metal fabrication and sensitivity to industrial demand cycles, while opportunities arise from increasing demand in aerospace and energy sectors. Considering the Indian regulatory environment and economic outlook, Aeroflex benefits from a growing industrial base and infrastructure development, which may support sustained demand for its products.
Overall Business and Market Assessment
Supporting Factors: No data
Risk Factors: No data
SWOT Analysis
Strengths
- Aeroflex Industries maintains strong profitability with a net margin of 12.05%.
- The company has a solid balance sheet with low debt and a current ratio of 2.91.
- Consistent revenue growth of 21.1% quarter-over-quarter demonstrates market demand.
- Strong return on equity at 15.33% indicates effective capital management.
Weaknesses
- High valuation multiples such as P/E of 68.66 and P/B of 9.40 may limit upside.
- Limited institutional ownership at 2.24% suggests lower external investor confidence.
- Price to cash flow ratio is elevated at 121.00, indicating premium pricing relative to cash generation.
- Dependence on cyclical industrial sectors exposes the company to demand fluctuations.
Opportunities
- Growing demand in aerospace, defense, and energy sectors supports product expansion.
- Increasing infrastructure development in India offers market growth potential.
- Technological innovation in flexible flow solutions can differentiate offerings.
- Potential to expand international market presence through strategic partnerships.
Threats
- Competitive pressures within metal fabrication may impact market share.
- Regulatory changes in industrial manufacturing could increase compliance costs.
- Macroeconomic volatility may affect industrial capital expenditure cycles.
- Raw material price fluctuations could pressure margins.
Company Description
Aeroflex Industries Ltd. is a prominent player in the manufacturing sector, specializing in the production of flexible flow solutions including hoses, fittings, and expansion joints. These products are crucial for fluid and gas transfer in various high-tech systems, serving a broad range of industries such as aerospace, defense, automotive, and energy. The company's offerings ensure durability and reliability, particularly in environments where thermal expansion or high pressure may challenge conventional systems. Aeroflex Industries focuses on quality and technological innovation, striving to meet the rigorous standards required by its diverse client base. With a commitment to sustainability and efficiency, the company supports the growing global demand for advanced flexible systems. Its strategic impact in crucial sectors underlines its significance in both domestic and international markets, enhancing operational efficiencies and safety standards across numerous applications. Aeroflex Industries establishes itself as a vital contributor to infrastructural integrity and technological advancement.