


Aeroflex Enterprises Limited (AEROENTER)
Stock Analysis Report
My Notes
Approach with cuation.
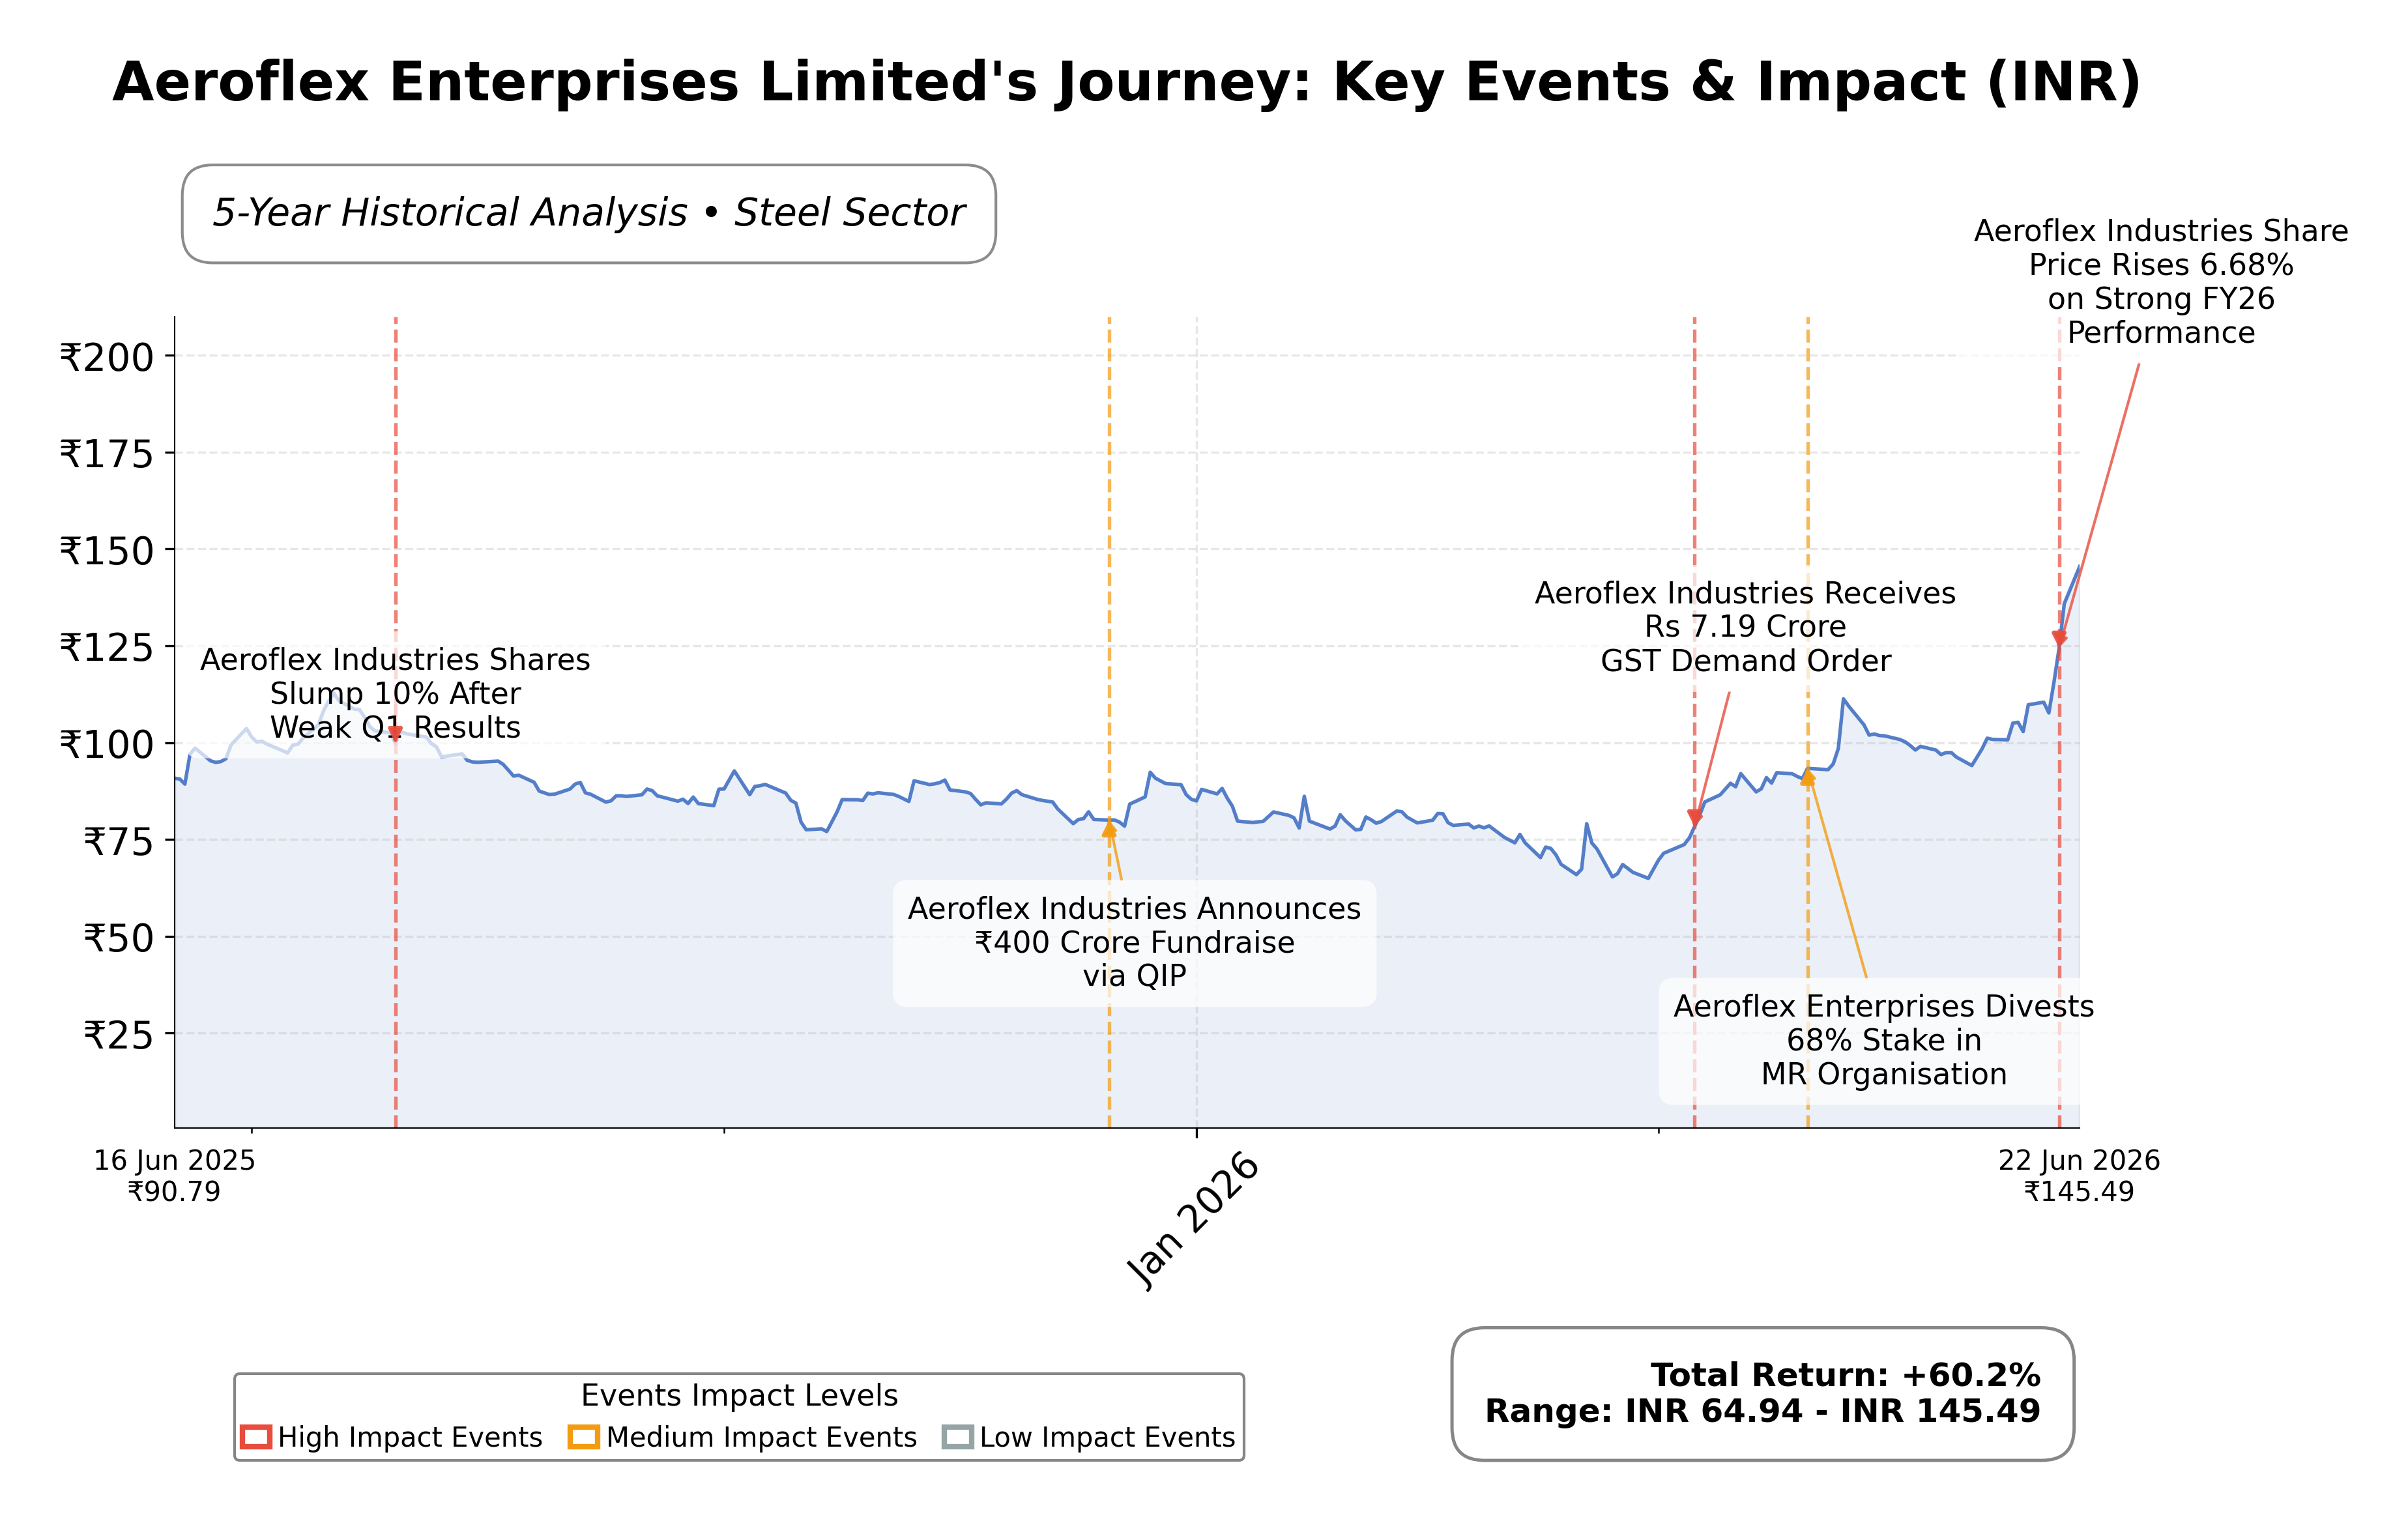
Stock Journey
Key Positives and Key Risks
Pros
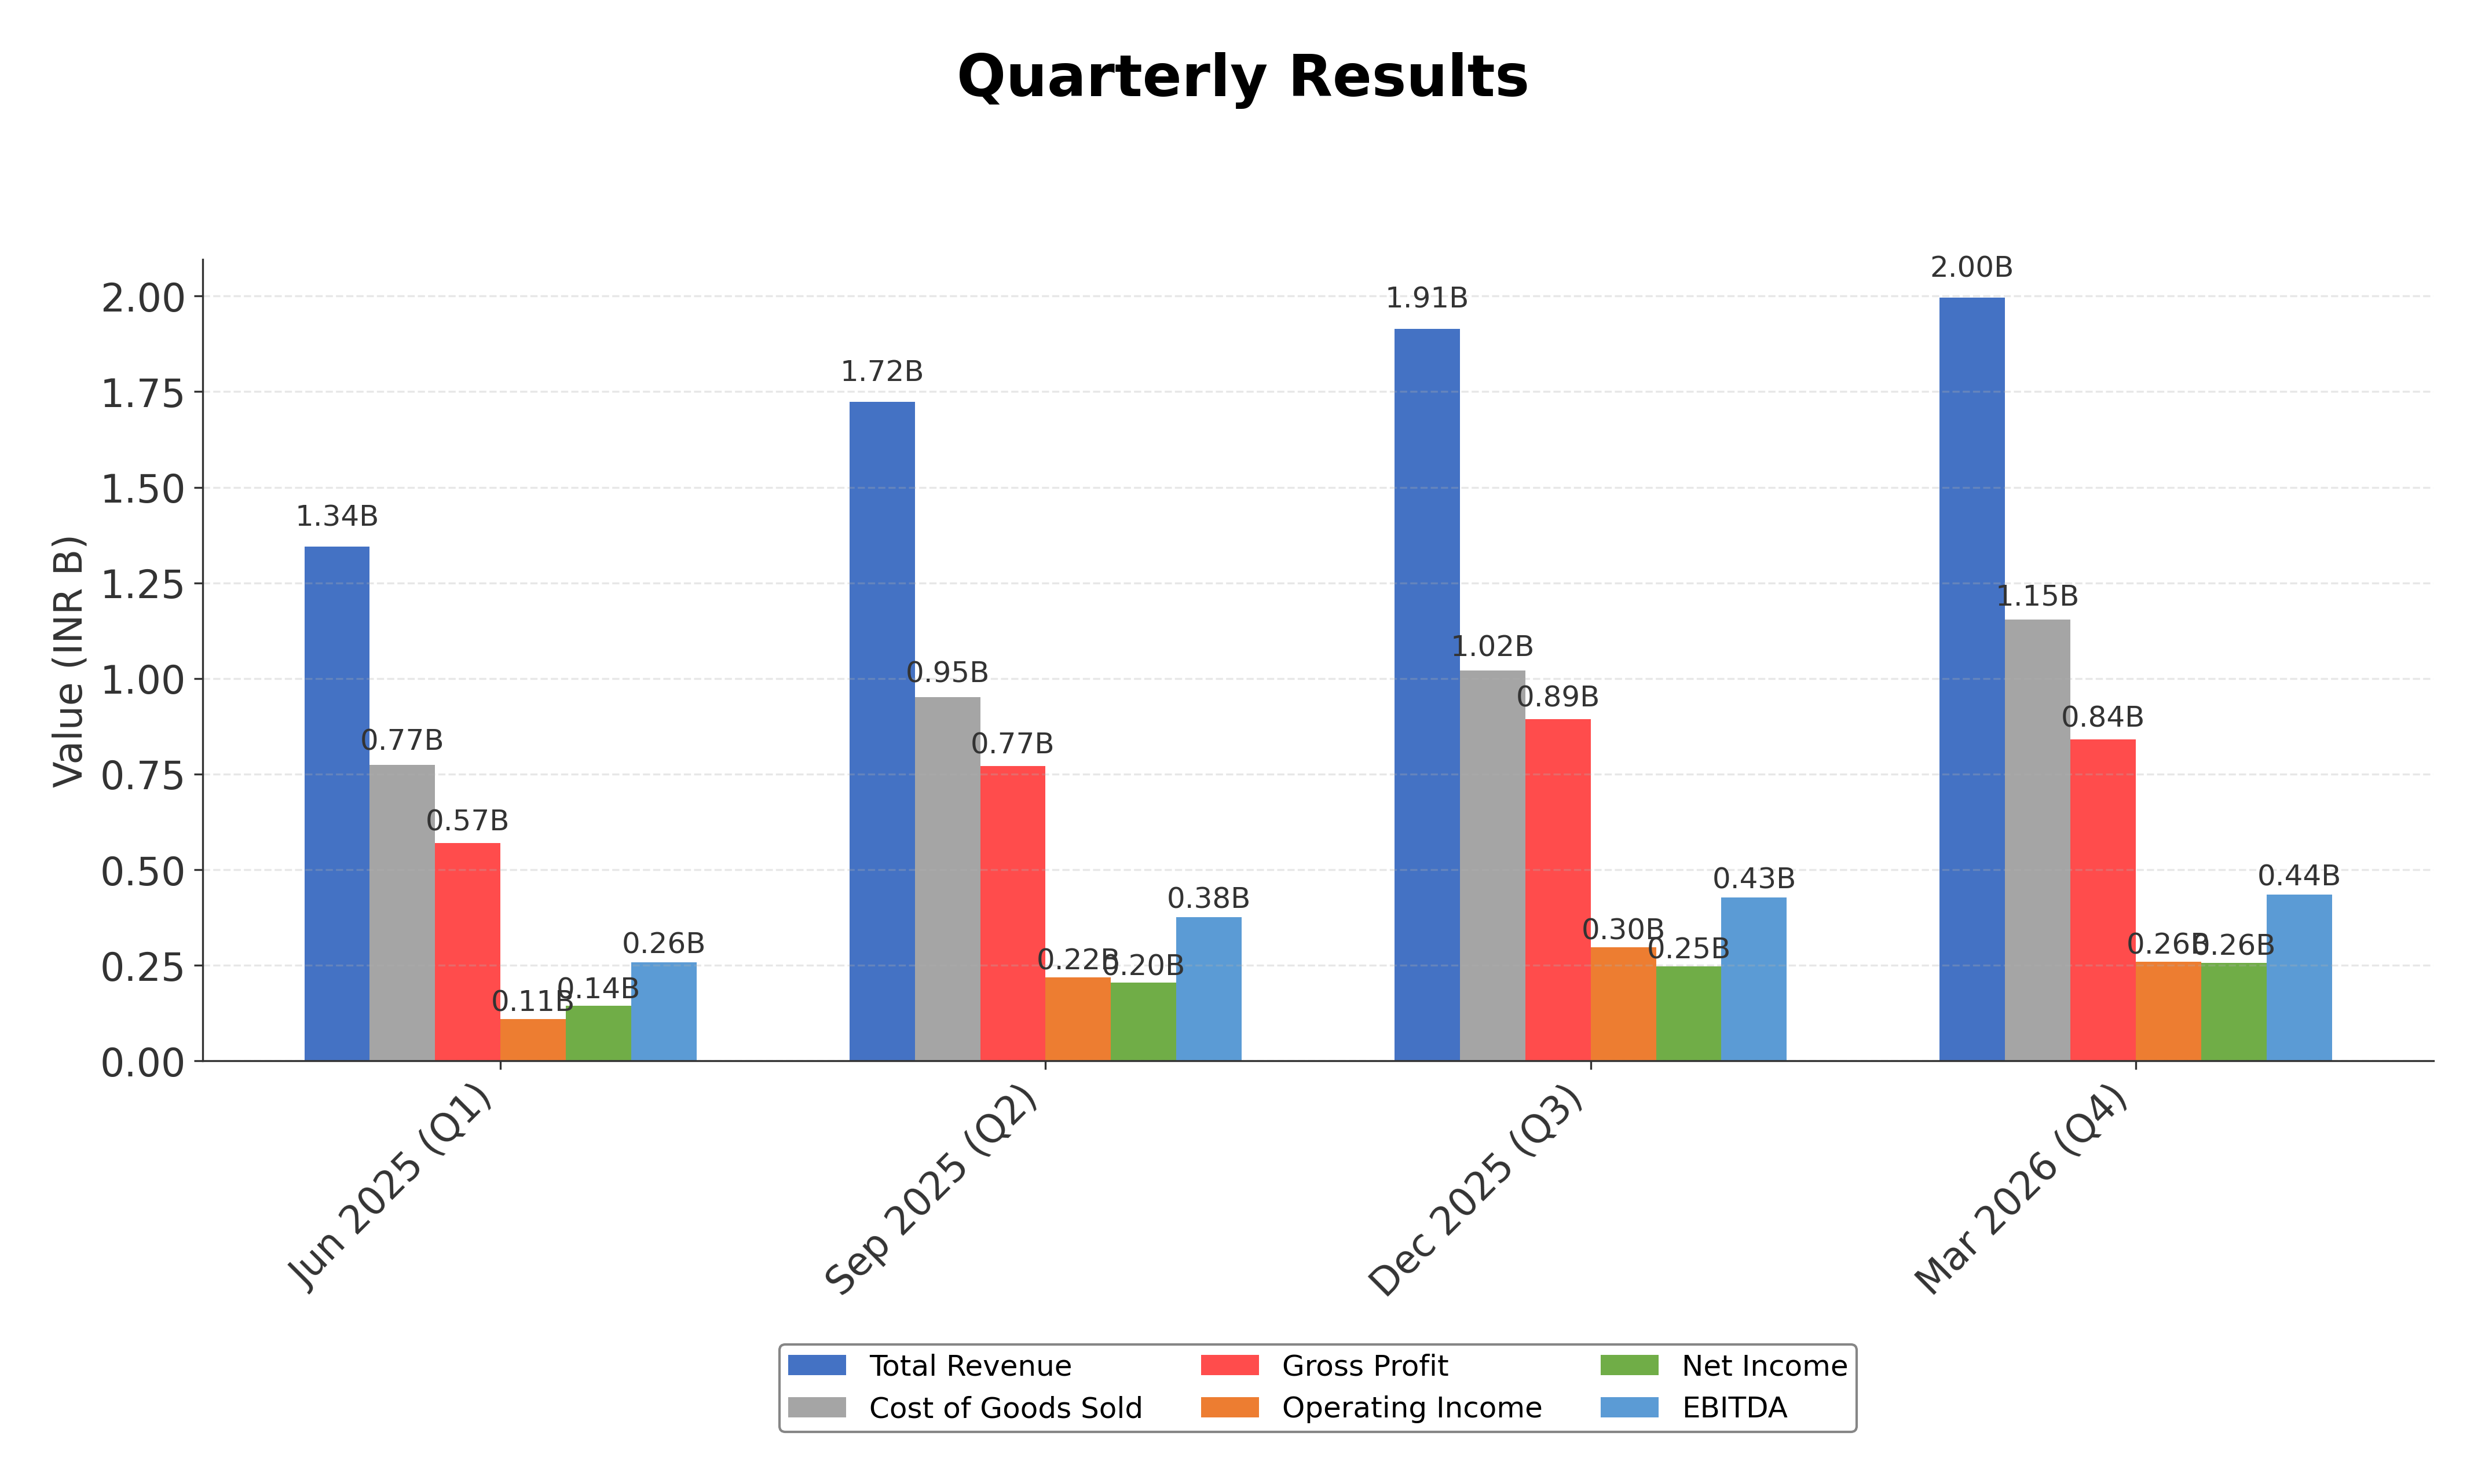
- Revenue growth of 16% quarter-over-quarter indicates strong operational expansion.
- Low total debt to equity ratio of 0.42 suggests conservative financial leverage.
- Promoter group increased stake to 6.84%, reflecting confidence in company prospects.
Cons
- Negative levered free cash flow of approximately ₹691 million highlights cash flow challenges.
- High price to cash flow from operations ratio at 89.60 may indicate overvaluation on cash flow basis.
- Limited institutional investor presence may restrict access to additional capital.
Disclosure: This information is for general awareness and does not constitute investment advice
Report Summary
Aeroflex Enterprises Limited operates primarily in the steel sector under the Basic Materials industry, listed on the NSE exchange in India. The company specializes in manufacturing and selling stainless-steel flexible hoses and assemblies, along with flexible packaging products and related engineering services. Its operations span multiple geographies including India, the Middle East, Europe, Asia, Africa, the Americas, and Australia, positioning it as a diversified player in the flexible metal hose and packaging market segments.
Financially, Aeroflex reported trailing twelve months (TTM) revenue of approximately INR 7.26 billion with a gross margin of 42.16%, indicating efficient production and cost management. The operating margin stands at 16.25%, while the net profit margin is 8.85%, reflecting moderate profitability. Return on equity (ROE) and return on assets (ROA) are 9.56% and 6.85% respectively, suggesting reasonable returns relative to shareholder equity and asset base. The company’s return on invested capital (ROIC) is consistent with these figures, underscoring operational efficiency.
From a valuation perspective, Aeroflex’s trailing price-to-earnings (P/E) ratio is 23.69, aligning closely with the industry average P/E of 23.69. The price-to-book (P/B) ratio is 1.84, and the enterprise value to EBITDA (EV/EBITDA) multiple is 10.48, indicating a valuation that is reasonable relative to earnings and book value. The stock is currently trading near its 52-week high of INR 149.55, at INR 141.39, representing an upside potential of approximately 5.7% to the high. Market capitalization stands at INR 16.40 billion, reflecting a mid-cap status within the Indian steel sector.
Key strengths include a strong current ratio of 4.25, indicating solid liquidity, and a low total debt to equity ratio of 0.42, suggesting a conservative leverage profile. The promoter group has recently increased its stake to 6.84%, signaling confidence in the company’s prospects. Risks include exposure to commodity price volatility inherent in the steel industry, competitive pressures, and potential regulatory challenges in multiple jurisdictions. Recent strategic actions include granting employee stock options and re-appointing auditors, which support governance and employee retention.
Technically, the stock is trading above its 50-day and 200-day moving averages, with a beta of 1.39 indicating moderate volatility relative to the market. Momentum indicators show mixed signals across timeframes, with the price near resistance levels around INR 149. The current trajectory suggests a phase of consolidation with potential for further price discovery. Overall, the data indicates a balanced environment where market participants may consider monitoring developments closely.
Company and Industry Overview
Company Basics
Price Performance
Company Size
Shareholding Pattern
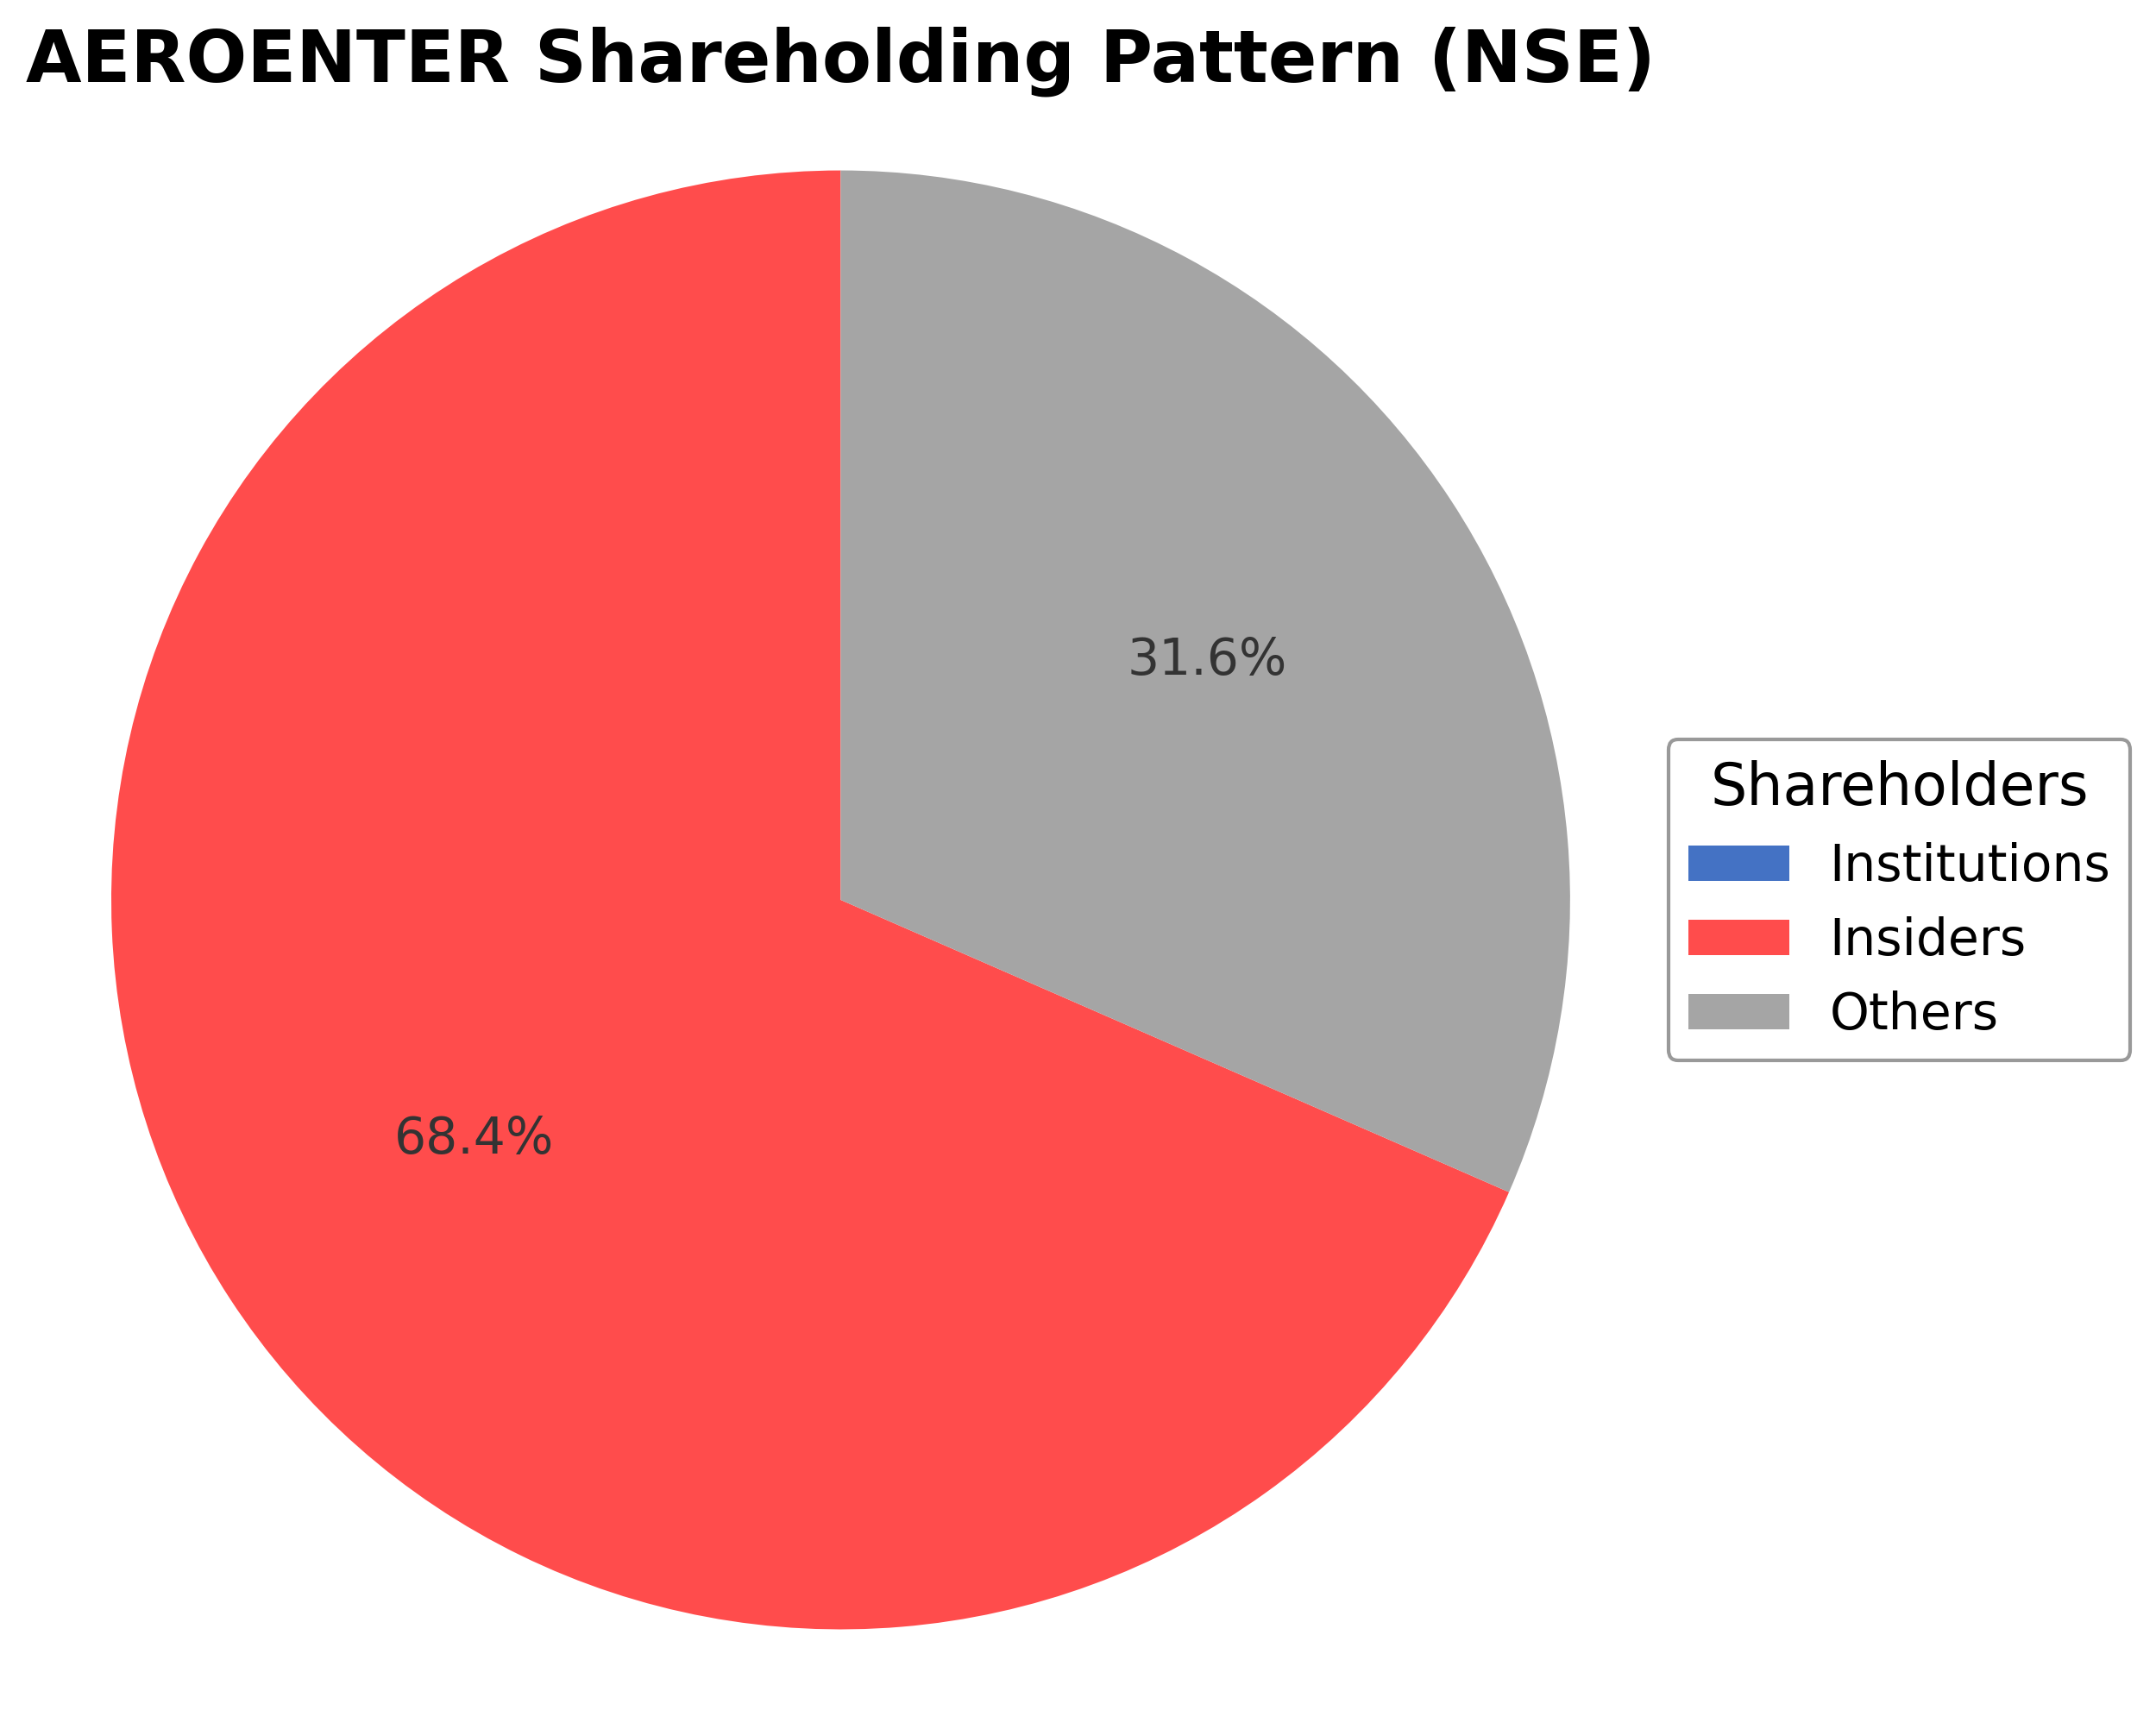
Aeroflex Enterprises Limited's ownership structure is characterized by a promoter holding of 6.84%, reflecting recent incremental acquisitions by the promoter group through open market purchases. Institutional investors currently hold no reported stake, while the public and other shareholders constitute approximately 93.16% of the equity. Over the past 12-24 months, the promoter group has modestly increased their position, indicating growing confidence. The absence of institutional holdings suggests limited institutional accumulation or distribution trends. This shareholding pattern implies a governance framework dominated by public shareholders with a relatively small but active promoter presence, which may influence strategic decisions and corporate actions in a balanced manner.
Sector and Industry Analysis
The industrial components sector, particularly focusing on thermal management and aerospace-related products, has witnessed steady growth driven by expanding data centers and defense spending globally. Market size is bolstered by increasing demand for high-performance cooling solutions and precision components across aerospace, defense, and industrial applications. Key players include established multinational corporations like Parker-Hannifin, which dominate due to scale and regulatory certifications, alongside emerging firms such as Aeroflex Enterprises Limited, which is expanding its export footprint.
Industry trends highlight a shift towards advanced thermal management technologies and diversification into high-value sectors like data centers, where performance and reliability are critical. Competitive dynamics are shaped by moderate switching costs and significant barriers to entry, including regulatory approvals and certifications, which favor incumbents with established global presence. Aeroflex, while strong domestically and growing its export share, faces challenges in scaling and gaining global recognition compared to larger peers with broader regulatory clearances.
The regulatory landscape is stringent, particularly in aerospace and defense sectors, where compliance with international standards and certifications is mandatory, creating high entry barriers. Companies must navigate complex approval processes to participate in these markets, impacting product development timelines and market access. Looking ahead, regulatory requirements are expected to tighten further, emphasizing quality, safety, and environmental standards, which will influence competitive positioning and innovation within the sector.
Note: Analysis synthesized from industry research, market reports, and regulatory filings. Information is subject to change based on market conditions.
Financial Ratios Dashboard
Illustrative Scenario Analysis
DCF Assumptions:
Method: Two-Stage EPS-Priority Model
Financials
Peer Analysis
| Company Name | Market Cap | P/E Ratio | P/B Ratio | EV/EBITDA | Price to CFO |
|---|---|---|---|---|---|
| Aeroflex Enterprises Limited | ₹16.40B | 23.69 | 1.84 | 10.48 | 89.60 |
| Jindal Steel & Power Ltd. | ₹1.17T | 34.72 | 2.30 | 13.89 | 16.23 |
| Usha Martin Ltd. | ₹150.66B | 30.22 | 4.49 | 20.67 | 22.99 |
| Jindal Saw Ltd. | ₹157.05B | 16.25 | 1.26 | 8.83 | 8.87 |
| Nmdc Steel Ltd. | ₹140.23B | 236.20 | 1.05 | 11.61 | 7.81 |
| Nmdc Limited | ₹777.81B | 10.71 | 2.34 | 8.08 | 15.57 |
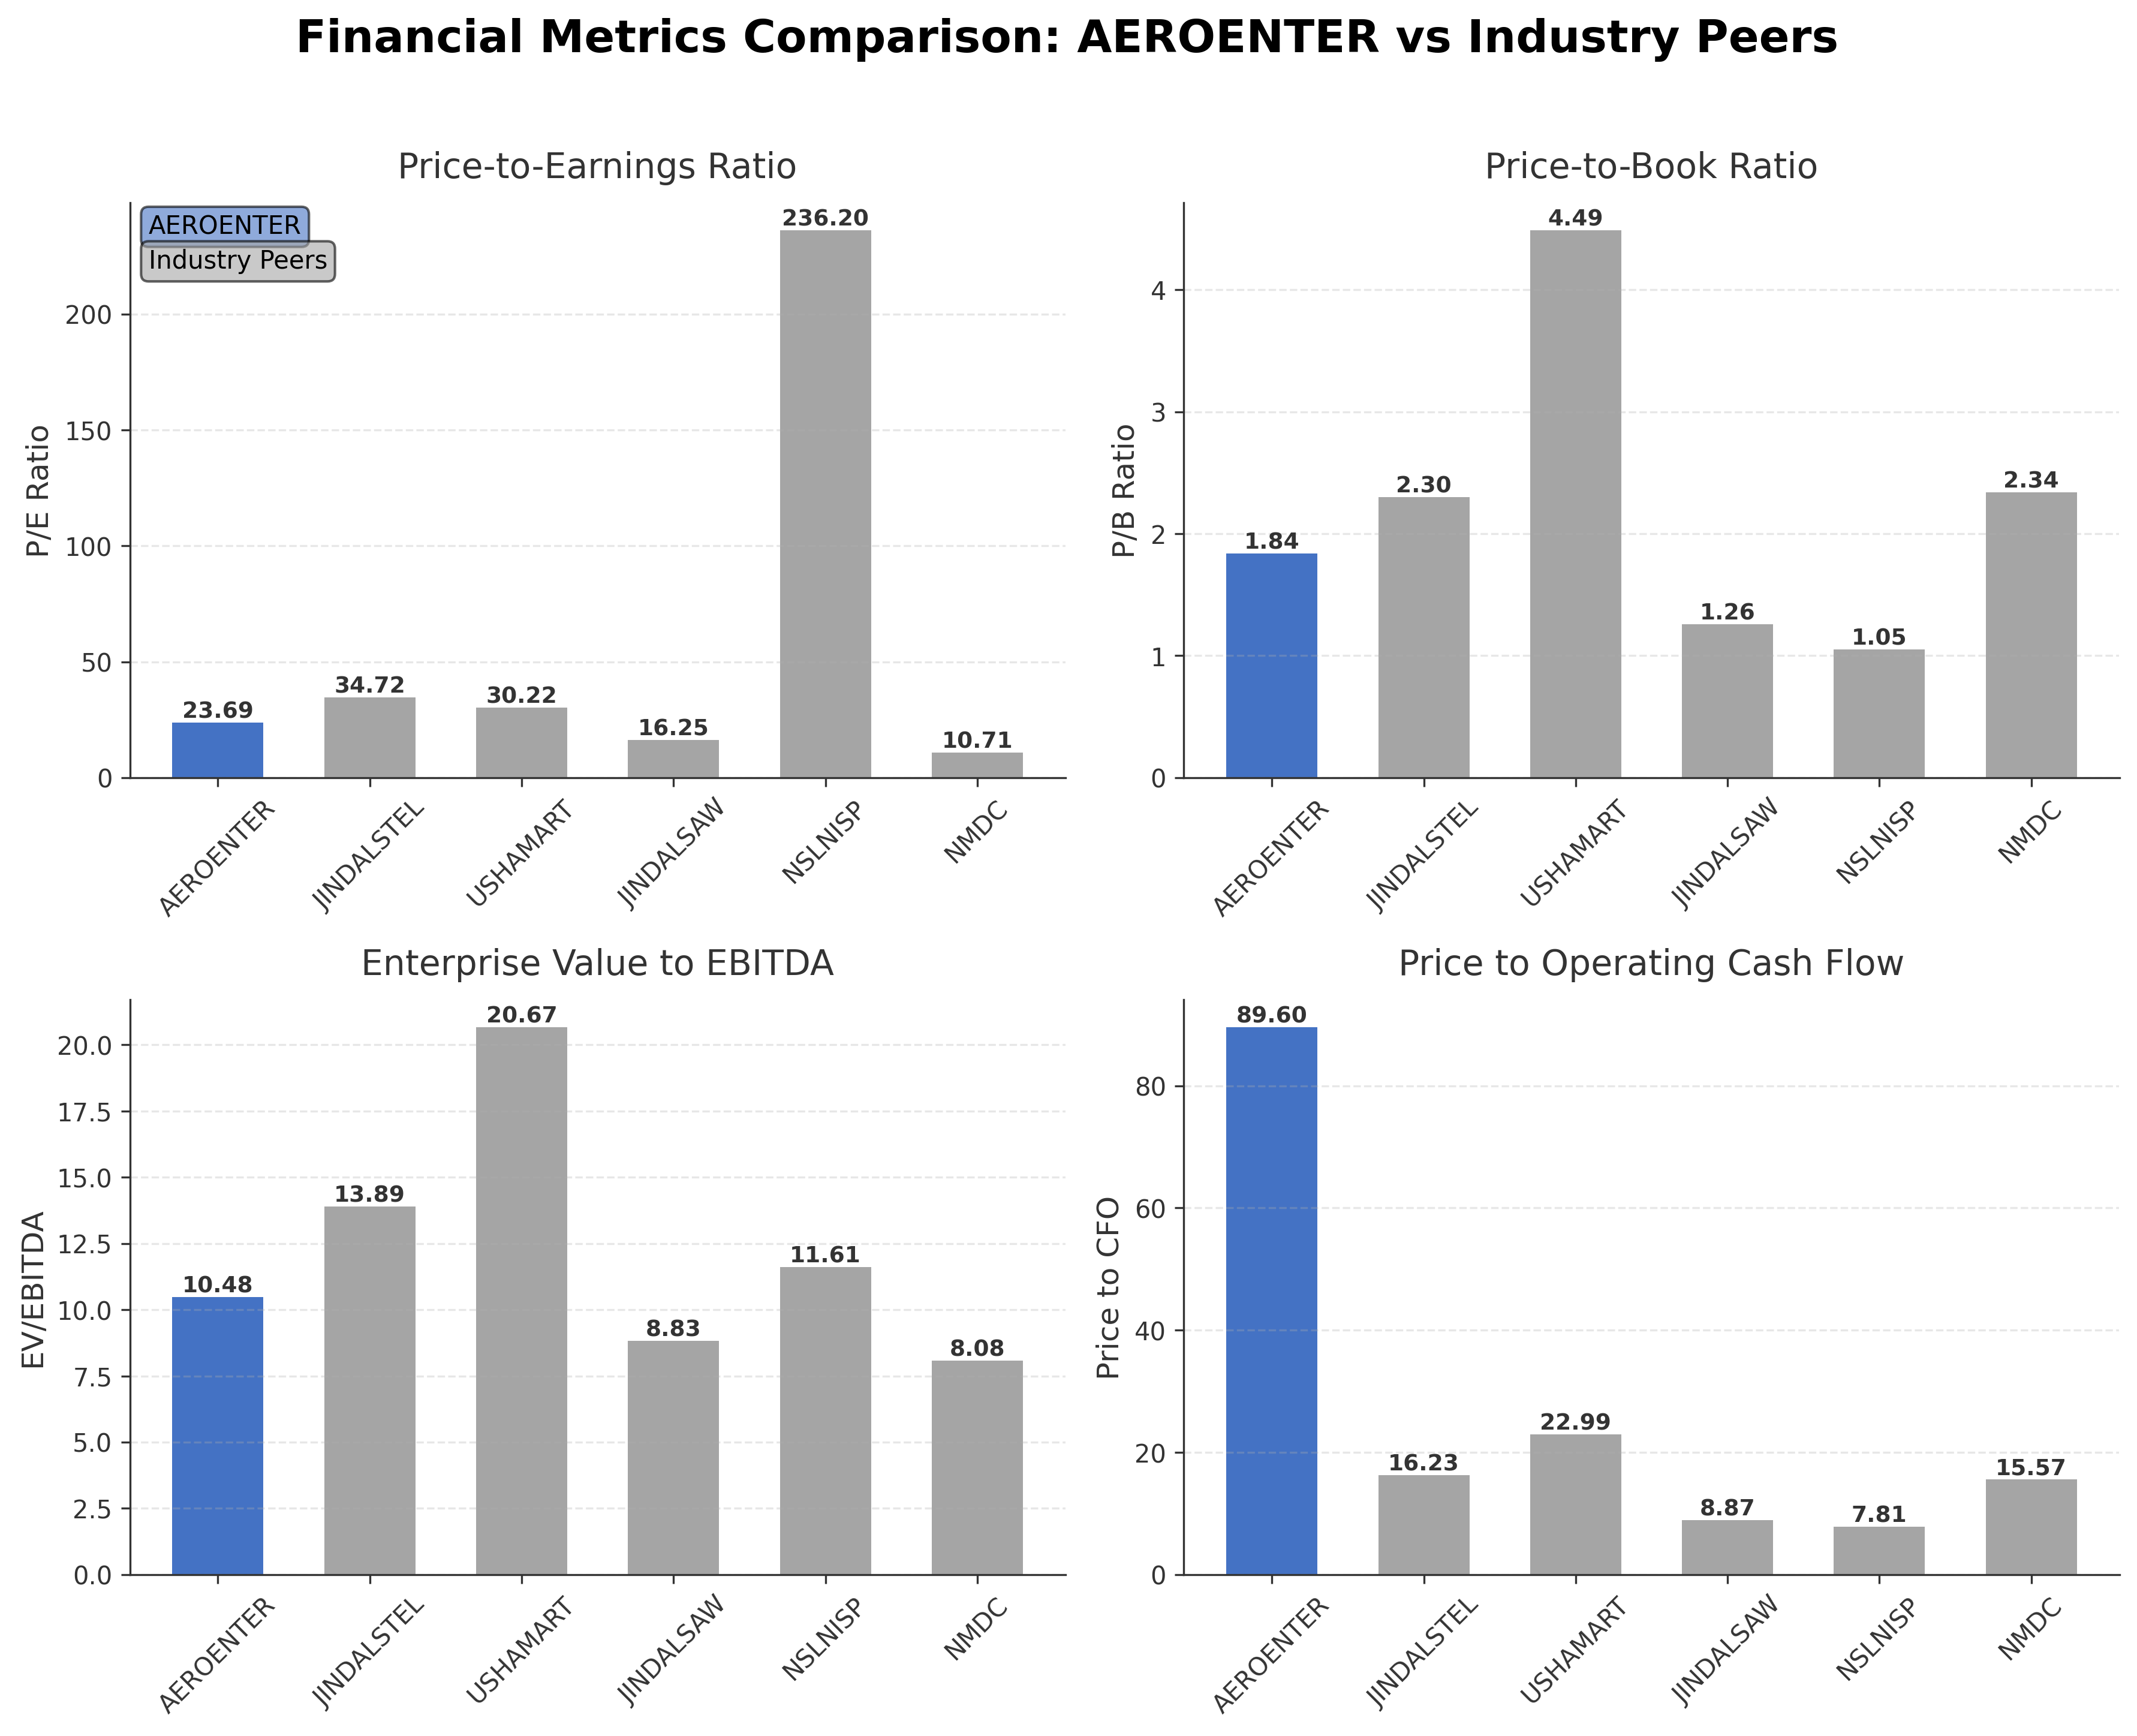
Comparison Analysis: Aeroflex Enterprises Limited exhibits a moderate valuation profile relative to its Indian steel industry peers, with a trailing P/E of 23.69 closely matching the sector average. Its P/B ratio of 1.84 is lower than several peers such as Usha Martin Ltd. (4.49) but higher than Jindal Saw Ltd. (1.26). The EV/EBITDA multiple of 10.48 positions Aeroflex between higher-valued peers like Usha Martin Ltd. (20.67) and more value-oriented companies like NMDC (8.08). Return on equity at 9.56% is respectable but below high performers like NMDC (23.36%) and Usha Martin (16.23%). Price to CFO is notably elevated at 89.60, indicating potential cash flow valuation considerations. Overall, Aeroflex maintains a balanced stance with moderate profitability and valuation metrics compared to larger and more diversified competitors.
Financial Metrics Comparison with Peers
Financial Statements
Comprehensive financial data including income, balance sheet, and cash flow metrics
Income Statement
| fiscal_date | 2026-03-31 | 2025-03-31 |
|---|---|---|
| Sales | 6.98B | 5.74B |
| Cost Of Goods | 3.90B | 3.37B |
| Gross Profit | 3.08B | 2.37B |
| Operating Expense Other Operating Expenses | 1.13B | 473.01M |
| Operating Income | 885.82M | 909.35M |
| Non Operating Interest Expense | 52.56M | 54.17M |
| Pretax Income | 1.11B | 1.09B |
| Income Tax | 253.05M | 282.37M |
| Net Income | 853.31M | 807.32M |
| Ebit | 1.16B | 1.14B |
| Ebitda | 1.50B | 1.29B |
| Net Income Continuous Operations | 1.11B | 1.09B |
| Minority Interests | -211.07M | -276.12M |
| Preferred Stock Dividends | 0.00 | 0.00 |
| Operating Expense Selling General And Administrative | N/A | 284.55M |
| Non Operating Interest Income | N/A | 154.17M |
| Eps Basic | N/A | 7.14 |
| Eps Diluted | N/A | 7.14 |
| Basic Shares Outstanding | N/A | 113.08M |
| Diluted Shares Outstanding | N/A | 113.08M |
Data provided by Twelve Data
Balance Sheet
| fiscal_date | 2026-03-31 | 2025-03-31 |
|---|---|---|
| Cash And Cash Equivalents | 504.25M | 433.32M |
| Accounts Receivable | 2.14B | 1.90B |
| Total Assets | 11.56B | 9.75B |
| Total Liabilities | 1.93B | 1.52B |
| Long Term Debt | 137.27M | 59.96M |
| Shareholders Equity | 9.62B | 8.23B |
Data provided by Twelve Data
Cash Flow Statement
| fiscal_date | 2026-03-31 | 2025-03-31 |
|---|---|---|
| Operating Activities Net Income | 1.11B | 1.09B |
| Operating Activities Stock Based Compensation | 6.56M | N/A |
| Operating Activities Other Non Cash Items | -38.38M | -100.68M |
| Operating Activities Accounts Receivable | -894.99M | -317.60M |
| Operating Activities Other Assets Liabilities | -420.71M | 812.55M |
| Operating Activities Operating Cash Flow | -241.15M | 1.48B |
| Investing Activities Capital Expenditures | -780.12M | -969.14M |
| Investing Activities Net Intangibles | -5.00M | -7.70M |
| Investing Activities Purchase Of Investments | -66.87M | -27.04M |
| Investing Activities Sale Of Investments | 546.59M | 24.16M |
| Investing Activities Investing Cash Flow | -300.40M | -972.02M |
| Financing Activities Long Term Debt Issuance | 41.43M | 13.33M |
| Financing Activities Long Term Debt Payments | -48.03M | -352.82M |
| Financing Activities Common Stock Issuance | 631.00M | N/A |
| Financing Activities Common Dividends | -62.82M | -27.62M |
| Financing Activities Other Financing Charges | -329.01M | -567.41M |
| Financing Activities Financing Cash Flow | 232.57M | -934.51M |
| End Cash Position | 504.25M | 438.66M |
| Free Cash Flow | -610.46M | 352.24M |
Data provided by Twelve Data
Technical Analysis
Key Insights
- The current trend shows Aeroflex Enterprises trading in an upward channel with price action nearing the 52-week high of ₹149.55, indicating bullish momentum but potential resistance ahead.
- Key support levels are identified near ₹130 and ₹115, while resistance is observed at ₹149.55, the recent high.
- The stock price is above the 10-day (approx. ₹141), 50-day (₹99.21), and 200-day (₹85.84) moving averages, suggesting a strong upward trend across short to long-term timeframes.
- Momentum indicators show the RSI approaching overbought territory near 70, MACD remains positive but with signs of convergence, and stochastic oscillators indicate potential short-term consolidation.
- Across daily, weekly, and monthly charts, the stock maintains an overall bullish structure, though weekly momentum suggests caution due to proximity to resistance.
- Potential market scenarios include a breakout above ₹149.55 leading to new highs or a pullback to support levels around ₹130 if profit-taking intensifies.
Trending News
1. Headline: Flex Gains as S&P 500 Addition and AI Infrastructure Strategy Lift Sentiment | FLEX Stock News
Summary: Flex Ltd. (FLEX) is up 6.0% today. Here is some analysis on what might have caused this price movement.Analysis: The most likely driver is Flex’s addition to the S&P 500, which became effective before the open on June 22, 2026 and can trigger buying from index funds and other benchmark-linked ...
Sentiment: positive
2. Headline: AeroVironment stock hits 52-week low at 155.86 USD By Investing.com
Summary: AeroVironment stock hits 52-week low at 155.86 USD
Sentiment: negative
3. Headline: Why is AeroVironment stock sliding today? By Investing.com
Summary: Gold rebounds as Iran-U.S. talks and oil price drop boost sentiment · Nasdaq falls, S&P turns red while Dow holds gains as traders look for direction
Sentiment: negative
Summary: Azad Eng Share Price: Find the latest news on Azad Eng Stock Price. Get all the information on Azad Eng with historic price charts for NSE / BSE. Experts & Broker view also get the Azad Eng Ltd. buy/sell tips detailed news, announcements, Forecasts, Analysts, Valuation, Earning forecasts, ...
Sentiment: neutral
5. Headline: Aeroflex Industries grants 9,500 ESOPs at ₹180
Summary: Aeroflex Industries Limited granted 9,500 Employee Stock Options at ₹180 per share and re-appointed statutory auditors M/s. Shweta Jain & Co. LLP for a five-year term. The Board also appointed internal and cost auditors for FY27 and promoted five employees to Senior Management roles.
Sentiment: neutral
Powered by Brave
Recent Updates
News Summary
As of June 5, 2026. Aeroflex Enterprises Limited's promoter group, A Flex Invest Private Limited, increased its stake to 6.84% by acquiring 233,500 shares in early June 2026, reflecting enhanced promoter confidence. The company disclosed its promoter shareholding for fiscal year 2026, reporting 79,181,833 equity shares held, providing transparency and regulatory compliance. Additionally, Aeroflex granted 9,500 Employee Stock Options at ₹180 per share, re-appointed statutory auditors for a five-year term, and promoted five employees to senior management roles, indicating a focus on governance and talent retention. These developments collectively underscore strategic shareholder engagement and internal strengthening initiatives.
News Sentiment
The overall sentiment from recent updates is neutral to mildly positive, driven primarily by promoter stake increases and governance enhancements such as ESOP grants and auditor re-appointments. No significant negative events or regulatory challenges were reported, and transparency in shareholding disclosures supports investor confidence. The 5% share price decline noted in external commentary contrasts with these positive governance signals, suggesting market volatility rather than fundamental weakness. Overall, the news reflects steady corporate stewardship with measured promoter involvement and organizational development.
Source List
- https://scanx.trade/stock-market-news/companies/a-flex-invest-increases-stake-in-aeroflex-enterprises-to-6-84/42275762
- https://scanx.trade/stock-market-news/companies/aeroflex-industries-discloses-promoter-shareholding-for-fy26/42266195
- https://scanx.trade/stock-market-news/companies/aeroflex-industries-grants-9-500-esops-and-re-appoints-auditors/43342368
Analytical Overview
Analysis Summary
Aeroflex Enterprises' trailing P/E ratio of 23.69 aligns closely with the steel industry average, indicating fair valuation relative to earnings. Forward P/E is not available, limiting forward-looking valuation assessment. Revenue growth of 16% quarter-over-quarter and positive earnings growth of 116% year-over-year demonstrate a strong growth trajectory supported by operational expansion. However, the company’s levered free cash flow is negative at approximately -₹691 million, suggesting cash flow constraints despite positive operating cash flow. The debt-to-equity ratio is low at 0.42, indicating a conservative capital structure and manageable financial risk. Sector-specific challenges include commodity price volatility and competitive pressures in the steel and flexible packaging markets. Considering the Indian regulatory environment, the company benefits from stable governance practices and promoter confidence, though macroeconomic factors such as raw material costs and export demand remain relevant.
Overall Business and Market Assessment
Supporting Factors: No data
Risk Factors: negative free cash flow and sectoral commodity price fluctuations that may impact profitability
SWOT Analysis
Strengths
- Strong liquidity position with a current ratio of 4.25.
- Low debt-to-equity ratio of 0.42 indicating conservative leverage.
- Diverse product portfolio serving multiple geographies and industries.
- Promoter group increasing stake, signaling confidence in prospects.
Weaknesses
- Negative levered free cash flow of approximately ₹691 million.
- High price to cash flow from operations ratio at 89.60.
- Limited institutional investor presence reducing potential capital inflows.
- Profit margin of 8.85% is moderate compared to some peers.
Opportunities
- Expansion in international markets including Europe and the Americas.
- Growing demand for stainless steel flexible hoses and packaging solutions.
- Potential for operational efficiencies to improve cash flow generation.
- Employee stock option grants may enhance talent retention and motivation.
Threats
- Volatility in raw material and commodity prices impacting costs.
- Competitive pressures from larger steel and flexible packaging companies.
- Regulatory changes in multiple jurisdictions affecting operations.
- Market volatility reflected in recent share price fluctuations.
Company Description
Aeroflex Enterprises Limited, together with its subsidiaries, manufactures and sells stainless-steel flexible hoses and assemblies in India, the Middle East, Europe, Asia, Africa, the United States, Latin and Central America, the Caribbean Islands, Australia, and North America. It offers corrugated stainless steel, double interlock flexible metal, and composite hoses, as well as stainless steel hose assemblies. The company also manufactures and sells flexible intermediate bulk containers, polypropylene (PP), high-density polyethylene (HDPE) bags, and BOPP laminated bags, as well as PP/HDPE woven fabrics and stainless steel wire rods; and offers hydraulic fittings, fluid connectors, flanges, valves, and couplings. In addition, it engages in the business of international and domestic trading, investment and finance, leasing of assets, and manufacture and sale of flexible packaging, as well as provides engineering, aftermarket, and replacement services; and equivalent compressor spare parts. It serves agro pesticides, basic drug, cattle feed, cement, and other industries. The company was formerly known as Sat Industries Limited and changed its name to Aeroflex Enterprises Limited in May 2025. Aeroflex Enterprises Limited was incorporated in 1984 and is headquartered in Mumbai, India.