
Ador Welding Ltd (AWL)
Stock Analysis Report
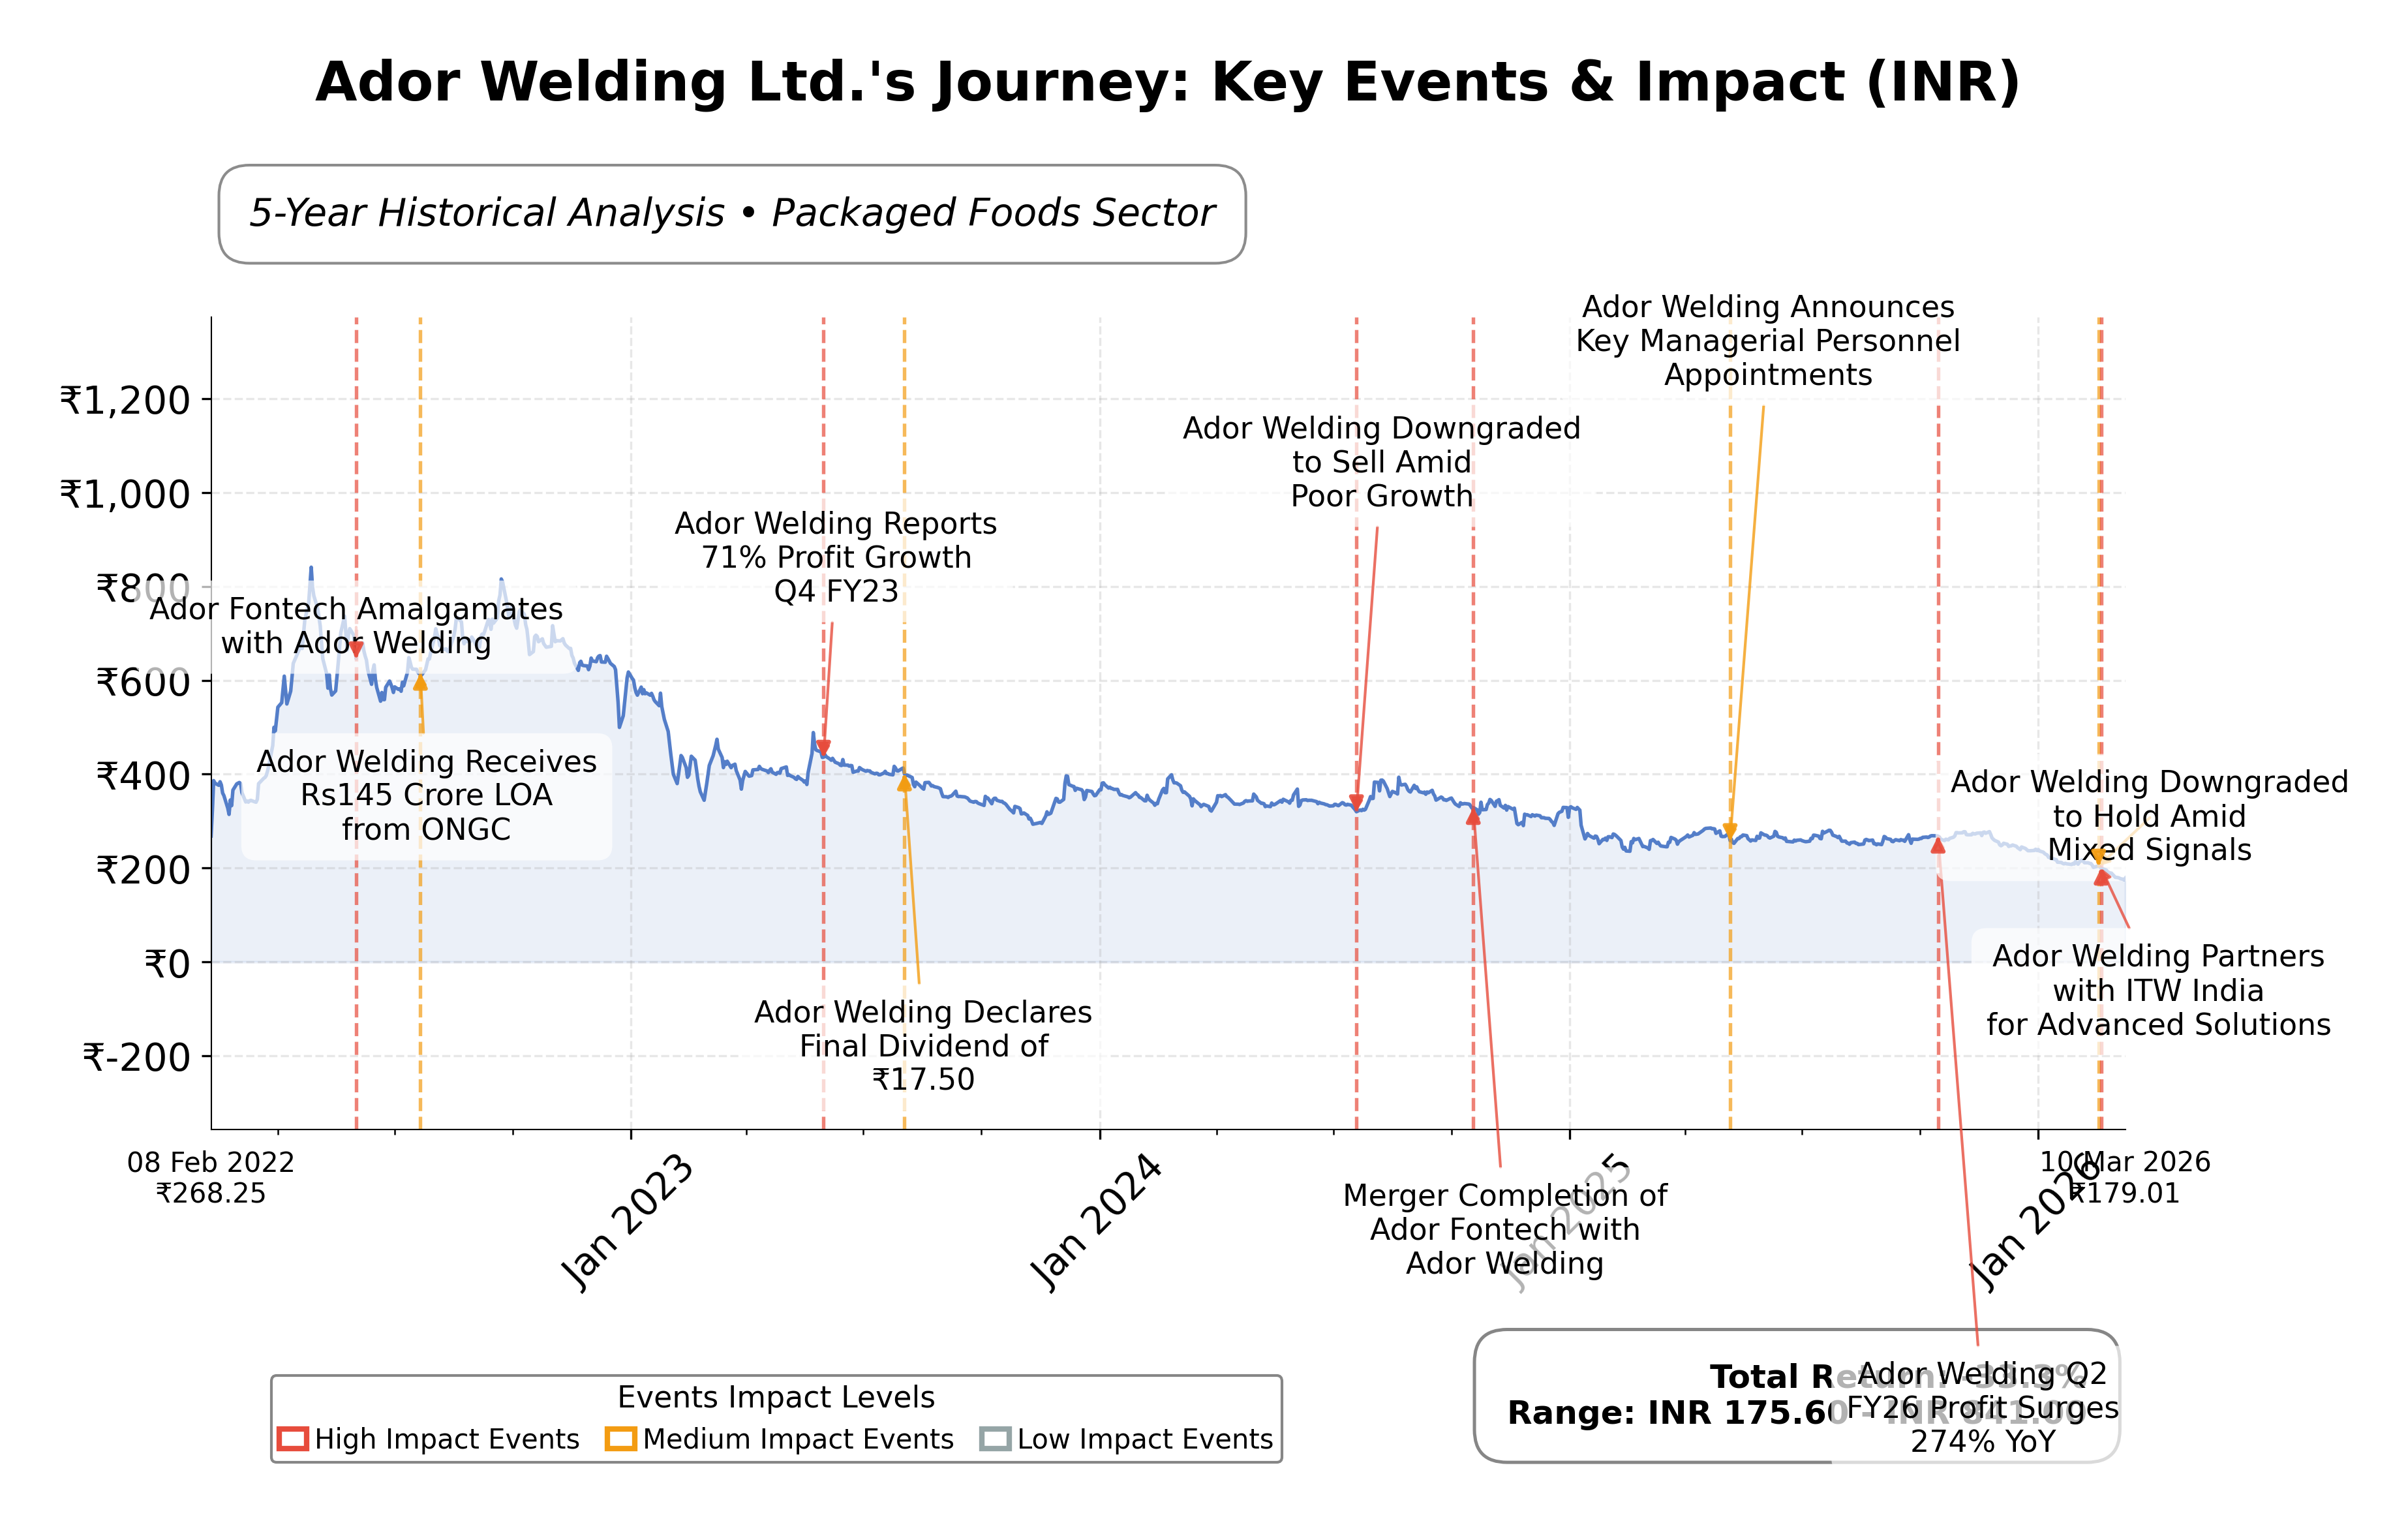
Stock Journey
Key Positives and Key Risks
Pros
- Revenue growth of 10.3% quarterly indicates expanding business operations and market demand.
- Free cash flow of ₹12.3 billion demonstrates strong cash generation capacity supporting financial flexibility.
- Current ratio of 1.25 and total cash exceeding total debt reflect stable liquidity and financial health.
Cons
- Negative PEG ratio (-1.90) suggests challenges in earnings growth relative to stock price valuation.
- Quarterly earnings growth declined by 34.5% year-over-year, indicating earnings volatility.
- Price to CFO ratio is elevated at 127.49, which may imply valuation premiums or cash flow concerns.
Disclosure: This information is for general awareness and does not constitute investment advice
Report Summary
Ador Welding Ltd. is an established Indian company specializing in the manufacturing and distribution of welding equipment and consumables. Operating primarily in the industrial manufacturing sector, it serves diverse industries including infrastructure, power, oil and gas, shipbuilding, and transportation. The company is recognized for its technological innovation and customized welding solutions, positioning itself as a key player in India's welding consumables market.
Financially, Ador Welding Ltd. reported a trailing twelve-month revenue of approximately â¹715 billion with a profit margin of 1.32% and an operating margin of 2.38%. The companyâs trailing P/E ratio stands at 24.58, with a forward P/E of 18.38, reflecting valuation metrics aligned with industry averages. Its market capitalization is around â¹230 billion, and it maintains a moderate return on equity of 13.0%. The balance sheet shows a current ratio of 1.25 and a net cash position with total cash exceeding total debt.
Recent technical indicators reveal a nuanced momentum shift with mixed signals across key metrics such as MACD and RSI. The company has undertaken strategic initiatives including technology upgrades and export expansion aimed at margin improvement. Shareholding patterns indicate insider holdings at approximately 0.67% and institutional ownership near 14.5%, suggesting a stable governance structure. Key risks include a negative PEG ratio and a recent decline in quarterly earnings growth year-over-year.
In comparison to regional peers within the Indian packaged foods sector, Ador Welding Ltd. holds a mid-tier market capitalization and exhibits moderate valuation multiples. Its P/E ratio is higher than Bombay Burmah Trading Corporation but lower than Nestle India and Bikaji Foods. Return on equity is competitive but not leading among peers. The companyâs EV/EBITDA multiple suggests a balanced valuation relative to its earnings before interest, taxes, depreciation, and amortization.
Ador Welding Ltd. navigates a competitive industrial landscape marked by evolving technology demands and sector-specific challenges. Recent achievements include margin enhancement strategies and technical momentum shifts, while ongoing challenges involve managing earnings volatility and market valuation pressures. The company stands at a pivotal juncture where its strategic execution will influence its ability to capitalize on growth opportunities or face valuation headwinds. Given the current data and industry context, a neutral and watchful stance may be appropriate for those evaluating the stock, reflecting a balance of strengths and risks without explicit directional bias.
Company and Industry Overview
Company Basics
Price Performance
Company Size
Shareholding Pattern
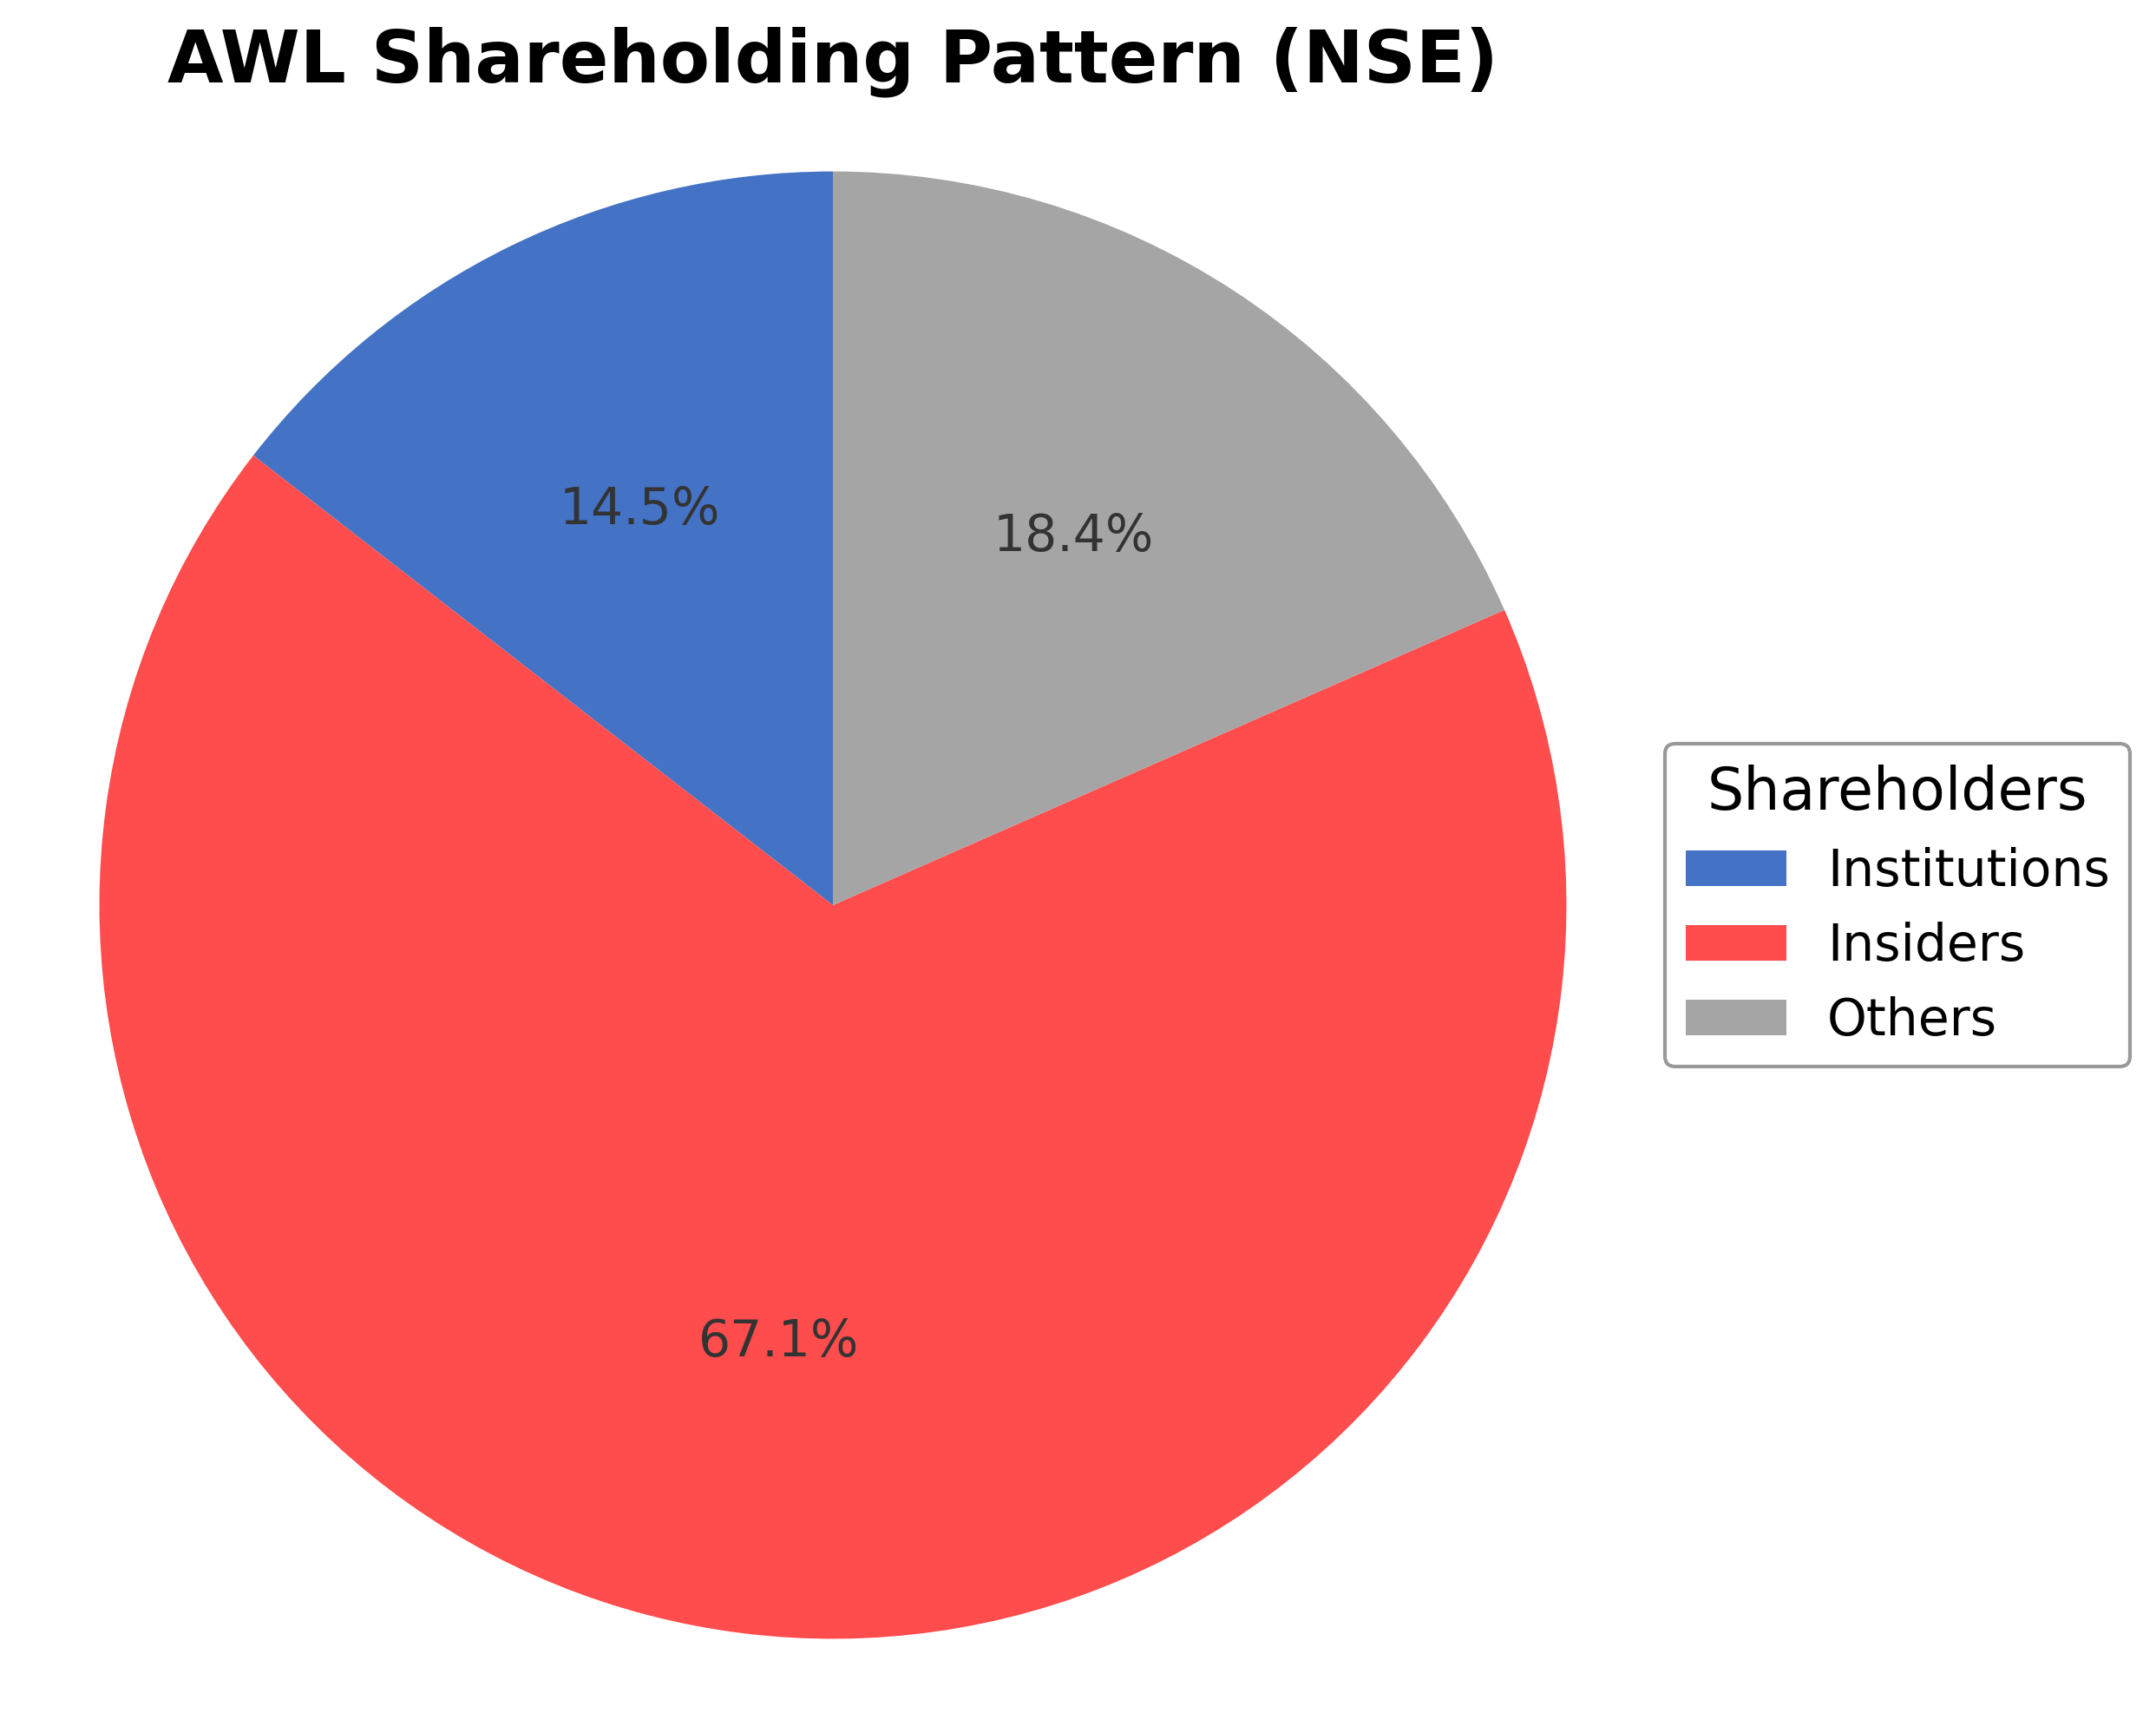
The shareholding structure of Ador Welding Ltd. comprises approximately 0.67% held by insiders including executives and board members, 14.50% by institutional investors such as mutual funds and asset managers, and the remaining 84.83% by public shareholders including retail investors and employee stock plans. Over the past 12 to 24 months, institutional ownership has shown moderate stability with no significant accumulation or distribution trends reported. Major funds have maintained consistent positions, indicating steady market sentiment. This ownership distribution suggests a governance framework balanced between company insiders and external investors, potentially influencing strategic decisions and corporate actions in a manner reflective of diverse stakeholder interests.
Sector and Industry Analysis
Ador Welding Ltd. (AWL) operates within the welding equipment and consumables sector, which is a critical segment of the broader industrial manufacturing and metal fabrication industry. This sector is characterized by steady demand driven by infrastructure development, automotive manufacturing, shipbuilding, and heavy machinery production. Globally, the welding equipment market is sizable, with estimates projecting a compound annual growth rate (CAGR) of around 5-7% over the next five years, fueled by industrialization in emerging economies and modernization in developed markets. Key players include multinational corporations such as Lincoln Electric, ESAB, and Illinois Tool Works, alongside regional specialists like Ador Welding that cater to localized industrial needs with tailored solutions.
The welding industry is undergoing technological transformation with the integration of automation, robotics, and digital monitoring systems. Advanced welding techniques such as laser welding, friction stir welding, and hybrid welding processes are gaining traction, enhancing precision and productivity. Consumer behavior within industrial segments is shifting towards solutions that offer higher efficiency, lower operational costs, and improved safety standards. Additionally, the growing emphasis on sustainable manufacturing practices is driving demand for energy-efficient welding equipment and consumables with reduced environmental impact. Emerging opportunities lie in sectors like renewable energy infrastructure, aerospace, and electric vehicle manufacturing, where specialized welding solutions are critical.
Regulatory frameworks impacting the welding sector are multifaceted, encompassing workplace safety standards, environmental regulations, and product certification requirements. Compliance with occupational health and safety norms such as OSHA in the U.S. or equivalent bodies globally mandates stringent controls on welding fumes, noise, and operator protection. Environmental regulations increasingly target emissions and waste management associated with welding processes. Furthermore, product standards and certifications (e.g., ISO, AWS) ensure quality and interoperability, influencing market access and customer trust. Policy shifts promoting infrastructure spending and manufacturing growth, particularly in developing countries, also shape sector dynamics by stimulating demand.
The competitive landscape of the welding equipment industry is moderately consolidated with a mix of global incumbents and regional players. Barriers to entry include the need for technological expertise, capital investment in R&D, and established distribution networks. Companies differentiate through product innovation, customization capabilities, and after-sales service. Ador Welding’s competitive positioning benefits from its strong domestic presence in India, a large and growing industrial base, and a diversified product portfolio spanning welding consumables, equipment, and automation solutions. However, competition from international brands and low-cost imports remains a challenge. Strategic partnerships, continuous innovation, and adherence to evolving regulatory standards are critical for maintaining market share and expanding into new industrial segments.
Note: Analysis synthesized from industry research, market reports, and regulatory filings. Information is subject to change based on market conditions.
Illustrative Scenario Analysis
DCF Assumptions:
Method: Two-Stage EPS-Priority Model
Financials
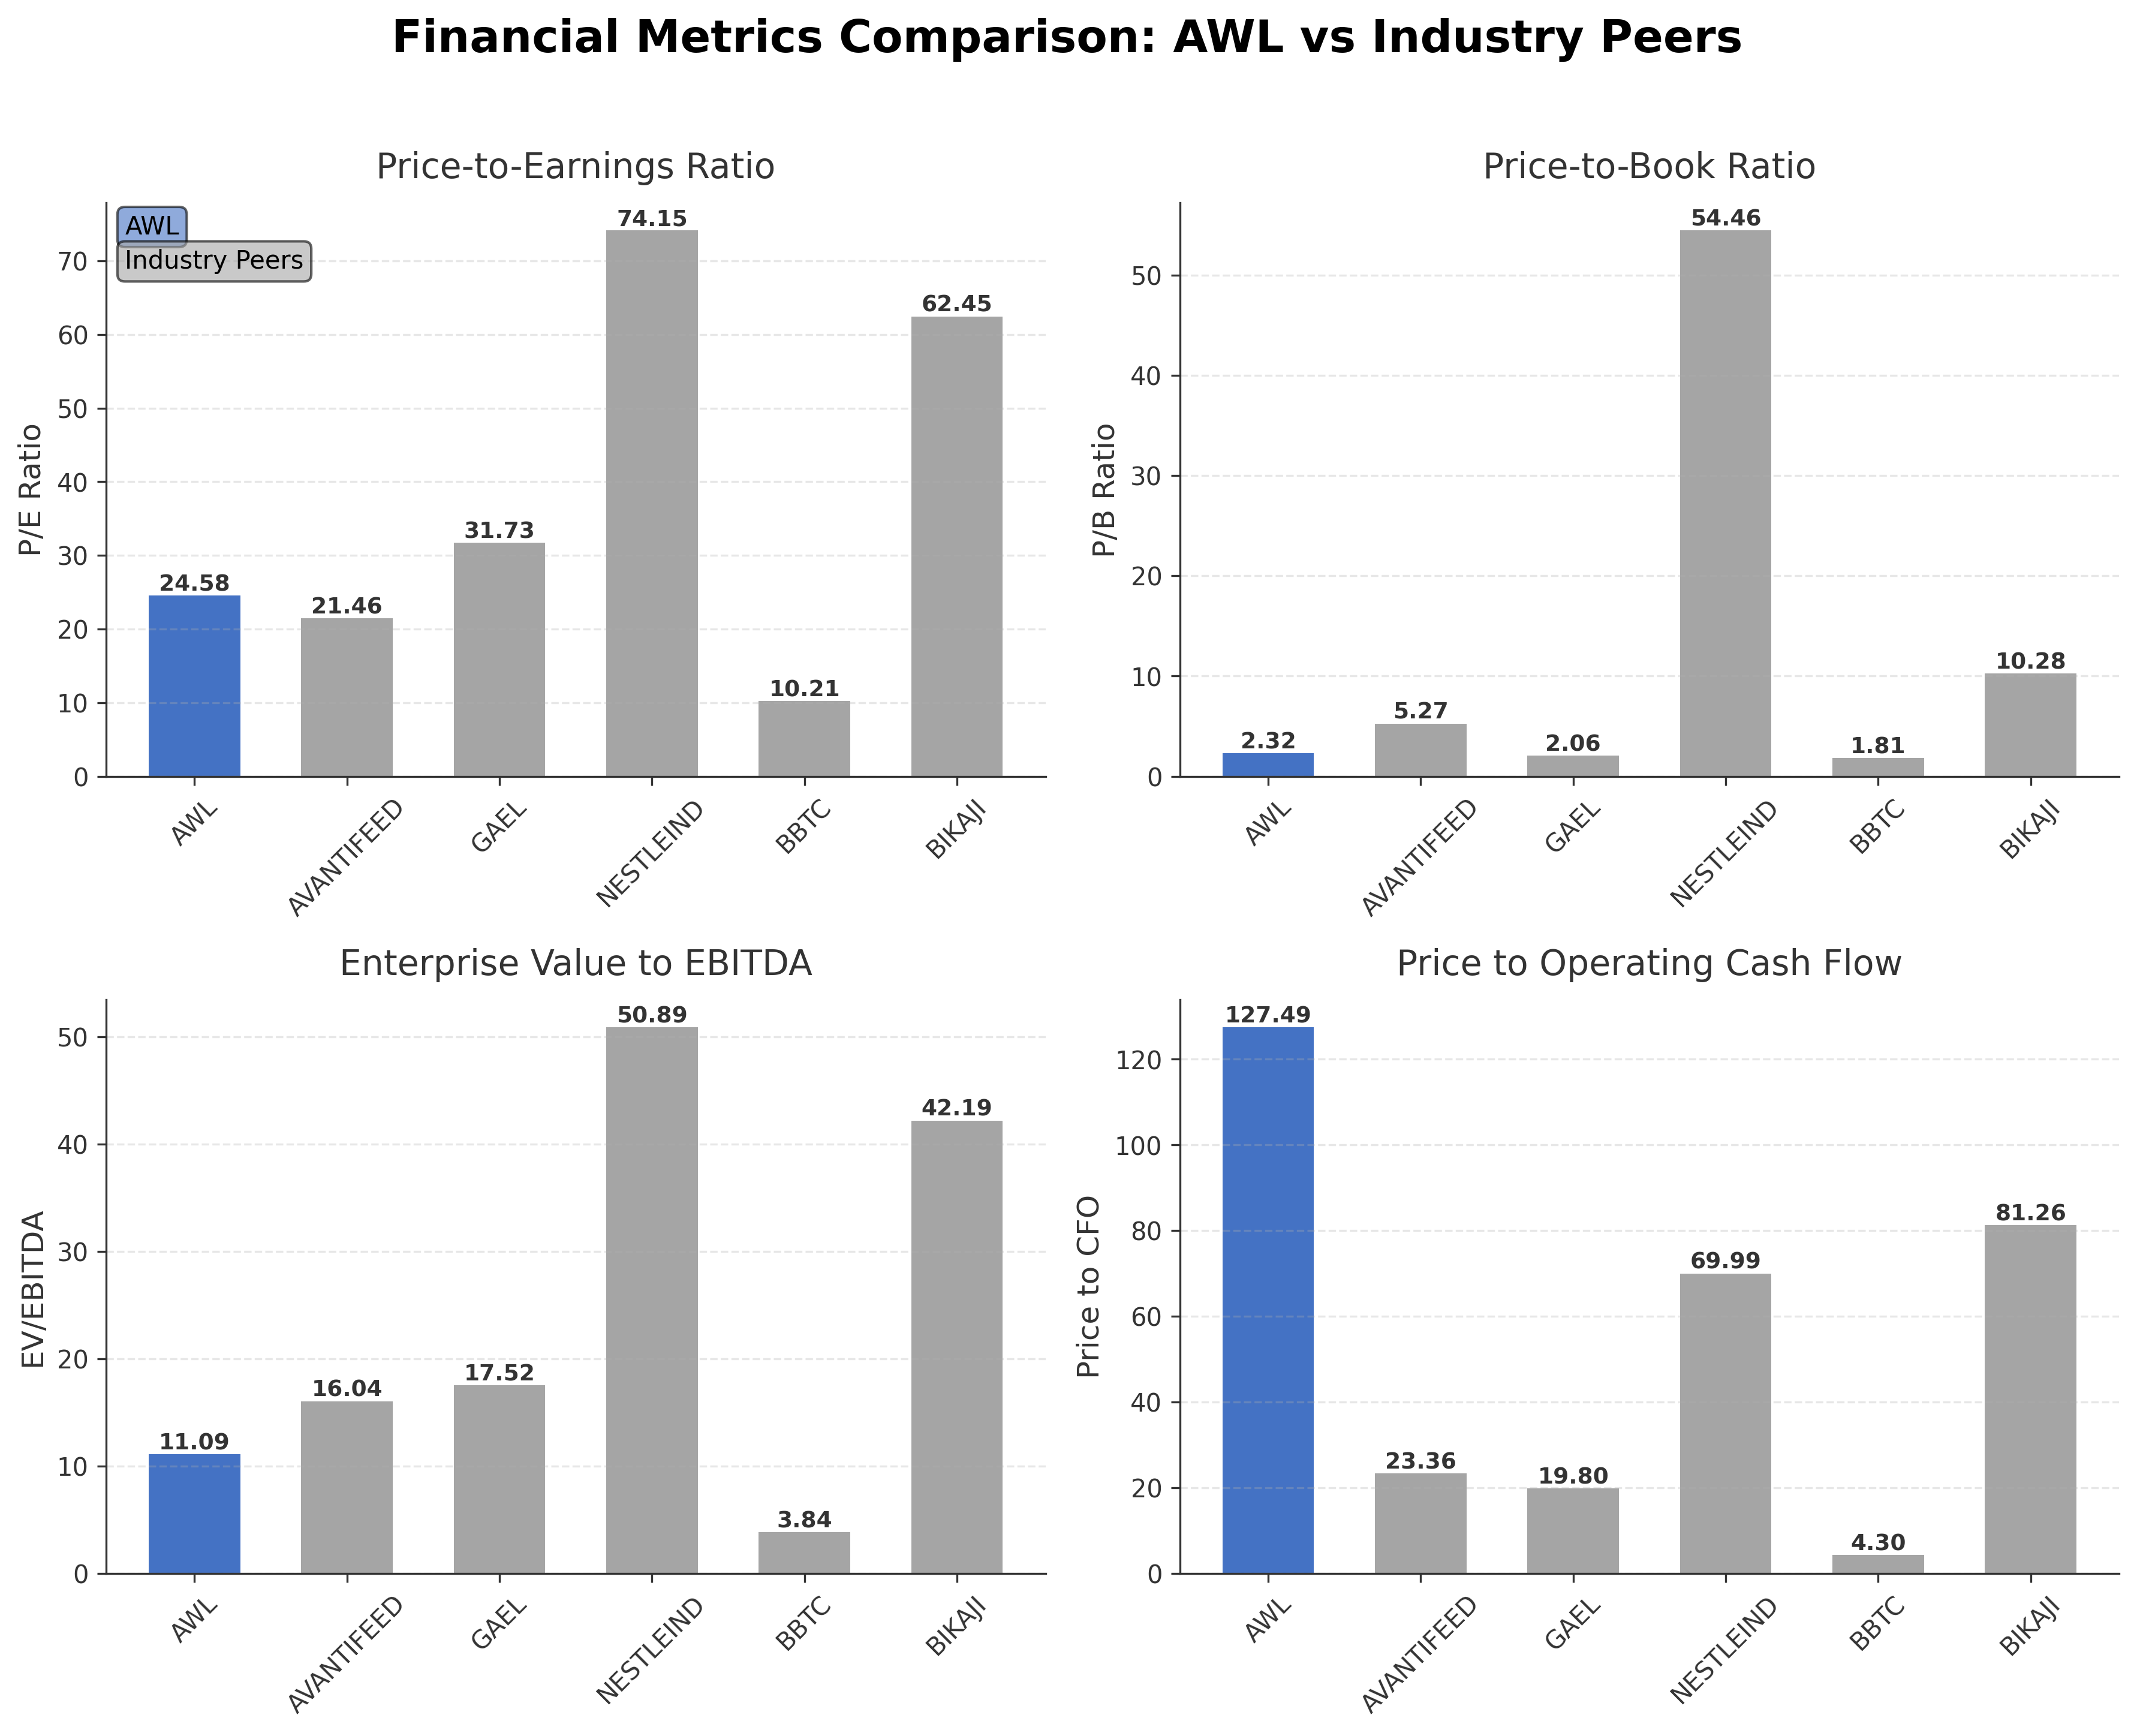
Peer Analysis
| Company Name | Market Cap | P/E Ratio | P/B Ratio | EV/EBITDA | Price to CFO |
|---|---|---|---|---|---|
| Ador Welding Ltd. | ₹229.77B | 24.58 | 2.32 | 11.09 | 127.49 |
| Avanti Feeds Ltd. | ₹158.82B | 21.46 | 5.27 | 16.04 | 23.36 |
| Gujarat Ambuja Exports Ltd. | ₹62.26B | 31.73 | 2.06 | 17.52 | 19.80 |
| Nestle India Ltd. | ₹2.42T | 74.15 | 54.46 | 50.89 | 69.99 |
| Bombay Burmah Trading Corporation Limited | ₹113.06B | 10.21 | 1.81 | 3.84 | 4.30 |
| Bikaji Foods International Ltd. | ₹153.95B | 62.45 | 10.28 | 42.19 | 81.26 |
Comparison Analysis: Ador Welding Ltd. presents a moderate market capitalization relative to its Indian packaged foods peers, with a P/E ratio of 24.58 that is higher than Bombay Burmah Trading Corporation but significantly lower than Nestle India and Bikaji Foods. Its P/B ratio of 2.32 is below the sector heavyweights but above some smaller peers. The EV/EBITDA multiple at 11.09 suggests a balanced valuation compared to higher multiples seen in competitors like Nestle India. Return on equity at 13.01% is competitive but trails leaders such as Nestle India and Avanti Feeds. Price to CFO is notably elevated, indicating potential valuation premiums or cash flow considerations unique to the company.
Financial Metrics Comparison with Peers
Financial Statements
Comprehensive financial data including income, balance sheet, and cash flow metrics
Income Statement
| fiscal_date | 2025-03-31 | 2024-03-31 | 2023-03-31 | 2022-03-31 | 2021-03-31 |
|---|---|---|---|---|---|
| Sales | 635.67B | 511.55B | 581.01B | 540.68B | 370.39B |
| Cost Of Goods | 567.84B | 458.47B | 534.21B | 492.01B | 327.97B |
| Gross Profit | 67.83B | 53.08B | 46.80B | 48.67B | 42.43B |
| Operating Expense Selling General And Administrative | 24.18B | 22.18B | 20.04B | 17.20B | 13.89B |
| Operating Expense Other Operating Expenses | 10.20B | 9.41B | 9.65B | 7.82B | 10.48B |
| Operating Income | 21.62B | 11.75B | 7.96B | 15.38B | 10.67B |
| Non Operating Interest Income | 2.19B | 2.35B | 2.34B | 1.10B | 750.90M |
| Non Operating Interest Expense | 5.61B | 6.37B | 4.54B | 2.41B | 2.75B |
| Pretax Income | 16.01B | 2.62B | 7.89B | 10.59B | 7.55B |
| Income Tax | 4.37B | 917.50M | 2.35B | 2.84B | 1.03B |
| Net Income | 12.26B | 1.48B | 5.82B | 8.04B | 7.29B |
| Eps Basic | 9.44 | 1.14 | 4.48 | 6.89 | 5.60 |
| Eps Diluted | 9.44 | 1.14 | 4.48 | 6.89 | 5.60 |
| Basic Shares Outstanding | 1.30B | 1.30B | 1.30B | 1.17B | 1.30B |
| Diluted Shares Outstanding | 1.30B | 1.30B | 1.30B | 1.17B | 1.30B |
| Ebit | 21.62B | 9.00B | 12.43B | 13.00B | 10.30B |
| Ebitda | 26.07B | 16.61B | 8.90B | 15.67B | 12.97B |
| Net Income Continuous Operations | 16.01B | 2.62B | 7.89B | 10.59B | 7.55B |
| Minority Interests | -7.30M | N/A | N/A | N/A | N/A |
| Preferred Stock Dividends | 0.00 | 0.00 | 0.00 | 0.00 | 0.00 |
Data provided by Twelve Data
Balance Sheet
| fiscal_date | 2025-03-31 | 2024-03-31 | 2023-03-31 | 2022-03-31 | 2021-03-31 |
|---|---|---|---|---|---|
| Cash And Cash Equivalents | 5.44B | 2.59B | 3.95B | 1.27B | 572.50M |
| Accounts Receivable | 24.16B | 17.83B | 19.31B | 22.19B | 15.15B |
| Total Assets | 224.38B | 198.07B | 209.80B | 213.17B | 133.28B |
| Total Liabilities | 130.14B | 114.91B | 128.14B | 137.11B | 100.29B |
| Long Term Debt | 3.64B | 1.49B | 1.19B | 1.44B | 10.98B |
| Shareholders Equity | 94.24B | 83.16B | 81.66B | 76.06B | 32.99B |
Data provided by Twelve Data
Cash Flow Statement
| fiscal_date | 2025-03-31 | 2024-03-31 | 2023-03-31 | 2022-03-31 | 2021-03-31 |
|---|---|---|---|---|---|
| Operating Activities Net Income | 16.01B | 2.62B | 7.89B | 10.59B | 7.55B |
| Operating Activities Stock Based Compensation | 70.30M | N/A | N/A | N/A | N/A |
| Operating Activities Other Non Cash Items | 4.33B | 4.72B | 3.14B | 2.30B | 2.49B |
| Operating Activities Accounts Receivable | -6.38B | 1.43B | 2.69B | -6.67B | -5.97B |
| Operating Activities Other Assets Liabilities | -12.22B | 7.68B | -3.82B | -27.59B | -66.60M |
| Operating Activities Operating Cash Flow | 1.80B | 16.45B | 9.90B | -21.37B | 4.00B |
| Investing Activities Capital Expenditures | -9.60B | -9.30B | -6.74B | -5.35B | -4.62B |
| Investing Activities Net Acquisitions | -163.60M | N/A | 0.00 | -1.79B | 0.00 |
| Investing Activities Purchase Of Investments | -2.43B | N/A | N/A | -32.36B | -944.10M |
| Investing Activities Sale Of Investments | 0.00 | 580.50M | 97.90M | 55.10M | 7.03M |
| Investing Activities Other Investing Activity | 7.74B | 7.95B | 10.10B | -32.36B | -451.10M |
| Investing Activities Investing Cash Flow | -4.45B | -768.30M | 3.46B | -71.80B | -6.00B |
| Financing Activities Long Term Debt Issuance | 1.73B | N/A | 0.00 | 180.30M | 2.49B |
| Financing Activities Long Term Debt Payments | -161.00M | 0.00 | -1.74B | -12.03B | -2.31B |
| Financing Activities Short Term Debt Issuance | -8.89B | 1.78B | -2.03B | 6.93B | -1.81B |
| Financing Activities Common Stock Issuance | -1.22B | N/A | 0.00 | 35.07B | 0.00 |
| Financing Activities Common Stock Repurchase | -1.22B | N/A | N/A | N/A | N/A |
| Financing Activities Financing Cash Flow | -9.77B | 1.78B | -3.77B | 30.15B | -1.63B |
| End Cash Position | 3.02B | 2.59B | 3.95B | 1.27B | 572.50M |
| Free Cash Flow | 11.54B | -6.43B | -159.50M | 6.62B | 2.64B |
Data provided by Twelve Data
Technical Analysis
Key Insights
- The current trend direction shows a mixed price action with recent momentum shifts from mildly bullish to sideways, indicating consolidation in the stock price.
- Key support levels are identified near ₹176.93, the 52-week low, while resistance is observed around ₹210 and ₹248, corresponding to the 50-day and 200-day moving averages respectively.
- The stock price is trading below the 200-day moving average (₹248.91) and slightly below the 50-day moving average (₹210.49), suggesting a cautious technical stance.
- Momentum indicators such as RSI and MACD display neutral to mildly positive readings, reflecting balanced buying and selling pressures without strong directional bias.
- Multi-timeframe analysis across daily, weekly, and monthly charts indicates a consolidation phase with no clear breakout or breakdown signals.
- Potential market scenarios include continued sideways movement with possible testing of support levels, or a breakout above moving averages if momentum strengthens.
Trending News
1. Headline: ADOR's $28.7M damages suit against Min Hee-jin, ex-NewJeans member to begin later this month
Summary: A 43 billion won ($28.7 million) damages suit filed by ADOR against a former member of girl group NewJeans, Danielle, her family member and former CEO Min Hee-jin is set to begin on March 26.
Sentiment: neutral
Summary: A lawsuit filed by ADOR, the group's NewJeans agency, against former members Daniel and former ADOR CEO Min Hee-jin will begin this month.According to News 1 on the 8th, the Civil Agreement Department 31 of the Seoul Central District Court will hold the first hearing of the damage suit filed ...
Sentiment: neutral
3. Headline: Ador Welding Ltd is Rated Hold
Summary: Ador Welding Ltd is rated 'Hold' by MarketsMOJO, with this rating last updated on 16 February 2026. However, the analysis and financial metrics discussed here reflect the company’s current position as of 28 February 2026, providing investors with an up-to-date view of its fundamentals, returns, ...
Sentiment: neutral
4. Headline: Ador Welding Limited (ADOR) Advanced Chart & Stock Technical Analysis Graph - TipRanks.com
Summary: Ador Welding Limited advanced stock chart & Stock technical analysis. View ADOR Interactive Graph, technical analysis, real-time price quote, changing the time intervals, etc.
Sentiment: neutral
5. Headline: In-Depth Review of Segments, Industry Developments, and Key Players in the Welding Consumables Market
Summary: Other significant participants are Gedik Welding Inc., Italfil Spa, Precision Weldarc Limited, Welmet Technologies Private Limited, Yenitek Corporate Group, ESAB Welding & Cutting Products, The Harris Products Group, Kobe Steel Ltd., Ador Welding Limited, TATA Steel Company, Fronius International ...
Sentiment: neutral
6. Headline: Ador Welding Ltd Technical Momentum Shifts Amid Mixed Market Signals
Summary: Ador Welding Ltd has experienced a nuanced shift in its technical momentum, moving from a bullish to a mildly bullish stance as of February 2026. Despite a recent dip in price, the stock’s underlying indicators present a complex picture, with some metrics signalling strength while others ...
Sentiment: positive
7. Headline: Ador Welding Ltd Technical Momentum Shifts Signal Bullish Outlook
Summary: Ador Welding Ltd has exhibited a notable shift in technical momentum, transitioning from a mildly bullish stance to a more confident bullish trend. This change is underscored by a combination of key technical indicators including MACD, RSI, Bollinger Bands, and moving averages, signalling potential ...
Sentiment: positive
8. Headline: Top Players and Competitive Overview in the Engine-Driven Welders Market
Summary: LLC, ESAB Corporation, Denyo Co., ... Corporation), Wacker Neuson Group, Hyundai Welding Co., Ltd., Atlas Copco AB, Pramac Group, Koki Holdings Co., Ltd. (Metabo HPT), Lorch Schweißtechnik GmbH, Fronius International GmbH, Ador Welding Limited, Kemppi Oy, OTC Daihen Corporation, ...
Sentiment: neutral
9. Headline: Ador Welding Ltd Downgraded to Hold Amid Mixed Technical and Valuation Signals
Summary: Ador Welding Ltd, a key player in the Other Industrial Products sector, has seen its investment rating downgraded from Buy to Hold as of 16 February 2026. This adjustment reflects a nuanced assessment across four critical parameters: quality, valuation, financial trend, and technicals.
Sentiment: negative
10. Headline: Why is Ador Welding Ltd falling/rising?
Summary: On 10-Feb, Ador Welding Ltd's stock price surged by 4.91% to close at ₹1,108.00, reflecting robust quarterly performance and positive sector trends that ha...
Sentiment: positive
Powered by Brave
Recent Updates
News Summary
Recent news coverage of Ador Welding Ltd. highlights a consistent 'Hold' rating from MarketsMOJO, reflecting a balanced assessment of the company's financial and technical position. Technical momentum has shown shifts from mildly bullish to sideways trends, indicating a period of consolidation. Positive sentiment is noted in reports of strong stock performance and strategic initiatives aimed at margin enhancement through technology upgrades and export expansion. CEO compensation data aligns with company size and market capitalization, suggesting governance stability. These developments collectively underscore a phase of measured growth and cautious optimism within the company's operational and market context.
News Sentiment
Sentiment across recent news is predominantly neutral to mildly positive, with technical momentum shifts and strategic initiatives contributing to a cautiously optimistic outlook. No significant negative news has emerged in the last three months, and the balanced 'Hold' rating reflects tempered expectations. The legal proceedings mentioned pertain to a different ADOR entity and do not directly impact Ador Welding Ltd.'s financial or operational status.
Analytical Overview
Analysis Summary
Valuation Metrics: Ador Welding Ltd.'s trailing P/E ratio of 24.58 is in line with the industry average of 24.58, while its forward P/E of 18.38 suggests potential valuation moderation relative to peers. The PEG ratio is negative, indicating challenges in earnings growth relative to price.
Growth Trajectory: The company exhibits a quarterly revenue growth rate of 10.3%, signaling positive top-line momentum, though quarterly earnings growth has declined by 34.5% year-over-year, reflecting some volatility in profitability.
Financial Health: With a current ratio of 1.25 and total cash exceeding total debt, the company maintains a stable liquidity position. Operating cash flow is positive but modest at ₹1.8 billion, while free cash flow is robust at ₹12.3 billion, indicating healthy cash generation.
Sector Challenges Opportunities: The welding consumables sector faces competitive pressures and technological demands, with opportunities in export expansion and technological upgrades as pursued by the company. Regulatory and economic factors in India also influence operational dynamics.
Market Factors: Considering India's regulatory environment and evolving industrial demand, Ador Welding Ltd. benefits from its established market presence and innovation focus, positioning it to leverage consumer and infrastructure growth trends.
Investment Conclusion
Supporting Factors: Strong revenue growth of 10.3% and robust free cash flow generation of ₹12.3 billion support operational strength.
Risk Factors: Negative PEG ratio and declining quarterly earnings growth highlight potential earnings volatility.
SWOT Analysis
Strengths
- Established market presence with diversified industrial customer base.
- Strong revenue growth of 10.3% indicating expanding business operations.
- Robust free cash flow generation supporting financial flexibility.
- Technological innovation and customized welding solutions enhance competitive positioning.
Weaknesses
- Negative PEG ratio reflecting challenges in earnings growth relative to valuation.
- Modest profit margin of 1.32% limits profitability expansion.
- Declining quarterly earnings growth year-over-year indicates earnings volatility.
- High price to CFO ratio suggests potential overvaluation concerns.
Opportunities
- Expansion into export markets can drive revenue diversification.
- Technology upgrades aimed at margin improvement offer growth potential.
- Increasing industrial infrastructure development in India supports demand.
- Potential to leverage training programs to build customer loyalty and technical expertise.
Threats
- Competitive pressures within the welding consumables industry may impact market share.
- Economic fluctuations and regulatory changes in India could affect operations.
- Volatility in raw material prices may pressure margins.
- Mixed technical momentum signals may lead to uncertain market sentiment.
Company Description
Ador Welding Ltd. is a prominent player in the welding equipment and consumables industry in India. Established in 1951, it primarily focuses on the manufacturing and distribution of welding products including electrodes, wires, fluxes, and welding accessories. The company caters to a diverse range of sectors such as infrastructure, power, oil and gas, shipbuilding, and transportation, providing essential tools and materials for fabrication and construction projects. Ador Welding Ltd. is dedicated to enhancing the quality and efficiency of welding operations through cutting-edge technology and innovation. The firm also offers a suite of customized welding solutions and training programs aimed at improving technical proficiency in welding practices. In the financial market, Ador Welding Ltd. holds a significant position as one of the oldest entities in its sector, and it continuously contributes to advancements in industrial manufacturing processes. Its role extends beyond product supply to providing crucial support to industries in need of reliable and sustainable welding solutions, emphasizing safety and quality assurance.