


Aditya Birla Real Estate Ltd (ABREL)
Stock Analysis Report
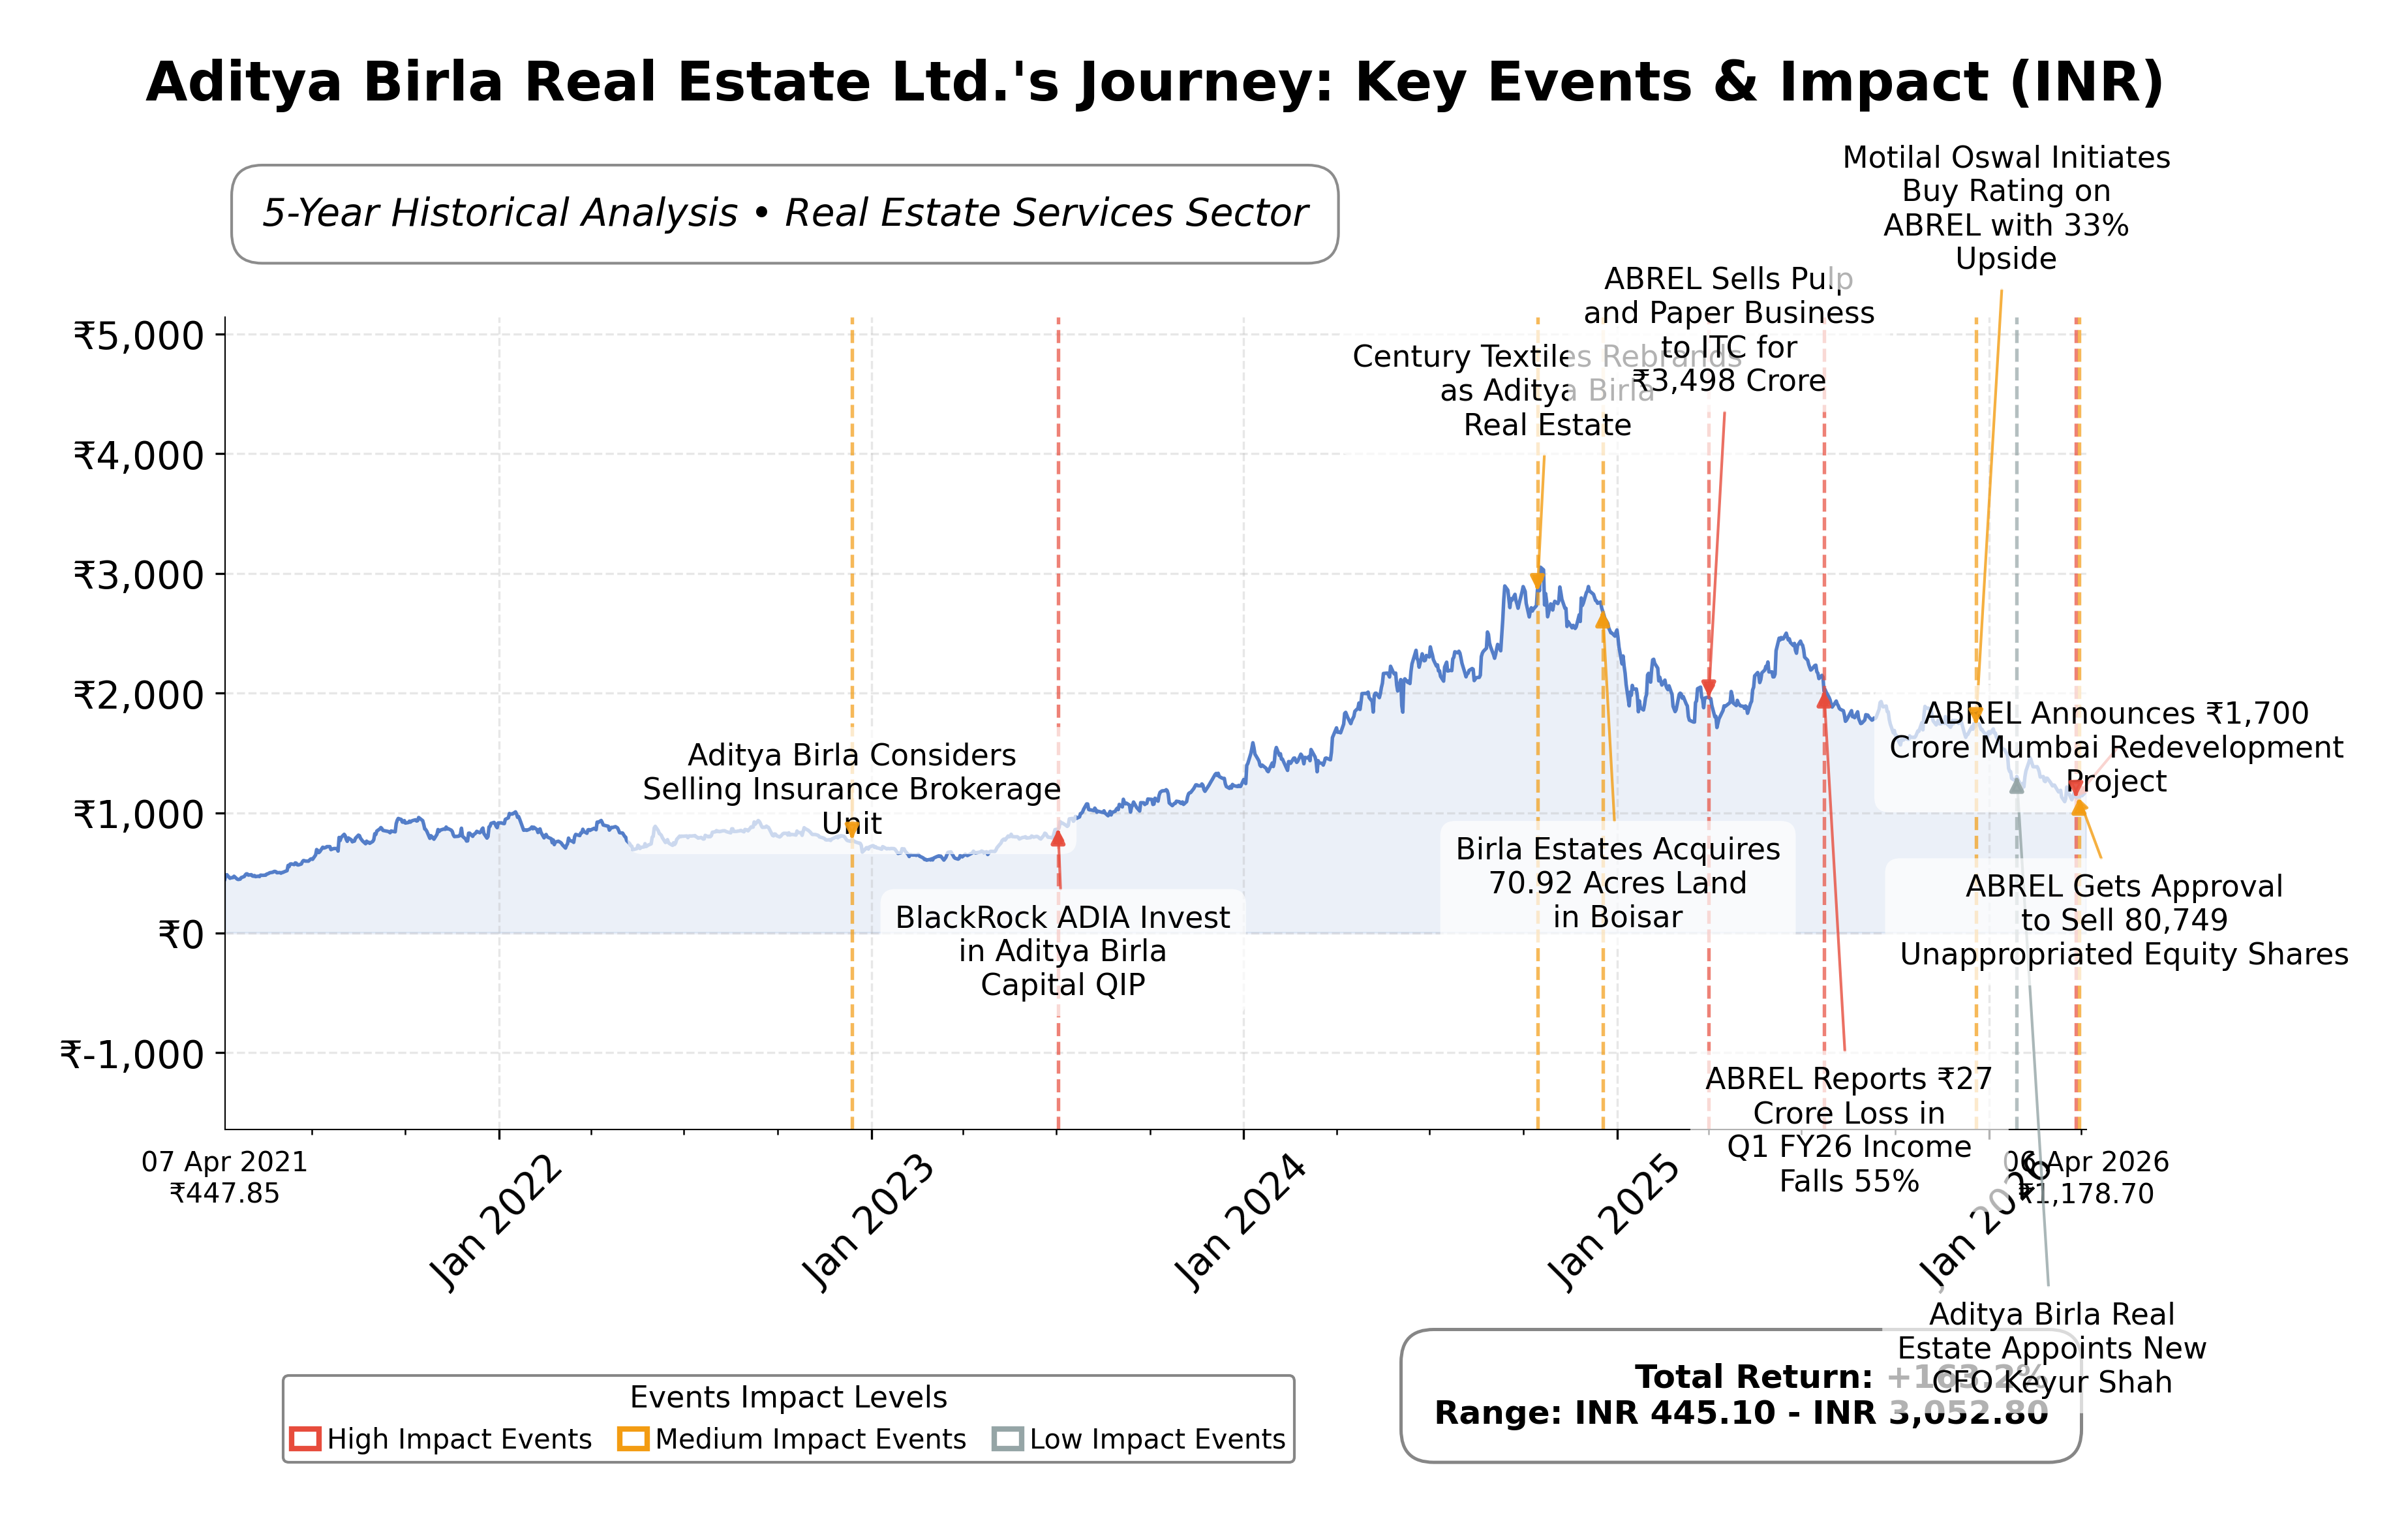
Stock Journey
Key Positives and Key Risks
Pros
- Forward P/E ratio of 9.16 indicates market expectations of improved profitability relative to current earnings.
- Strong asset base with total assets of ₹165.33 billion supports operational capacity and growth potential.
- Strategic redevelopment project in Mumbai targeting ₹1,700 crore revenue demonstrates growth initiatives.
Cons
- Negative net income of approximately ₹3.44 billion and profit margin of -33% highlight ongoing operational losses.
- High debt-to-equity ratio of 144.58% increases financial risk and potential liquidity constraints.
- Operating cash flow is negative at around ₹-20.7 billion TTM, indicating cash generation challenges.
Disclosure: This information is for general awareness and does not constitute investment advice
Report Summary
Aditya Birla Real Estate Ltd. (ABREL) operates within the Indian real estate services industry, focusing on the development of high-quality urban infrastructure, residential, commercial, and mixed-use properties. As a subsidiary of the Aditya Birla Group, a prominent multinational conglomerate, the company leverages its parentâs financial and operational strength to establish a significant market presence in Indiaâs rapidly expanding urban landscape. Its core business emphasizes sustainable and innovative living spaces that align with modern urban demands.
Financially, ABREL reported a trailing twelve months (TTM) revenue of approximately INR 7.41 billion but experienced a net loss of around INR 3.44 billion, reflecting a negative profit margin of -33%. The companyâs trailing P/E ratio stands at a high 163.88, while the forward P/E is substantially lower at 9.16, indicating expectations of improved profitability. The price-to-book ratio is 3.33, and the enterprise value to EBITDA ratio is negative, reflecting current operational challenges. The companyâs balance sheet shows a total asset base of INR 165.33 billion with a debt-to-equity ratio of 144.58%, highlighting significant leverage.
From a strategic perspective, ABREL recently announced a redevelopment project in Mumbai expected to generate revenue of INR 1,700 crore, signaling growth initiatives in key urban markets. The company received an independent ESG rating of 67.4 for FY2025, underscoring its commitment to sustainability. Key risks include ongoing net losses, negative operating cash flow, and high leverage, while strengths include strong brand affiliation and asset base. The stock has experienced a significant price decline, touching a 52-week low amid broader market weakness.
Peer comparison data is limited, with no direct peers provided for detailed benchmarking. However, within the Indian real estate sector, ABRELâs valuation metrics such as P/E and P/B ratios are relatively elevated, and its return on equity is negative, suggesting operational and profitability challenges compared to typical industry standards. The companyâs market capitalization of approximately INR 126.55 billion places it among mid-to-large players in the regional real estate market.
Aditya Birla Real Estate Ltd. is positioned at a pivotal juncture in the Indian real estate sector, balancing growth ambitions through redevelopment projects against financial and operational headwinds. Recent achievements include securing significant redevelopment contracts and improving ESG credentials, while challenges persist in profitability and cash flow management. The stakes involve navigating market volatility and leveraging strategic assets to enhance long-term value. Given the current financial and market data, a neutral and watchful stance may be appropriate for those assessing the companyâs stock, considering both the potential for operational turnaround and the risks associated with its financial profile.
Company and Industry Overview
Company Basics
Price Performance
Company Size
Shareholding Pattern
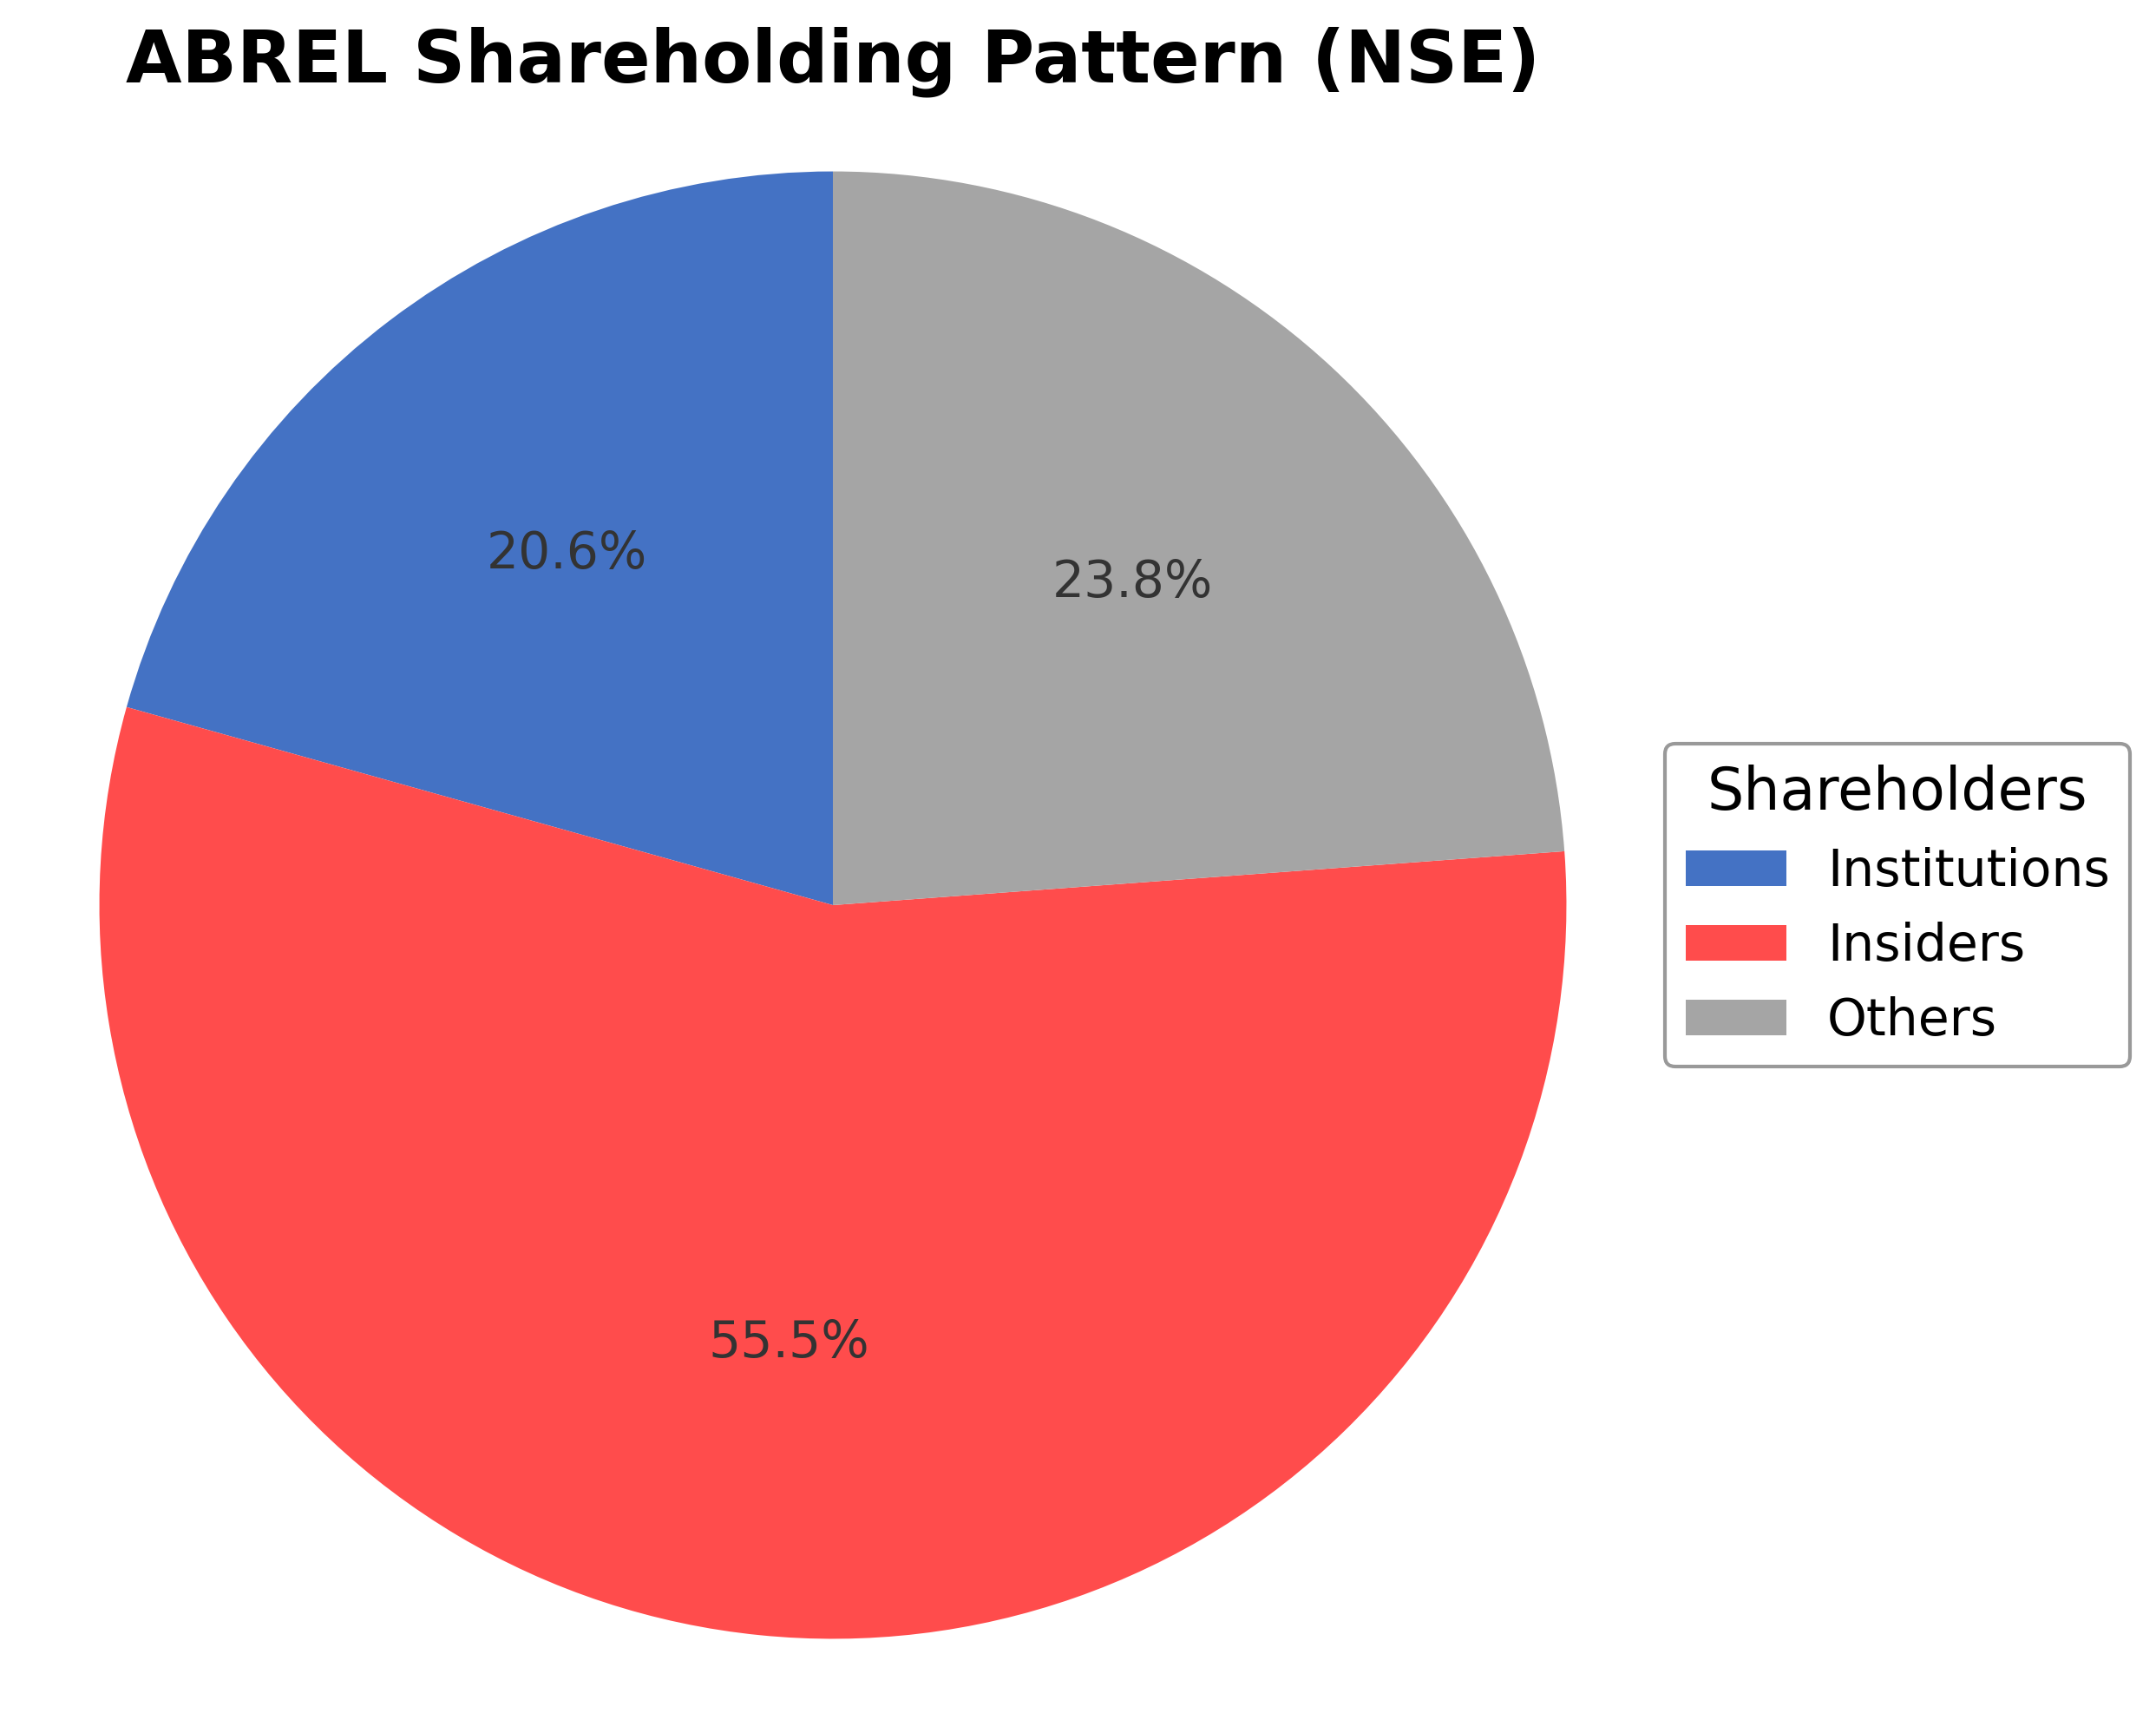
Aditya Birla Real Estate Ltd.'s shareholding structure comprises approximately 55.52% held by insiders including executives and board members, 20.65% by institutional investors such as mutual funds and pension funds, and the remaining 23.83% by public shareholders including retail investors and employee stock plans. Over the past 12-24 months, institutional ownership has shown moderate activity with some accumulation by major asset managers, reflecting cautious optimism amid financial challenges. The substantial promoter holding suggests strong governance influence from the parent Aditya Birla Group, while institutional participation indicates market interest in the company's strategic growth prospects. These shareholding patterns imply a balanced market sentiment with potential for strategic corporate actions influenced by both insiders and institutional stakeholders.
Sector and Industry Analysis
Aditya Birla Real Estate Ltd. (ABREL) operates within the Indian real estate sector, a critical component of the broader real assets and construction ecosystem. The Indian real estate market is sizeable, valued at approximately $250 billion as of recent estimates, and is projected to grow at a CAGR of 10-12% over the next five years, driven by rapid urbanization, rising disposable incomes, and government initiatives such as the Smart Cities Mission and affordable housing schemes. Key players in this sector include large diversified conglomerates like DLF, Godrej Properties, and Oberoi Realty, alongside specialized real estate developers such as ABREL, which leverage strong brand equity and integrated service offerings to capture market share.
Industry trends reflect a significant technological shift towards digitization and sustainability. PropTech innovations—ranging from virtual property tours and AI-driven customer analytics to blockchain for transparent transactions—are reshaping the customer experience and operational efficiency. Additionally, there is a growing consumer preference for green buildings and smart homes, driven by environmental awareness and regulatory incentives. The affordable housing segment continues to present robust opportunities due to government subsidies and increasing demand from the middle-income demographic, while commercial real estate is adapting to hybrid work models, impacting office space utilization patterns.
The regulatory landscape in Indian real estate has undergone transformative changes, primarily through the Real Estate (Regulation and Development) Act (RERA) implemented in 2016, which mandates transparency, timely project delivery, and consumer protection. Compliance with RERA has increased accountability but also raised operational costs and complexity for developers. Other significant regulations include the Goods and Services Tax (GST) on construction materials and services, land acquisition laws, and environmental clearances. Policy initiatives such as the Pradhan Mantri Awas Yojana (PMAY) and relaxed Foreign Direct Investment (FDI) norms have further stimulated sector growth while necessitating adherence to evolving compliance frameworks.
Competitive dynamics in the Indian real estate sector are characterized by a fragmented market structure with a mix of organized large-cap developers and numerous regional players. Barriers to entry include high capital intensity, regulatory compliance costs, and the need for strong land acquisition capabilities and brand trust. Established players like ABREL benefit from integrated business models, access to capital, and strategic partnerships, enabling them to scale projects efficiently and navigate regulatory complexities. The sector also faces challenges from cyclical demand fluctuations, rising input costs, and evolving consumer preferences, which necessitate agile business strategies and innovation to maintain competitive positioning.
Note: Analysis synthesized from industry research, market reports, and regulatory filings. Information is subject to change based on market conditions.
Illustrative Scenario Analysis
DCF Assumptions:
Method: Two-Stage EPS-Priority Model
Financials
Peer Analysis
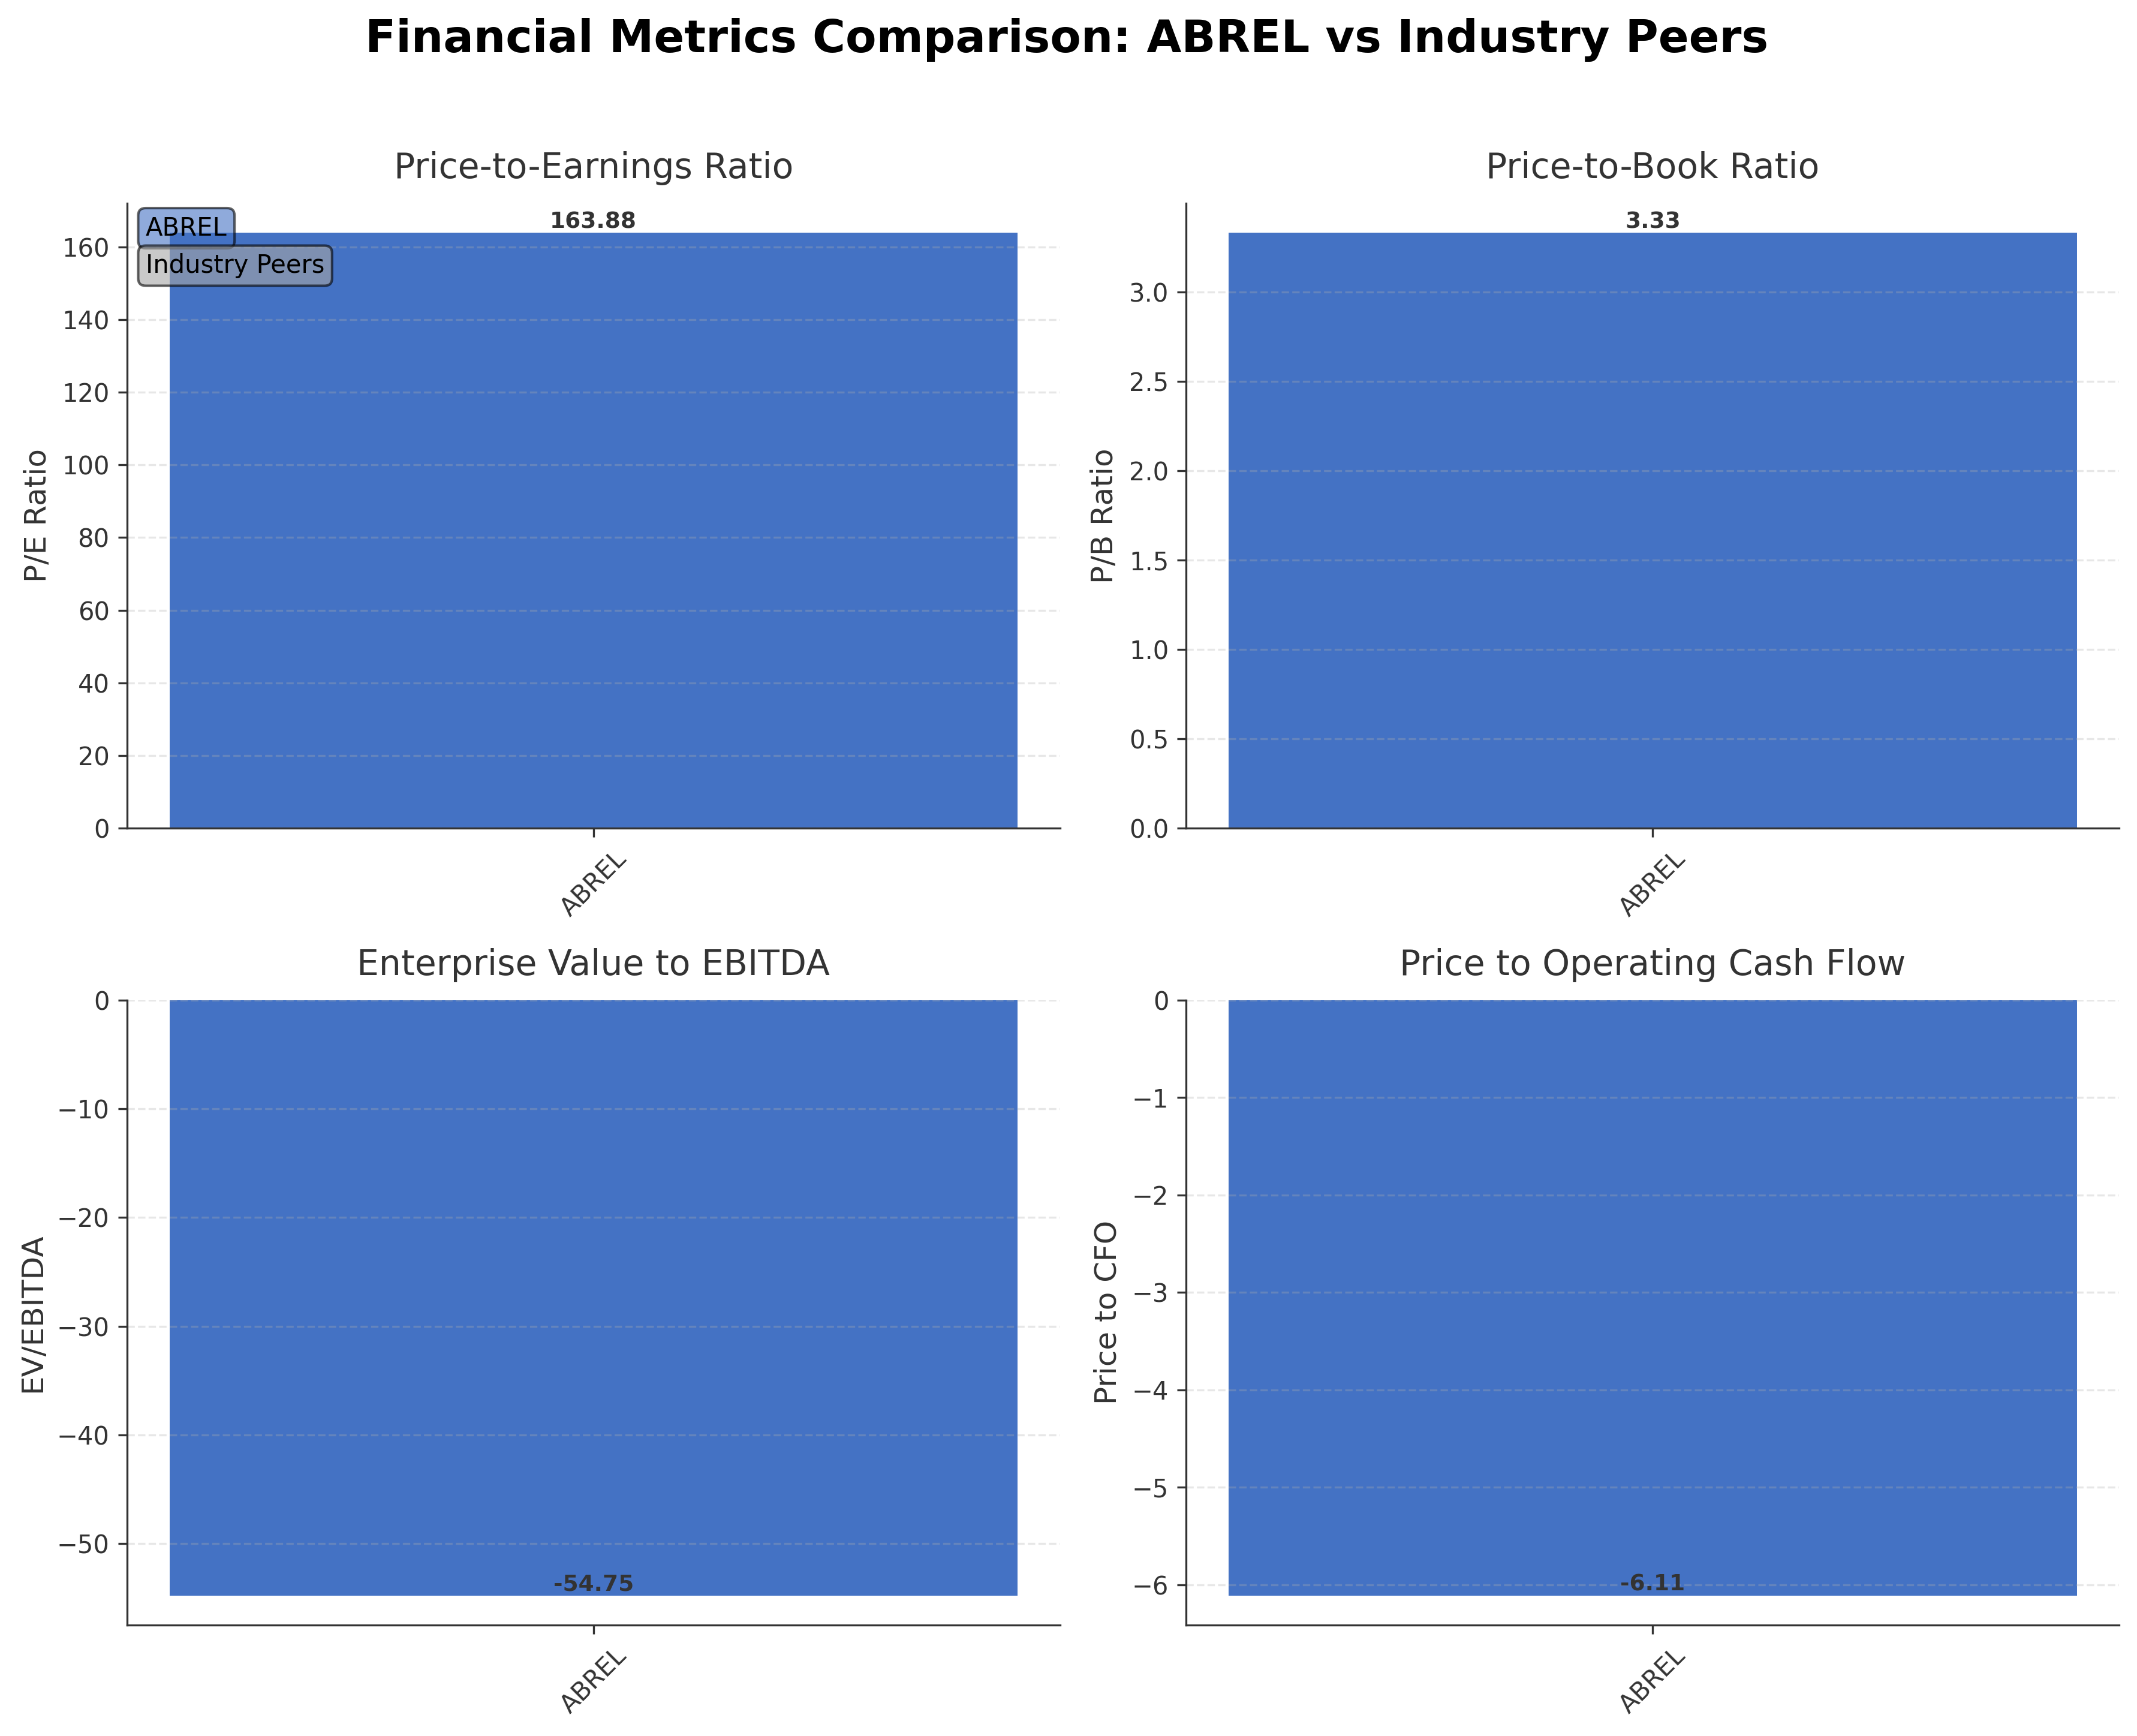
| Company Name | Market Cap | P/E Ratio | P/B Ratio | EV/EBITDA | Price to CFO |
|---|---|---|---|---|---|
| Aditya Birla Real Estate Ltd. | ₹126.55B | 163.88 | 3.33 | -54.75 | -6.11 |
Comparison Analysis: Currently, no direct peer companies within the same industry and geographic region are provided for comparison. As such, Aditya Birla Real Estate Ltd. stands as a singular data point with elevated valuation metrics including a high trailing P/E ratio of 163.88 and a negative EV/EBITDA ratio, reflecting operational challenges. The negative return on equity and price to cash flow ratios indicate profitability and cash generation issues relative to typical real estate sector benchmarks. This absence of peer data limits comprehensive relative performance analysis.
Financial Metrics Comparison with Peers
Financial Statements
Comprehensive financial data including income, balance sheet, and cash flow metrics
Income Statement
| fiscal_date | 2025-03-31 | 2024-03-31 | 2023-03-31 | 2022-03-31 | 2021-03-31 |
|---|---|---|---|---|---|
| Sales | 12.03B | 42.64B | 37.69B | 40.71B | 25.67B |
| Cost Of Goods | 7.45B | 27.03B | 21.26B | 25.53B | 15.09B |
| Gross Profit | 4.59B | 15.61B | 16.42B | 15.19B | 10.58B |
| Operating Expense Selling General And Administrative | 1.12B | 1.30B | 1.29B | 927.90M | 530.20M |
| Operating Expense Other Operating Expenses | 1.23B | 6.85B | 7.27B | 6.97B | 5.32B |
| Operating Income | -271.50M | 4.58B | 3.78B | 2.31B | 74.80M |
| Non Operating Interest Income | 117.80M | 310.40M | 51.80M | 66.70M | 365.00M |
| Non Operating Interest Expense | 457.50M | 355.10M | 342.20M | 521.80M | 707.00M |
| Pretax Income | -1.79B | 4.50B | 4.96B | 2.05B | -165.10M |
| Income Tax | -302.60M | 1.45B | 1.73B | 504.40M | -14.40M |
| Net Income | -1.57B | 603.80M | 2.65B | 1.62B | -336.10M |
| Eps Basic | -14.24 | 4.57 | 24.34 | 14.91 | -2.73 |
| Eps Diluted | -14.24 | 4.56 | 24.34 | 14.91 | -2.73 |
| Basic Shares Outstanding | 110.49M | 111.70M | 111.70M | 111.70M | 111.70M |
| Diluted Shares Outstanding | 110.49M | 111.70M | 111.70M | 111.70M | 111.70M |
| Ebit | -1.33B | 4.85B | 5.30B | 2.57B | 541.90M |
| Ebitda | 2.10B | 7.27B | 6.22B | 4.85B | 2.85B |
| Net Income Continuous Operations | -1.92B | 738.20M | 4.06B | 2.15B | -450.10M |
| Minority Interests | -38.40M | -98.50M | 73.30M | 48.30M | 31.70M |
| Preferred Stock Dividends | 0.00 | 0.00 | 0.00 | 0.00 | 0.00 |
Source: Financial statements and regulatory filings
Balance Sheet
| fiscal_date | 2025-03-31 | 2024-03-31 | 2023-03-31 | 2022-03-31 | 2021-03-31 |
|---|---|---|---|---|---|
| Cash And Cash Equivalents | 7.43B | 3.37B | 434.90M | 348.20M | 505.40M |
| Accounts Receivable | 1.05B | 1.66B | 1.56B | 2.17B | 1.58B |
| Total Assets | 165.33B | 105.10B | 84.52B | 77.39B | 66.93B |
| Total Liabilities | 126.45B | 64.15B | 44.13B | 38.62B | 30.46B |
| Long Term Debt | 37.09B | 23.74B | 4.18B | 4.00B | 8.86B |
| Shareholders Equity | 38.88B | 40.95B | 40.39B | 38.77B | 36.47B |
Source: Financial statements and regulatory filings
Cash Flow Statement
| fiscal_date | 2025-03-31 | 2024-03-31 | 2023-03-31 | 2022-03-31 | 2021-03-31 |
|---|---|---|---|---|---|
| Operating Activities Net Income | -1.92B | 738.20M | 4.06B | 2.15B | -450.10M |
| Operating Activities Stock Based Compensation | 117.80M | 111.60M | 0.00 | N/A | N/A |
| Operating Activities Other Non Cash Items | 379.50M | 350.50M | 400.10M | 331.00M | 245.40M |
| Operating Activities Accounts Receivable | -375.80M | -159.60M | 428.70M | -605.90M | 201.10M |
| Operating Activities Other Assets Liabilities | -18.92B | -7.27B | -1.89B | -5.41B | 323.40M |
| Operating Activities Operating Cash Flow | -20.72B | -6.23B | 3.00B | -3.53B | 319.80M |
| Investing Activities Capital Expenditures | -1.20B | -1.75B | 121.10M | -1.26B | -852.90M |
| Investing Activities Investing Cash Flow | -1.20B | -2.70B | 21.10M | -1.90B | -1.25B |
| Financing Activities Long Term Debt Issuance | 20.89B | 19.80B | 4.94B | 3.77B | 4.66B |
| Financing Activities Long Term Debt Payments | -311.00M | -4.31B | -5.86B | -4.01B | -7.71B |
| Financing Activities Short Term Debt Issuance | 4.44B | 35.00M | -3.43B | 3.11B | -133.00M |
| Financing Activities Common Stock Issuance | 63.50M | N/A | N/A | N/A | N/A |
| Financing Activities Common Dividends | -553.20M | -554.10M | -446.80M | -114.80M | -336.80M |
| Financing Activities Other Financing Charges | -714.00M | -464.00M | 14.10M | 198.30M | 141.10M |
| Financing Activities Financing Cash Flow | 23.81B | 14.51B | -4.79B | 2.95B | -3.38B |
| End Cash Position | 7.99B | 3.12B | -1.20B | 236.60M | 442.50M |
| Free Cash Flow | -15.80B | -4.96B | 1.50B | -1.80B | 4.78B |
| Investing Activities Net Acquisitions | N/A | 0.00 | -100.00M | 342.20M | 0.00 |
| Investing Activities Other Investing Activity | N/A | -950.00M | N/A | N/A | N/A |
| Investing Activities Purchase Of Investments | N/A | N/A | N/A | -982.80M | -423.40M |
| Investing Activities Sale Of Investments | N/A | N/A | N/A | N/A | 21.30M |
Source: Financial statements and regulatory filings
Technical Analysis
Key Insights
- The current trend shows a significant downtrend with the stock price recently hitting a 52-week low near ₹1142.45, indicating bearish momentum.
- Key support levels are observed around ₹1080, the 52-week low, while resistance is noted near the 50-day moving average at ₹1248 and the 200-day moving average at ₹1660.
- The stock is trading below both the 50-day and 200-day moving averages, suggesting sustained downward pressure in the medium to long term.
- Momentum indicators show a low Relative Strength Index (RSI), indicating oversold conditions; MACD remains negative, confirming bearish momentum; stochastic oscillator also signals weak momentum.
- Across daily, weekly, and monthly timeframes, the price action consistently reflects a bearish trend with no significant reversal signals.
- Potential market scenarios include continued consolidation near support levels or further downside if the stock fails to breach resistance moving averages.
Trending News
Summary: AB Capital Share Price: Find the latest news on AB Capital Stock Price. Get all the information on AB Capital with historic price charts for NSE / BSE. Experts & Broker view also get the AB Capital Ltd. buy/sell tips detailed news, announcements, Forecasts, Analysts, Valuation, Earning forecasts, ...
Sentiment: neutral
2. Headline: Aditya Birla Fashion & Retail Ltd Gains 1.07%: 2 Key Factors Driving the Weekly Move
Summary: Aditya Birla Fashion & Retail Ltd closed the week with a modest gain of 1.07%, ending at Rs.57.68 on 2 April 2026, outperforming the Sensex which declined by 0.29% over the same period. The week was marked by a sharp drop to a 52-week low followed by a strong intraday rebound, reflecting a ...
Sentiment: positive
3. Headline: Aditya Birla Real Estate Receives Independent ESG Rating of 67.4 for FY2025
Summary: Aditya Birla Real Estate Limited received an independent ESG rating of 67.4 for FY2025 from SES ESG Research Pvt. Ltd., as disclosed to stock exchanges on 31st March, 2026. The rating was assigned without company engagement, based on publicly available FY2024-25 information, and is now available ...
Sentiment: neutral
4. Headline: Aditya Birla Real Estate aims ₹1,700 cr revenue from 1st housing project | Company News - Business Standard
Summary: Aditya Birla Real Estate Ltd (ABREL) will redevelop a housing society in Mumbai and expects a revenue of Rs 1,700 crore from free-saleable area.
Sentiment: neutral
5. Headline: Aditya Birla: Rs 1,700 Cr Revenue from Mumbai Project: Rediff Moneynews
Summary: Aditya Birla Real Estate Ltd to redevelop Mumbai housing society, expecting Rs 1,700 crore revenue. First redevelopment project in MMR.
Sentiment: neutral
6. Headline: Aditya Birla Real Estate Ltd Announces Redevelopment Project In Mumbai — TradingView News
Summary: Aditya Birla Real Estate Ltd NSE:ABREL:
Sentiment: neutral
Summary: Press releases, portfolio company news, and timely updates on our business.
Sentiment: neutral
8. Headline: IPL 2026 - RCB sold for USD 1.78 billion to consortium comprising Aditya Birla Group, Times of India | ESPNcricinfo
Summary: Both men's and women's teams will now be "owned and operated" by the consortium
Sentiment: neutral
9. Headline: RCB sold for USD 1.78 billion to consortium comprising Aditya Birla Group, Times of India - ESPN
Summary: Both men's and women's teams will now be "owned and operated" by the consortium | ESPN.com
Sentiment: neutral
10. Headline: Aditya Birla Real Estate Ltd Stock Hits 52-Week Low Amidst Continued Downtrend
Summary: Aditya Birla Real Estate Ltd has touched a new 52-week low of Rs.1142.45 today, marking a significant decline in its share price amid broader market weakness and company-specific financial pressures.
Sentiment: negative
Recent Updates
News Summary
Recent news surrounding Aditya Birla Real Estate Ltd. highlights a mix of strategic developments and market challenges. The company has announced a significant redevelopment project in Mumbai, expected to generate substantial revenue, reinforcing its growth focus in urban real estate. Despite this, the stock has faced downward pressure, hitting a 52-week low amid financial headwinds and market volatility. The company also received an independent ESG rating, reflecting ongoing efforts in sustainability. Market sentiment remains cautious as reflected in a strong sell rating by Markets Mojo, while institutional commentary points to concerns over the company's debt levels. Overall, these developments underscore a transitional phase with growth initiatives juxtaposed against operational and financial challenges.
News Sentiment
Sentiment across recent updates is mixed to neutral, with positive signals from strategic project announcements and ESG ratings balanced by negative financial performance and market price declines. The presence of a strong sell rating contrasts with positive institutional insights on debt management, indicating divergent views on near-term prospects. This nuanced sentiment suggests a complex market perception influenced by both growth potential and risk factors.
Analytical Overview
Analysis Summary
Valuation metrics for Aditya Birla Real Estate Ltd. show a trailing P/E ratio of 163.88, significantly higher than typical industry averages, indicating elevated valuation relative to current earnings. The forward P/E of 9.16 suggests market expectations of improved profitability ahead.
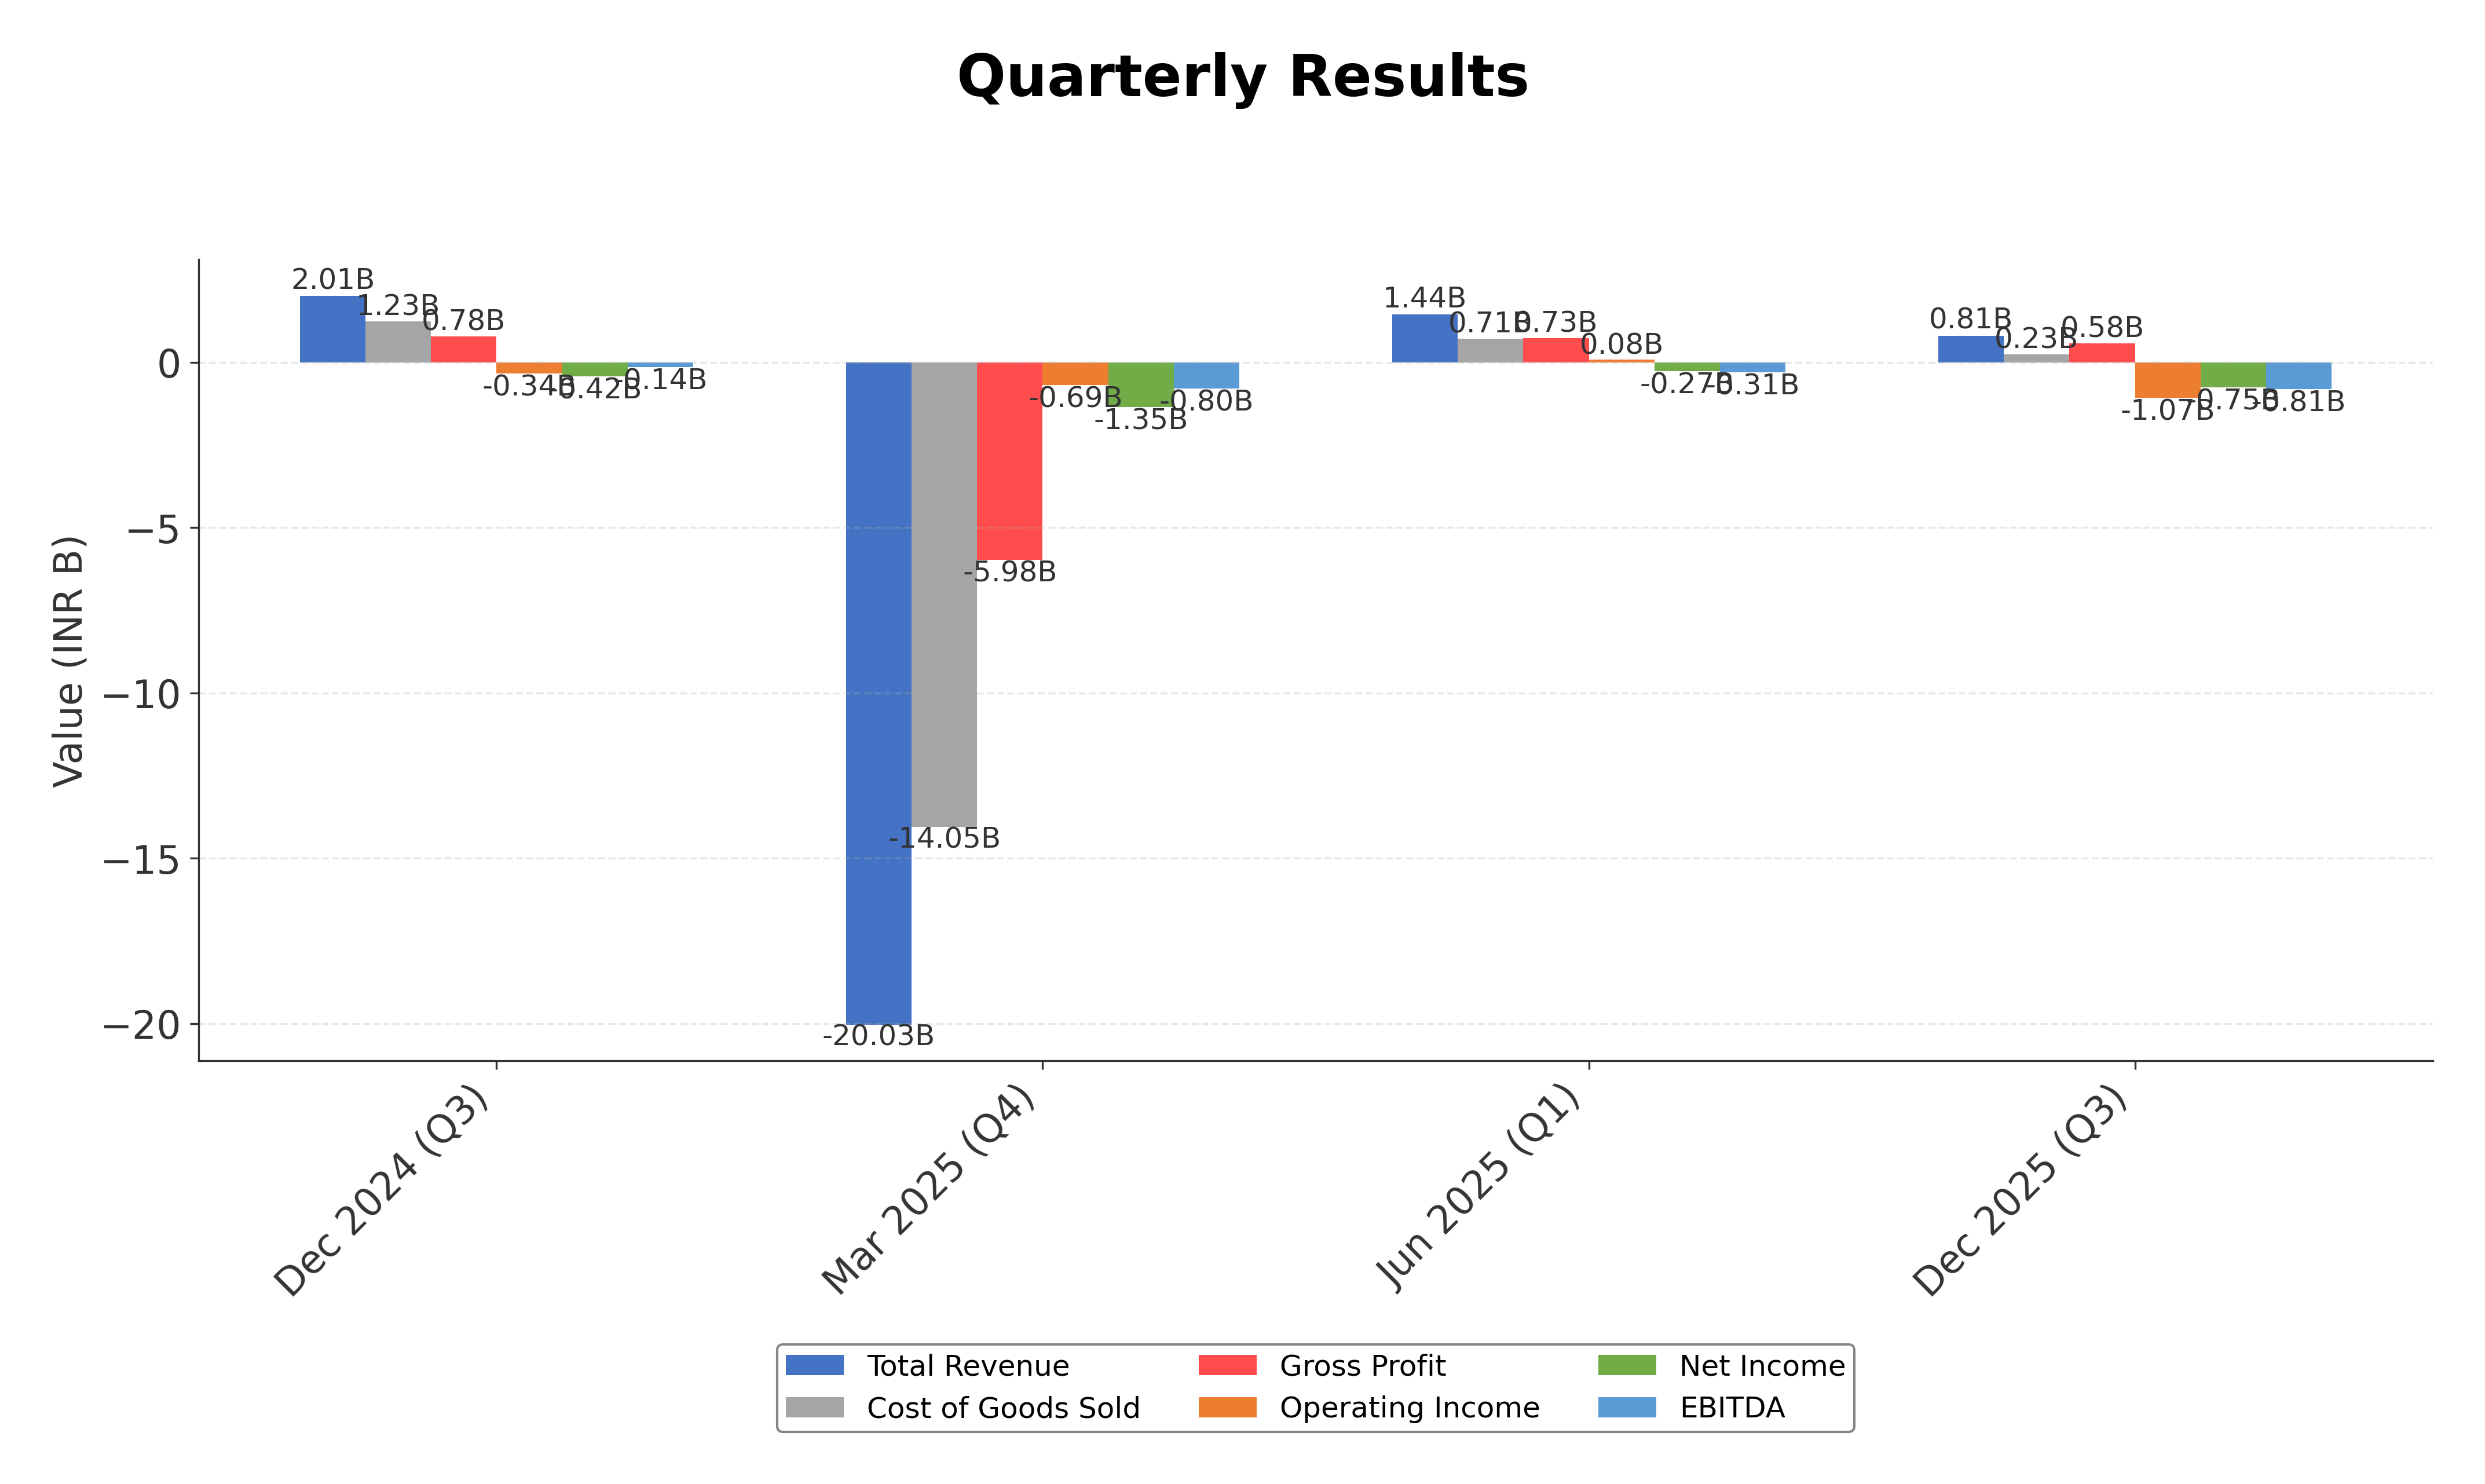
The company’s revenue growth is negative at -91.5% quarterly, and operating cash flow is substantially negative at approximately INR -20.7 billion TTM, reflecting near-term operational challenges and cash flow constraints.
Financial health is pressured by a high debt-to-equity ratio of 144.58%, with total debt of about INR 54.9 billion against cash reserves of INR 12.05 billion, indicating leverage risks and potential liquidity concerns.
Sector-specific challenges include cyclical real estate market conditions and regulatory complexities in India, while opportunities arise from urban redevelopment projects and sustainability initiatives.
Considering India-specific factors, the regulatory environment remains dynamic with increasing focus on ESG compliance, while consumer trends favor modern urban living spaces, positioning ABREL to leverage its redevelopment projects amid economic growth prospects.
Overall Business and Market Assessment
Supporting Factors: Primary supporting factors include the company’s strategic redevelopment projects with significant revenue potential, strong backing from the Aditya Birla Group, and improving ESG credentials.
Risk Factors: Main risks involve sustained net losses, negative operating cash flows, and high leverage that could impact financial flexibility.
SWOT Analysis
Strengths
- Strong brand affiliation with the Aditya Birla Group.
- Significant asset base with total assets of ₹165.33 billion.
- Strategic focus on urban redevelopment projects in key markets.
- Commitment to sustainability reflected in an independent ESG rating.
Weaknesses
- Negative net income and profit margins indicating operational losses.
- High debt-to-equity ratio of 144.58% increasing financial risk.
- Negative operating and free cash flows impacting liquidity.
- Elevated trailing P/E ratio suggesting overvaluation relative to earnings.
Opportunities
- Revenue growth potential from redevelopment projects like the Mumbai housing society.
- Increasing demand for sustainable and modern urban living spaces in India.
- Potential institutional accumulation indicating market interest.
- Favorable regulatory trends supporting ESG and real estate development.
Threats
- Market volatility leading to significant share price declines.
- Economic and regulatory uncertainties in the Indian real estate sector.
- Competitive pressures from other real estate developers.
- Risks associated with high leverage and cash flow constraints.
Company Description
Aditya Birla Real Estate Ltd. is a prominent entity in the real estate industry, focusing on the development of high-quality urban infrastructure and residential projects. As part of the Aditya Birla Group, a renowned multinational conglomerate with a legacy in diverse industries, the company's primary function is to develop and manage residential, commercial, and mixed-use properties. Aditya Birla Real Estate Ltd. is dedicated to creating sustainable and innovative living spaces that cater to modern urban demands. The company’s ventures predominantly influence sectors such as residential housing, office spaces, and retail complexes, emphasizing cutting-edge design and environmentally sustainable development practices. Aditya Birla Real Estate Ltd. holds a significant position in the market, leveraging its parent group's extensive financial and operational strengths to foster urban growth and meet the evolving needs of India’s rapidly expanding urban landscapes. Its efforts contribute significantly to urban development by enhancing infrastructure quality and providing contemporary lifestyle solutions.