
Aditya Birla Fashion and Retail Ltd (ABFRL)
Stock Analysis Report
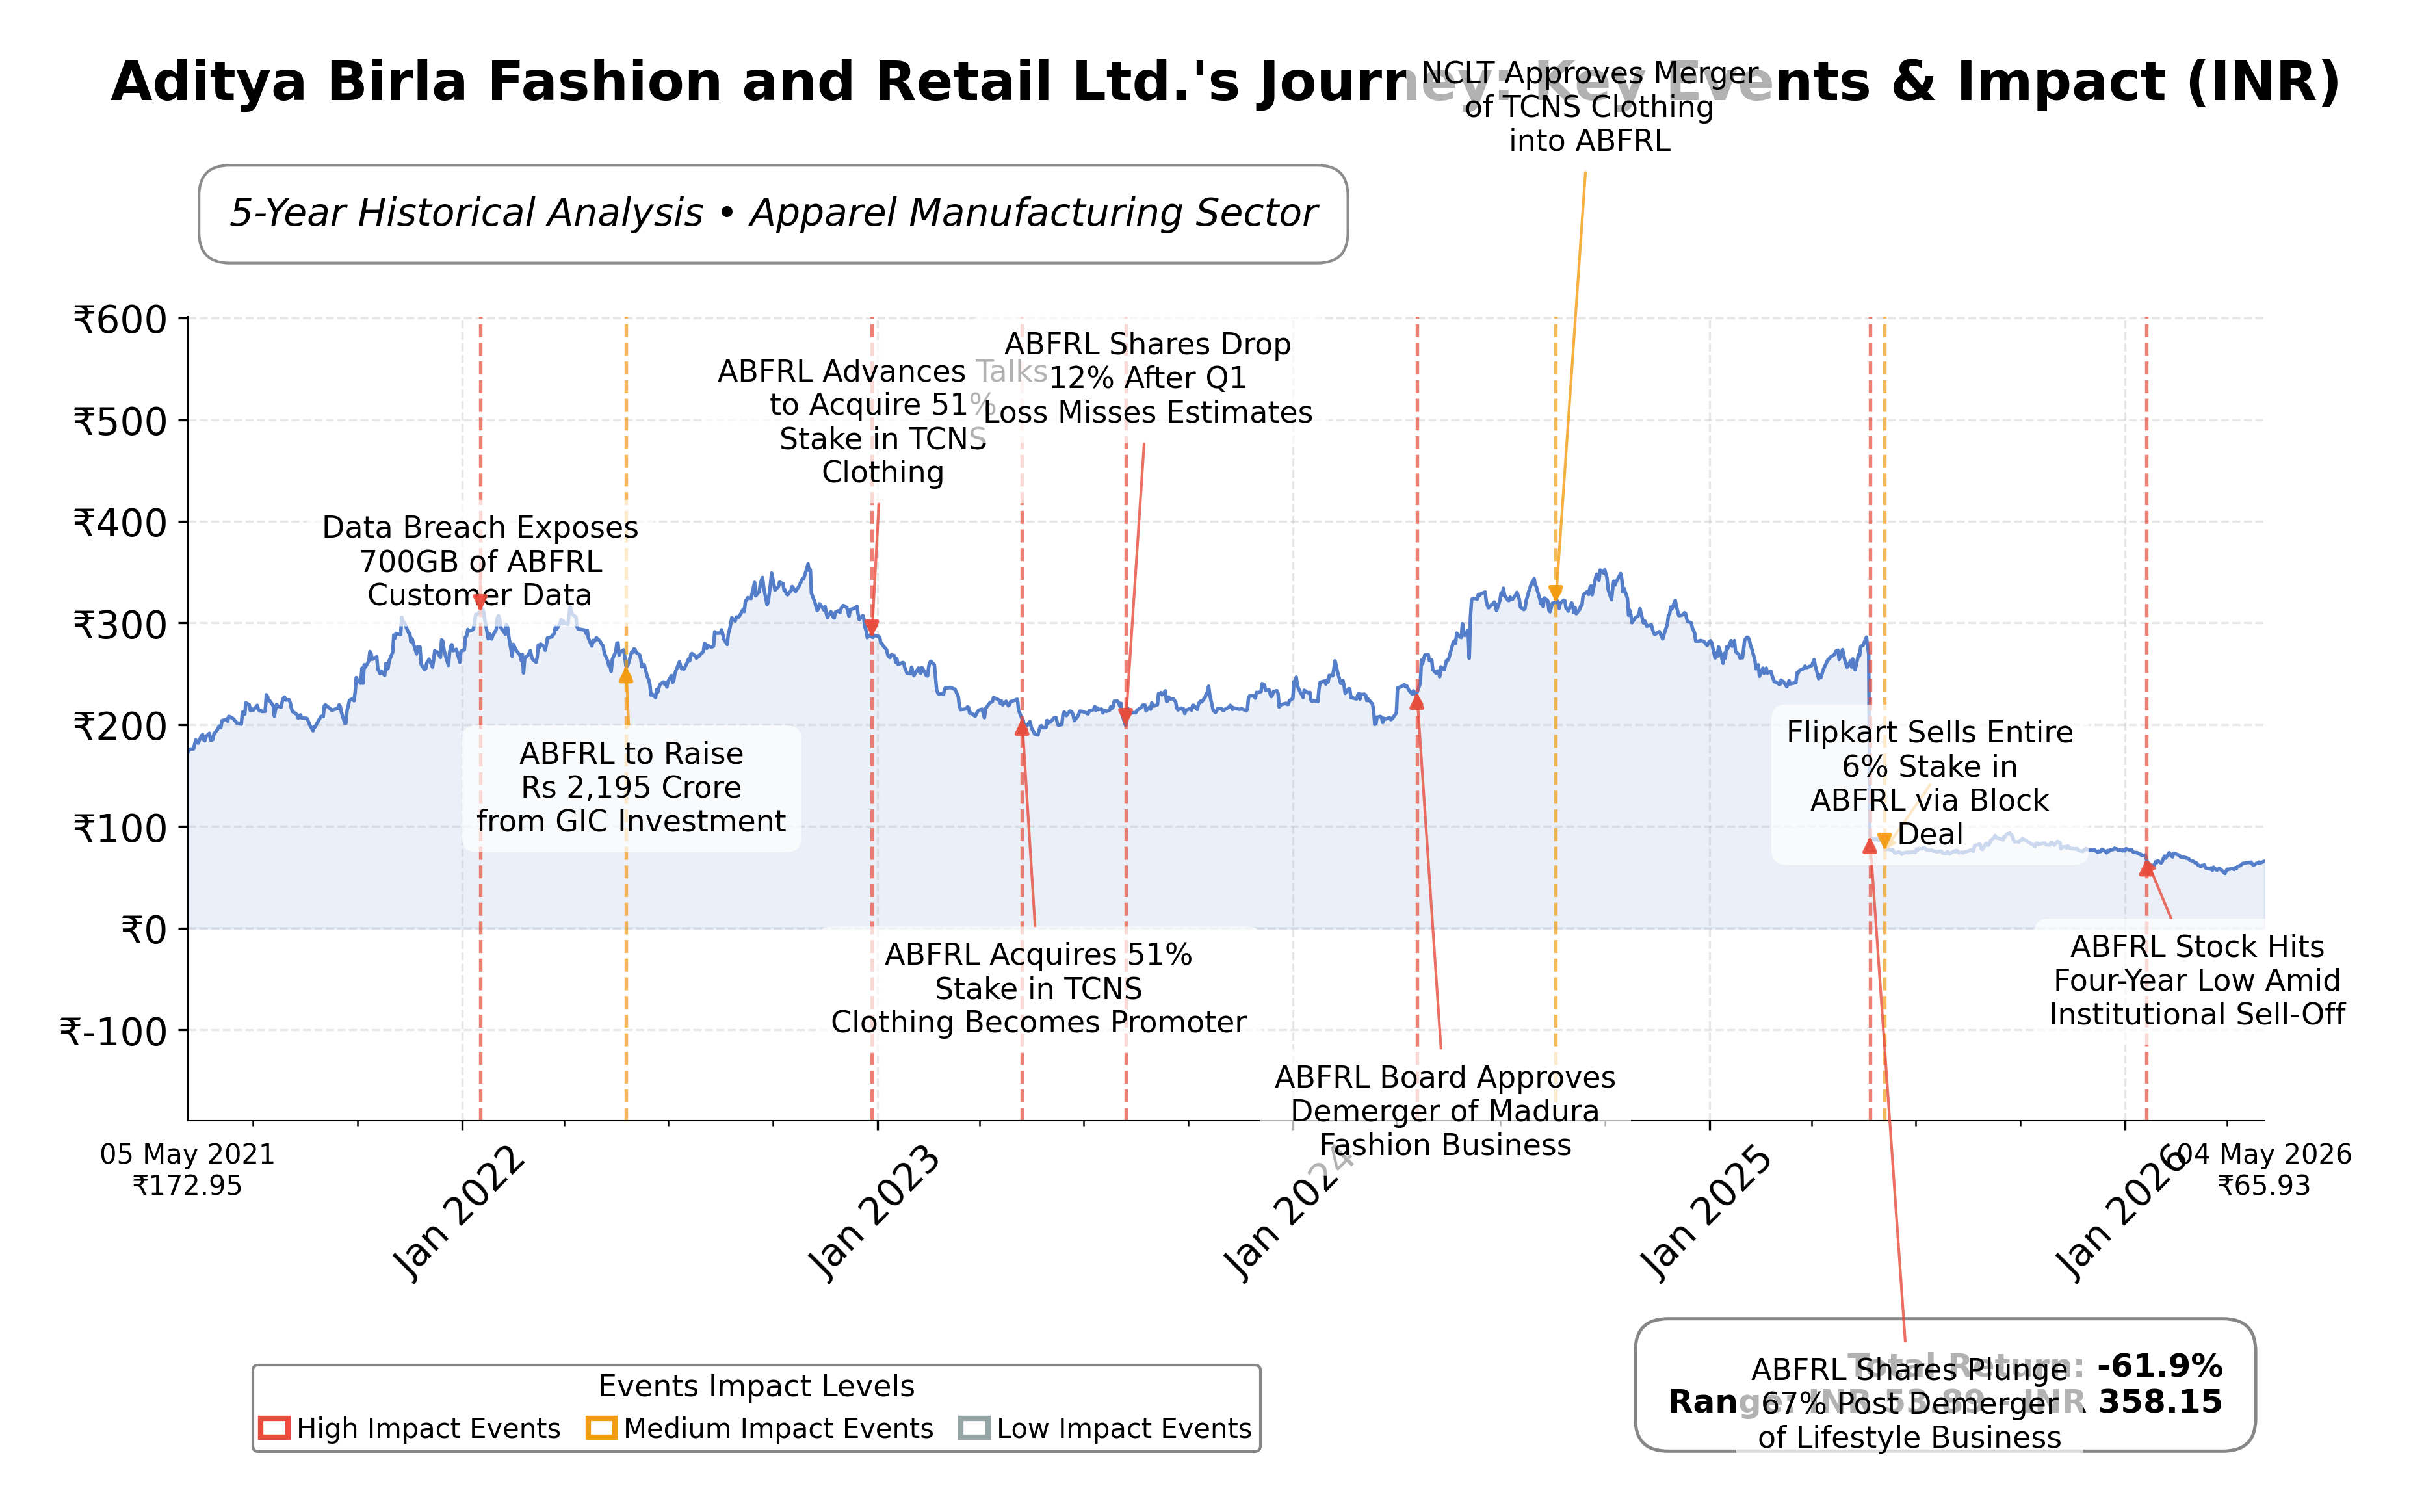
Stock Journey
Key Positives and Key Risks
Pros
- Forward P/E ratio of 10.31 indicates market expectations for earnings improvement relative to current high trailing P/E of 96.27.
- Strong cash reserves of approximately ₹21.5 billion provide liquidity support amid operational challenges.
- Strategic focus on premiumization and digital expansion aligns with growth opportunities in the Indian apparel market.
Cons
- Negative net income margin of -3.65% and negative ROE of -5.52% highlight ongoing profitability issues.
- High debt-to-equity ratio of 84.68% increases financial leverage and risk exposure.
- Negative operating cash flow of ₹-2.87 billion and free cash flow of ₹-3.76 billion indicate cash generation difficulties.
Disclosure: This information is for general awareness and does not constitute investment advice
Report Summary
Aditya Birla Fashion and Retail Ltd. (ABFRL) operates as a prominent entity in the Indian apparel manufacturing industry, listed on the NSE under the consumer cyclical sector. The company offers a diverse portfolio of fashion products through well-known brands such as Louis Philippe, Van Heusen, Allen Solly, Peter England, and Pantaloons. It maintains a significant presence across metropolitan and tier II and III cities in India, leveraging both physical retail outlets and digital platforms. ABFRL’s business model integrates branded fashion and retail operations, positioning it as a key player in the evolving Indian fashion landscape.
Financially, ABFRL reported trailing twelve months (TTM) revenue of approximately ₹76.89 billion with a gross margin of 58.8%, indicating strong top-line efficiency. However, the company posted a net loss margin of -3.65% and an operating margin of 8.88%, reflecting challenges in profitability. Return on equity (ROE) and return on assets (ROA) were negative at -5.52% and -2.26%, respectively, signaling inefficiencies in capital utilization and asset management. The company’s operating cash flow and free cash flow were negative at ₹-2.87 billion and ₹-3.76 billion TTM, underscoring cash generation pressures.
Valuation metrics reveal a high trailing P/E ratio of 96.27, contrasting with a forward P/E of 10.31, suggesting market expectations of improved earnings ahead. The price-to-book ratio stands at 1.24, and the enterprise value to EBITDA ratio is notably elevated at 197.15, indicating potentially stretched valuation relative to earnings. The stock trades at ₹66, near its 52-week low of ₹53.51 and significantly below the 52-week high of ₹295.70, reflecting considerable price volatility and market uncertainty.
ABFRL’s strengths include a robust brand portfolio, extensive retail network, and strong cash reserves of approximately ₹21.5 billion, albeit offset by substantial debt of ₹56.65 billion and a debt-to-equity ratio of 84.68%. Key risks encompass ongoing profitability challenges, high leverage, and competitive pressures within the apparel sector. Recent strategic initiatives focus on premiumization, network expansion, and digital growth, with management targeting mid- to high-single-digit growth in Pantaloons and breakeven timelines for emerging brands such as TCNS and TMRW.
Technically, the stock exhibits mixed signals with recent price momentum shifts and trading below major moving averages, indicating investor caution. The current market setup suggests a complex sentiment environment where accumulation or realization of gains may be influenced by forthcoming earnings and strategic execution. Overall, the data portrays a company navigating operational headwinds with strategic initiatives underway, warranting close observation of financial and market developments.
Company and Industry Overview
Company Basics
Price Performance
Company Size
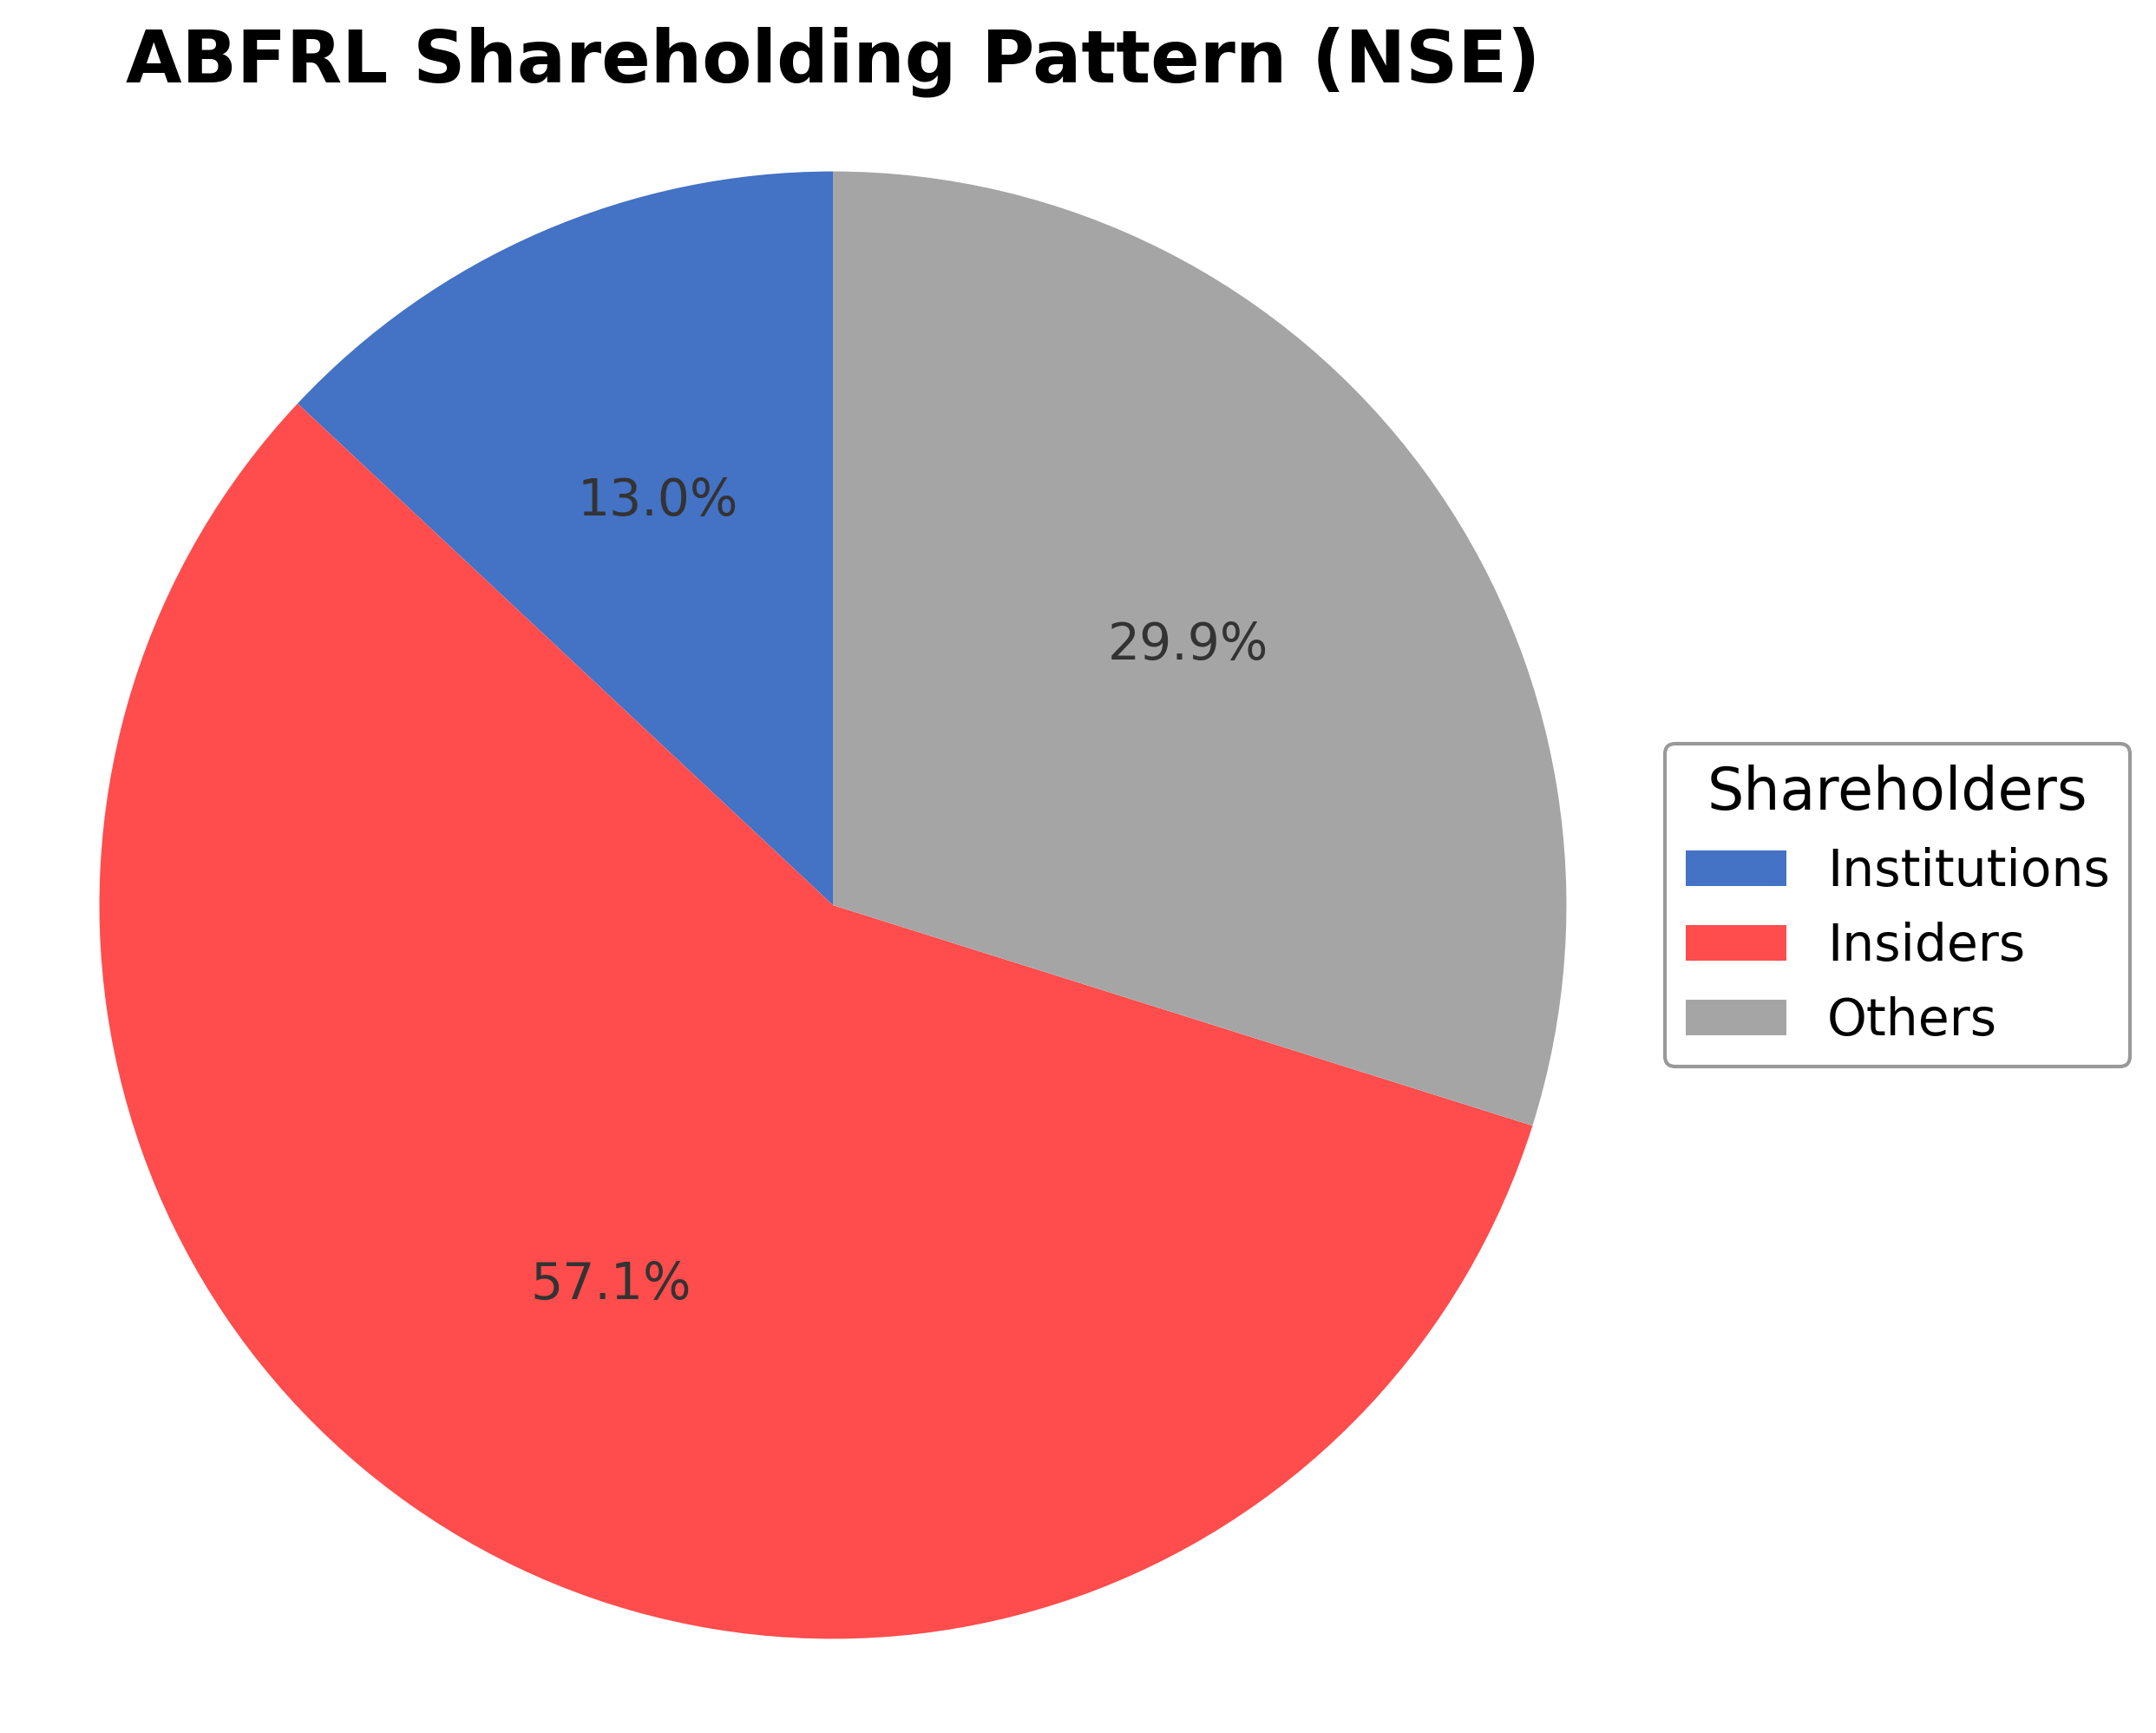
Shareholding Pattern
Sector and Industry Analysis
The Indian fashion and retail sector is a rapidly expanding market, projected to reach approximately $100 billion by the mid-2020s, driven by rising disposable incomes and urbanization. The sector encompasses diverse segments including apparel, footwear, and accessories, with key players such as Aditya Birla Fashion and Retail Ltd (ABFRL), Trent, and Reliance Retail dominating the landscape. Growth is fueled by increasing consumer demand for branded and value fashion, supported by an extensive retail network and e-commerce penetration.
Industry trends highlight a shift towards lifestyle and ethnic wear, with companies like ABFRL expanding through acquisitions and new brand launches to capture evolving consumer preferences. Competitive dynamics are characterized by aggressive store expansions, entry into new categories such as footwear and beauty, and a growing focus on direct-to-consumer (D2C) platforms. Barriers to entry include brand recognition, distribution scale, and capital intensity, which favor established players with robust balance sheets and diversified portfolios.
The regulatory environment in India’s retail sector includes policies on foreign direct investment (FDI), taxation such as GST, and compliance with labor and environmental laws. Recent reforms have facilitated greater FDI inflows, enabling international brands to enter and expand operations. Ongoing regulatory clarity and infrastructure development are expected to support sector growth, although companies must navigate complex compliance requirements and evolving consumer protection norms.
Note: Analysis synthesized from industry research, market reports, and regulatory filings. Information is subject to change based on market conditions.
Financial Ratios Dashboard
Illustrative Scenario Analysis
DCF Assumptions:
Method: Two-Stage EPS-Priority Model
Financials
Peer Analysis
| Company Name | Market Cap | P/E Ratio | P/B Ratio | EV/EBITDA | Price to CFO |
|---|---|---|---|---|---|
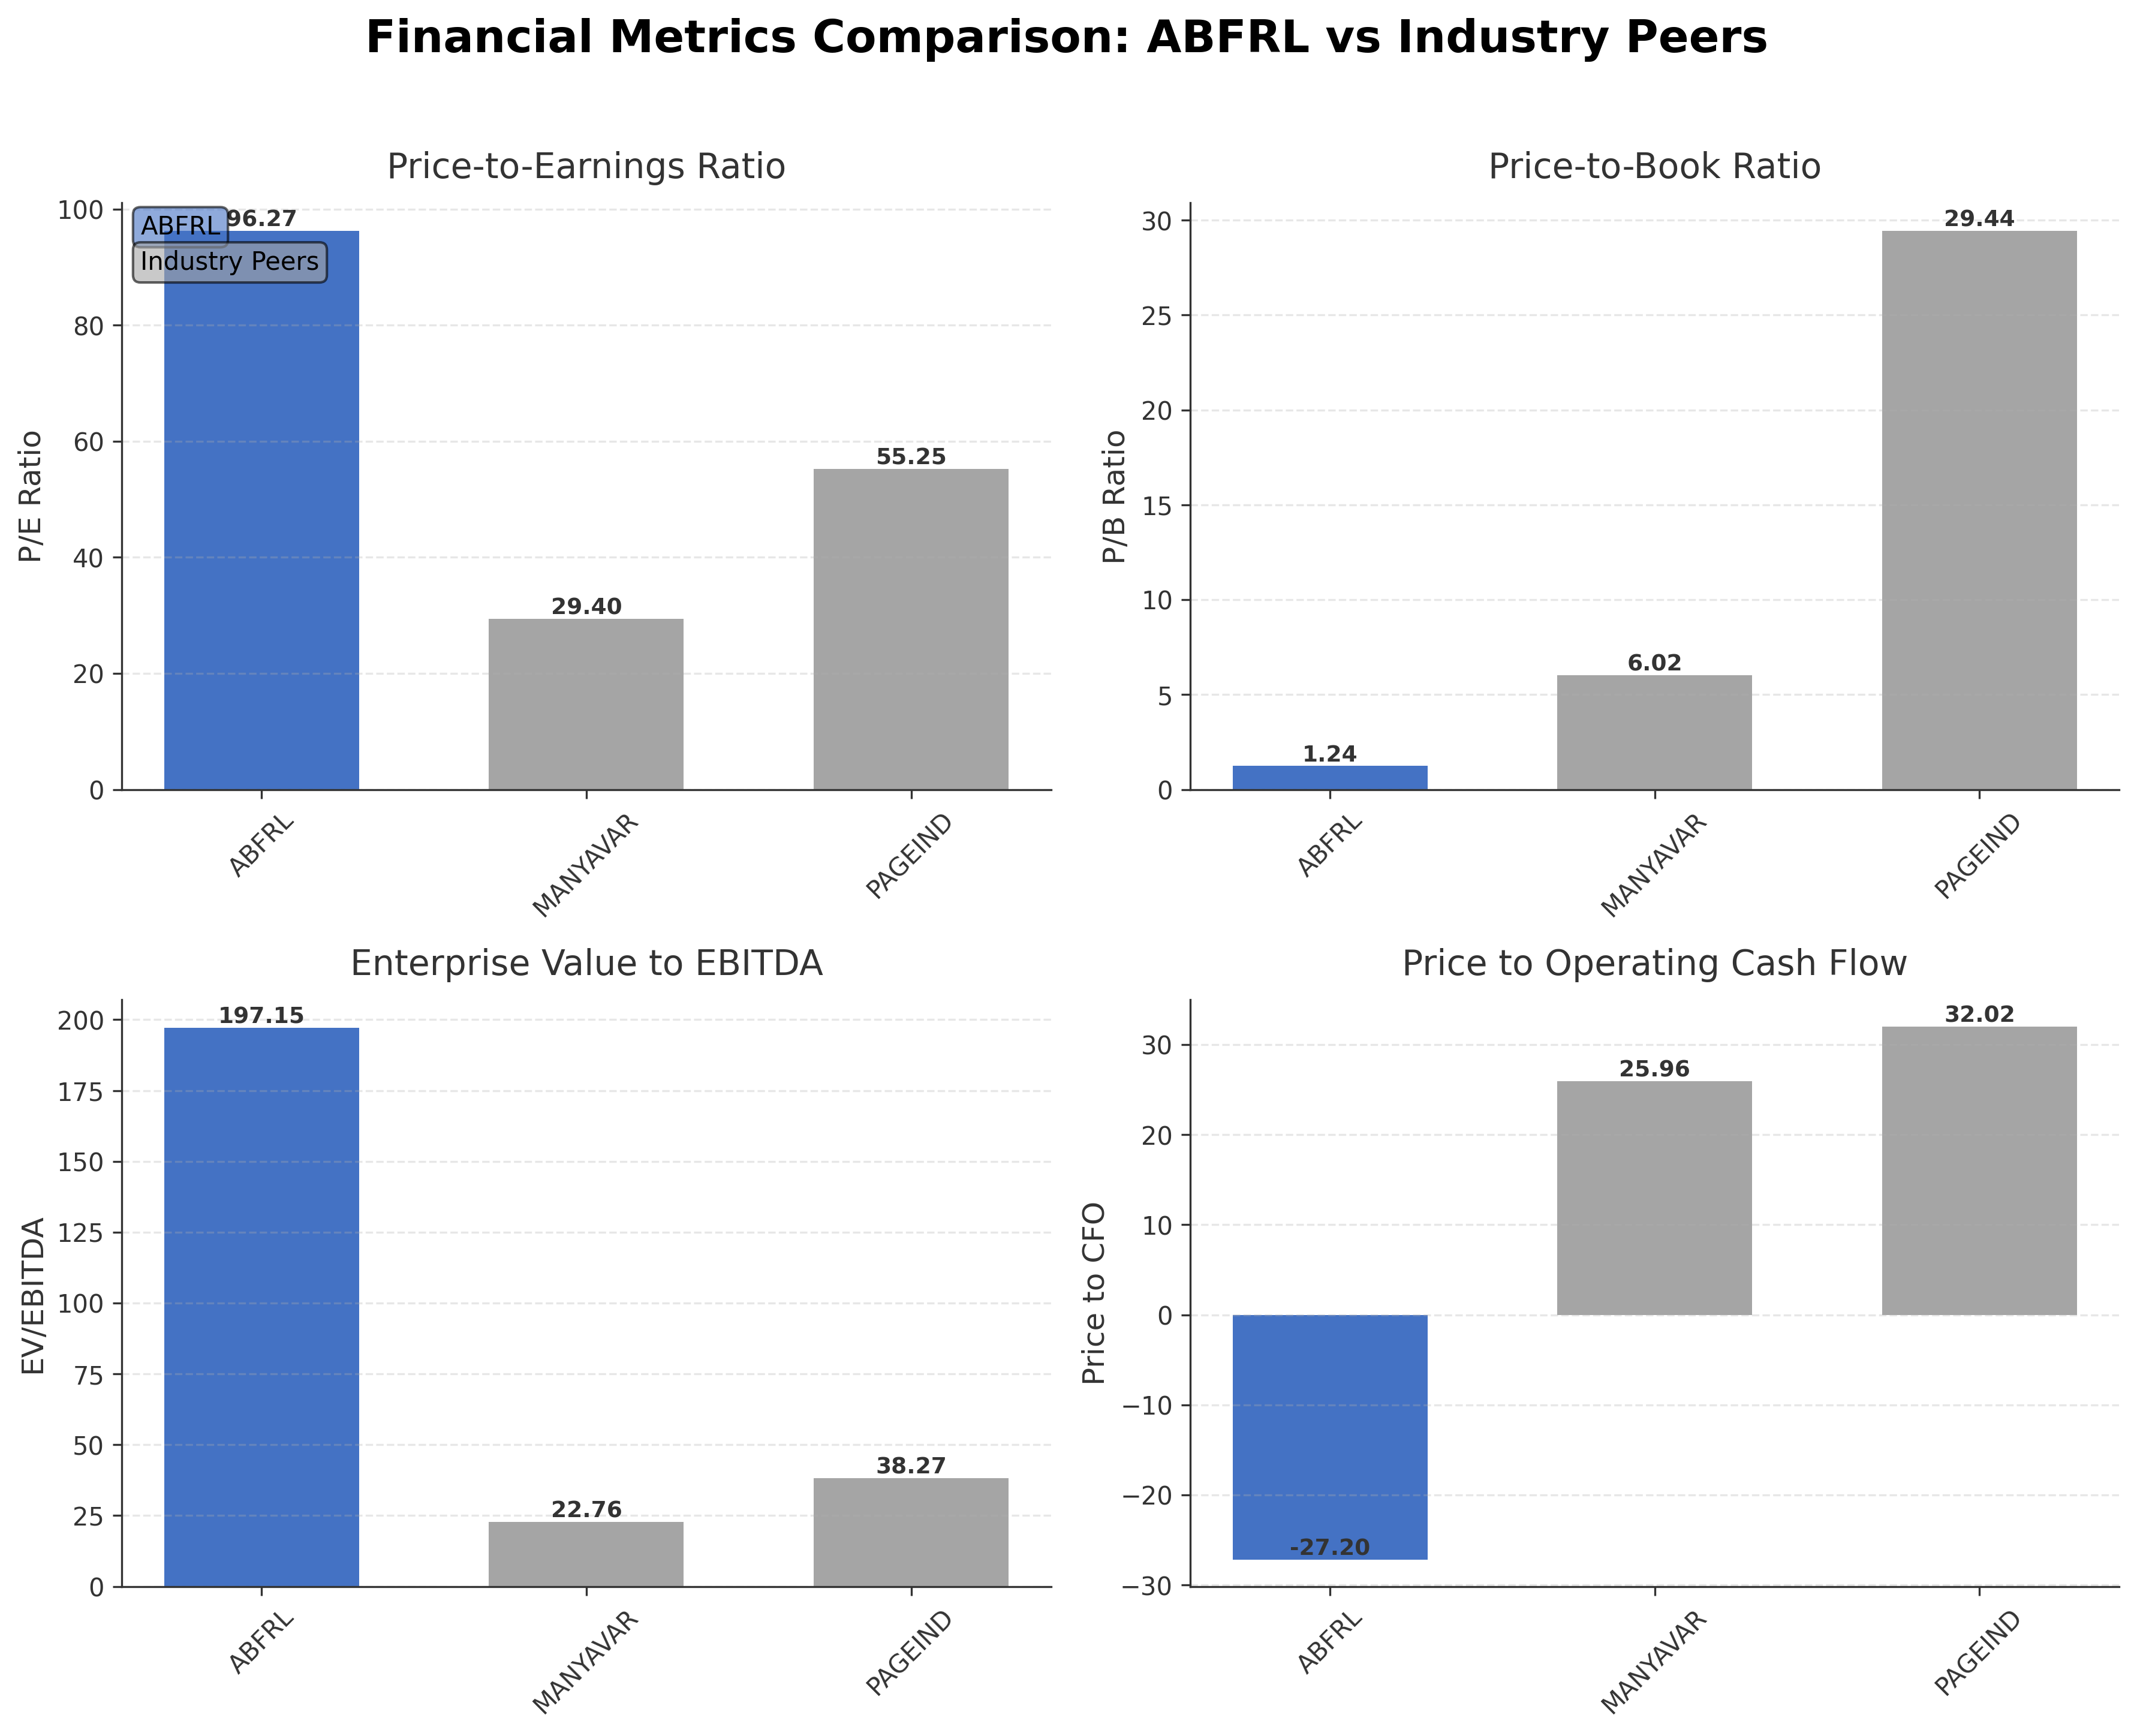
| Aditya Birla Fashion and Retail Ltd. | ₹78.09B | 96.27 | 1.24 | 197.15 | -27.20 |
| Vedant Fashions Ltd. | ₹103.74B | 29.40 | 6.02 | 22.76 | 25.96 |
| Page Industries Ltd. | ₹410.30B | 55.25 | 29.44 | 38.27 | 32.02 |
Comparison Analysis: Aditya Birla Fashion and Retail Ltd. displays a significantly higher trailing P/E ratio of 96.27 compared to peers Vedant Fashions Ltd. at 29.40 and Page Industries Ltd. at 55.25, indicating a premium valuation or market expectations for turnaround. Its price-to-book ratio of 1.24 is substantially lower than peers, suggesting a more conservative book value pricing. The enterprise value to EBITDA ratio is markedly elevated at 197.15, far exceeding peer levels of 22.76 and 38.27, reflecting lower current earnings or higher leverage. Negative price to CFO ratio contrasts with positive cash flow metrics of peers, highlighting cash flow challenges. Return on equity is negative at -0.06%, while peers maintain modest positive returns, underscoring relative profitability weaknesses. Overall, ABFRL appears stretched on valuation and profitability metrics relative to its regional apparel industry peers.
Financial Metrics Comparison with Peers
Financial Statements
Comprehensive financial data including income, balance sheet, and cash flow metrics
Income Statement
| fiscal_date | 2025-03-31 | 2024-03-31 | 2023-03-31 | 2022-03-31 | 2021-03-31 |
|---|---|---|---|---|---|
| Sales | 73.09B | 139.30B | 123.63B | 80.93B | 52.13B |
| Cost Of Goods | 31.94B | 63.07B | 55.85B | 37.44B | 25.83B |
| Gross Profit | 41.15B | 76.23B | 67.78B | 43.49B | 26.30B |
| Operating Expense Selling General And Administrative | 8.61B | 12.43B | 10.67B | 5.71B | 3.73B |
| Operating Expense Other Operating Expenses | 12.33B | 21.16B | 17.39B | 11.20B | 8.23B |
| Operating Income | -4.48B | -1.24B | 3.38B | 1.51B | -3.69B |
| Non Operating Interest Income | 108.10M | 262.60M | 102.10M | 93.80M | 24.20M |
| Non Operating Interest Expense | 5.59B | 8.72B | 4.71B | 3.48B | 4.93B |
| Pretax Income | -7.18B | -8.29B | -824.40M | -1.45B | -8.38B |
| Income Tax | -942.10M | -929.90M | -229.70M | -265.70M | -1.02B |
| Net Income | -4.56B | -7.36B | -594.70M | -1.18B | -7.36B |
| Eps Basic | -3.53 | -6.52 | -0.38 | -1.18 | -8.23 |
| Eps Diluted | -3.53 | -6.52 | -0.38 | -1.18 | -8.23 |
| Basic Shares Outstanding | 1.06B | 964.34M | 947.73M | 924.93M | 816.70M |
| Diluted Shares Outstanding | 1.06B | 964.34M | 947.73M | 924.93M | 816.70M |
| Ebit | -1.60B | 434.50M | 3.89B | 2.03B | -3.45B |
| Ebitda | 12.39B | 15.43B | 15.26B | 11.35B | 5.66B |
| Net Income Continuous Operations | -4.87B | -8.29B | -824.40M | -1.45B | -8.38B |
| Minority Interests | 800.00M | 1.08B | 234.70M | 96.40M | 634.90M |
| Preferred Stock Dividends | 0.00 | 0.00 | 0.00 | 0.00 | 0.00 |
Source: Financial statements and regulatory filings
Balance Sheet
| fiscal_date | 2025-03-31 | 2024-03-31 | 2023-03-31 | 2022-03-31 | 2021-03-31 |
|---|---|---|---|---|---|
| Cash And Cash Equivalents | 7.67B | 4.54B | 6.93B | 1.18B | 2.46B |
| Accounts Receivable | 3.73B | 12.79B | 8.86B | 7.56B | 6.08B |
| Total Assets | 166.40B | 224.11B | 170.41B | 124.07B | 102.61B |
| Total Liabilities | 98.26B | 176.90B | 136.95B | 96.18B | 75.85B |
| Long Term Debt | 39.71B | 65.98B | 48.54B | 28.54B | 25.68B |
| Shareholders Equity | 68.13B | 47.21B | 33.46B | 27.89B | 26.76B |
Source: Financial statements and regulatory filings
Cash Flow Statement
| fiscal_date | 2025-03-31 | 2024-03-31 | 2023-03-31 | 2022-03-31 | 2021-03-31 |
|---|---|---|---|---|---|
| Operating Activities Net Income | -4.87B | -8.29B | -824.40M | -1.45B | -8.38B |
| Operating Activities Stock Based Compensation | 507.40M | 253.50M | 312.90M | 291.30M | 117.00M |
| Operating Activities Other Non Cash Items | 6.77B | 7.87B | 4.33B | 1.18B | 1.50B |
| Operating Activities Accounts Receivable | -4.15B | -1.74B | -1.08B | -1.54B | 2.25B |
| Operating Activities Other Assets Liabilities | -1.13B | 783.00M | -11.81B | -10.98B | 6.89B |
| Operating Activities Operating Cash Flow | -2.87B | -1.13B | -9.07B | -12.50B | 2.38B |
| Investing Activities Capital Expenditures | -5.93B | -7.41B | -6.71B | -3.18B | -1.59B |
| Investing Activities Net Acquisitions | -2.76B | -16.09B | -1.76B | 0.00 | -516.20M |
| Investing Activities Purchase Of Investments | -7.59B | -190.10B | -127.92B | -100.08B | -124.11B |
| Investing Activities Investing Cash Flow | -16.27B | -30.18B | -3.97B | -5.61B | -8.58B |
| Financing Activities Long Term Debt Issuance | 8.83B | 14.85B | 10.86B | 4.14B | 6.92B |
| Financing Activities Long Term Debt Payments | -20.61B | -3.53B | -4.62B | -7.51B | -8.34B |
| Financing Activities Short Term Debt Issuance | -6.37B | 6.56B | 3.65B | 4.32B | -15.13B |
| Financing Activities Common Stock Issuance | 41.90B | 14.36B | 7.73B | 2.49B | 22.39B |
| Financing Activities Financing Cash Flow | 23.74B | 32.23B | 17.49B | 3.44B | 6.13B |
| End Cash Position | 7.67B | 4.54B | 6.93B | 1.18B | 2.46B |
| Free Cash Flow | 10.09B | 5.94B | -451.20M | 6.03B | 9.43B |
| Investing Activities Sale Of Investments | N/A | 183.41B | 132.41B | 97.65B | 120.83B |
| Financing Activities Common Stock Repurchase | N/A | N/A | -119.10M | N/A | N/A |
| Investing Activities Other Investing Activity | N/A | N/A | N/A | 13.70M | -3.20B |
| Financing Activities Other Financing Charges | N/A | N/A | N/A | -10.00M | 286.60M |
Source: Financial statements and regulatory filings
Technical Analysis
Key Insights
- The current trend shows mixed price action with recent upward movement but overall trading below the 50-day (₹61.82) and 200-day (₹73.99) moving averages, indicating a cautious or bearish intermediate trend.
- Key support levels are identified near the 52-week low at ₹53.51, while resistance is observed near the 52-week high at ₹295.70 and the 50-day moving average around ₹61.82.
- The stock price is currently above the 10-day moving average but remains below the 50-day and 200-day averages, suggesting short-term momentum may be positive but medium to long-term trends are weak.
- Momentum indicators show RSI near neutral levels, MACD reflecting mixed signals with recent convergence, and stochastic oscillators indicating potential oversold conditions on shorter timeframes.
- Multi-timeframe analysis reveals daily charts showing consolidation, weekly charts indicating bearish momentum, and monthly charts reflecting a longer-term downtrend.
- Potential market scenarios include a consolidation phase with volatility around current price levels, with possible recovery if earnings and strategic initiatives improve, or further downside if cash flow and profitability pressures persist.
Trending News
1. Headline: Aditya Birla Capital reports 31% increase in Q4FY26 consolidated net profit at ₹1,129 crore - The HinduBusinessLine
Summary: The consolidated results include the results of 16 entities such as Aditya Birla Housing Finance, Aditya Birla Sun Life Insurance, Aditya Birla Sun Life AMC and Aditya Birla Health Insurance within the ABCL fold
Sentiment: positive
2. Headline: Aditya Birla Capital Q4 profit jumps 31%, NII climbs 27%; ₹2 lakh crore borrowing plan cleared - CNBC TV18
Summary: Aditya Birla Capital reported a 31% rise in Q4 net profit to ₹1,128 crore and a 27.4% increase in NII, while FY26 profit after tax rose 21% to ₹3,797 crore. The board also approved a higher borrowing limit of ₹2 lakh crore and cleared fundraising through debt securities, including NCDs, ...
Sentiment: positive
3. Headline: Why Aditya Birla’s ethnic wear brand TCNS is holding back on Q-commerce
Summary: At a time when fashion brands are experimenting with 30-minute deliveries and “instant wardrobes", TCNS Clothing, now part of Aditya Birla Fashion and Retail Ltd (ABFRL), is taking a traditional route.
Sentiment: negative
Summary: Aditya Birla Re Share Price: Find the latest news on Aditya Birla Re Stock Price. Get all the information on Aditya Birla Re with historic price charts for NSE / BSE. Experts & Broker view also get the Aditya Birla Re Ltd. buy/sell tips detailed news, announcements, Forecasts, Analysts, Valuation, ...
Sentiment: neutral
5. Headline: Aditya Birla, Titan and 8 Other Stocks Announcing Q4 Results This Week
Summary: Earnings season gathers momentum this week, with key results likely to influence market sentiment and provide insights into consumption trends, discretionary demand, and overall market activity outlook.
Sentiment: positive
Recent Updates
News Summary
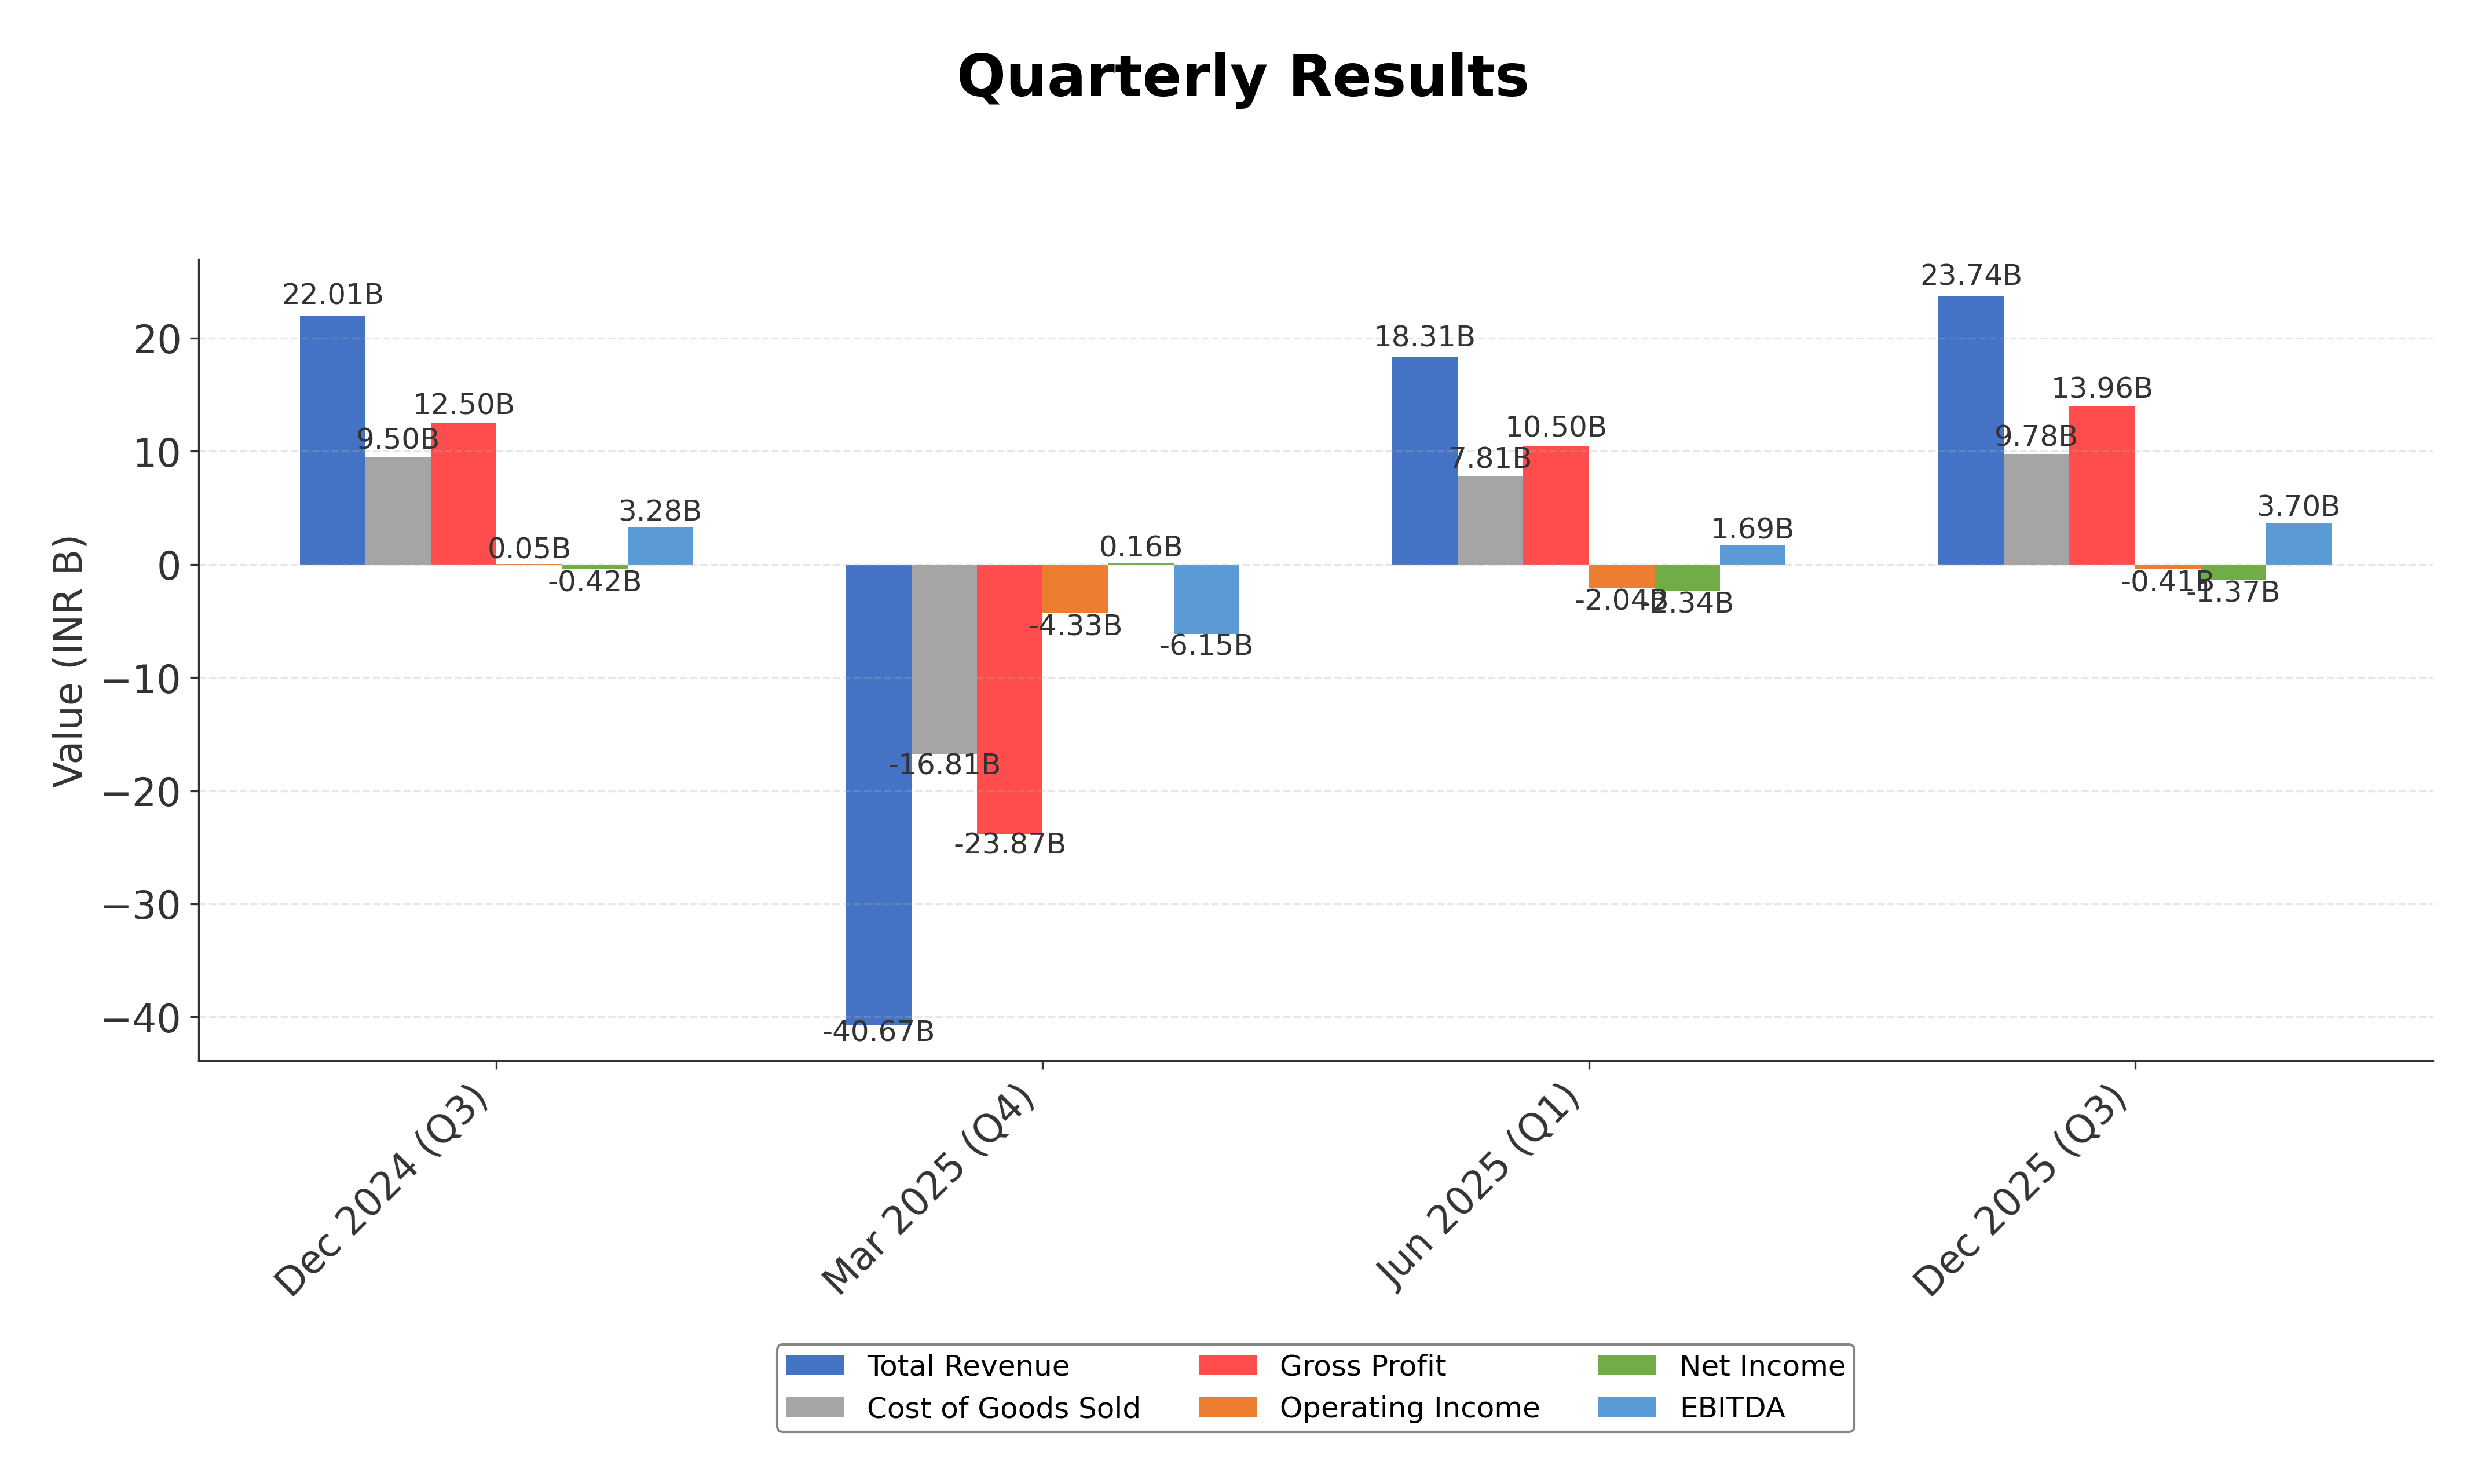
As of 6 February 2026. Aditya Birla Fashion and Retail Ltd. reported Q3 FY26 consolidated revenue growth of 8% year-over-year to ₹2,374 crore, with EBITDA increasing 13% to ₹370 crore and margin expansion of 70 basis points. Despite a reported loss of ₹137 crore, normalized loss was ₹115 crore, slightly higher than the previous year. The company continues to focus on premiumization, network expansion, and digital growth, with brands such as Pantaloons targeting mid- to high-single-digit growth and emerging brands like TCNS and TMRW aiming for breakeven in the coming years. The balance sheet shows gross cash of ₹2,100 crore and net cash of ₹600 crore after accounting for debt and subsidiary borrowings. Exceptional items related to Labour Code implementation impacted results, with management monitoring ongoing regulatory developments.
News Sentiment
The overall sentiment from recent updates is cautiously optimistic, driven by revenue and EBITDA growth alongside strategic initiatives targeting premium segments and digital expansion. However, persistent losses and regulatory-related exceptional charges temper the outlook. Positive cash position improvements and clear breakeven timelines for emerging brands support a constructive operational narrative. Mixed technical signals and market commentary reflect investor prudence amid ongoing challenges. The sentiment balances growth prospects with near-term profitability and regulatory risks.
Source List
Analytical Overview
Analysis Summary
Aditya Birla Fashion and Retail Ltd. exhibits a trailing P/E ratio of 96.27, significantly higher than the industry average, while the forward P/E of 10.31 suggests market anticipation of earnings recovery. Revenue growth shows a decline of 45.6% quarterly, but year-to-date figures indicate a 10% increase, reflecting mixed growth momentum. The company’s financial health is challenged by a high debt-to-equity ratio of 84.68% and negative operating and free cash flows, pointing to liquidity and leverage concerns. Sector-specific challenges include competitive pressures in the apparel market and regulatory impacts such as the Labour Code, while opportunities arise from premiumization and digital channel expansion. Considering India-specific factors, the evolving consumer trends and regulatory environment play a critical role in shaping ABFRL’s market positioning and growth prospects.
Overall Business and Market Assessment
Supporting Factors: the company’s diversified brand portfolio, ongoing revenue growth in premium segments, and strategic focus on digital and omni-channel expansion
Risk Factors: sustained net losses, high leverage, and regulatory uncertainties impacting cost structures
SWOT Analysis
Strengths
- Strong portfolio of well-known fashion brands with broad market appeal.
- Extensive retail network across metropolitan and tier II/III cities in India.
- Robust cash reserves supporting operational flexibility.
- Strategic focus on premiumization and digital channel growth.
Weaknesses
- Negative net income and profitability margins indicating operational challenges.
- High debt-to-equity ratio of 84.68% increasing financial risk.
- Negative operating and free cash flows impacting liquidity.
- Elevated valuation multiples relative to earnings and cash flow.
Opportunities
- Growing Indian apparel market with increasing consumer spending.
- Expansion into premium and ethnic wear segments with strong growth potential.
- Leveraging digital and omni-channel platforms to enhance customer reach.
- Potential operational efficiencies from subsidiary amalgamations and regulatory clarity.
Threats
- Intense competition within the apparel and retail sector.
- Regulatory risks related to Labour Code implementation and compliance costs.
- Macroeconomic volatility affecting consumer discretionary spending.
- Market skepticism reflected in volatile stock price and technical indicators.
Company Description
Aditya Birla Fashion and Retail Ltd. is a leading player in the Indian fashion and apparel industry, encompassing both retail and wholesale business operations. It serves a diverse market with a spectrum of fashion products ranging from casual and formal wear to ethnic clothing. The company operates well-known brands like Louis Philippe, Van Heusen, Allen Solly, and Peter England, which are staples in the men's clothing segment, alongside Pantaloons, a popular multi-brand fashion retail chain catering to a broader demographic. Aditya Birla Fashion and Retail Ltd. focuses on offering stylish, quality products paired with a robust retail presence across metros and tier II and III cities in India. Its significance in the market stems from a strategic blend of in-house and external brands, enabling diverse consumer engagement and positioning it as a significant contributor to the evolving fashion landscape in India. By leveraging both physical and digital channels, the company continuously adapts to trends, sustaining its influence and appeal in the competitive retail sector.