


Aditya Birla Fashion and Retail Ltd (ABFRL)
Stock Analysis Report
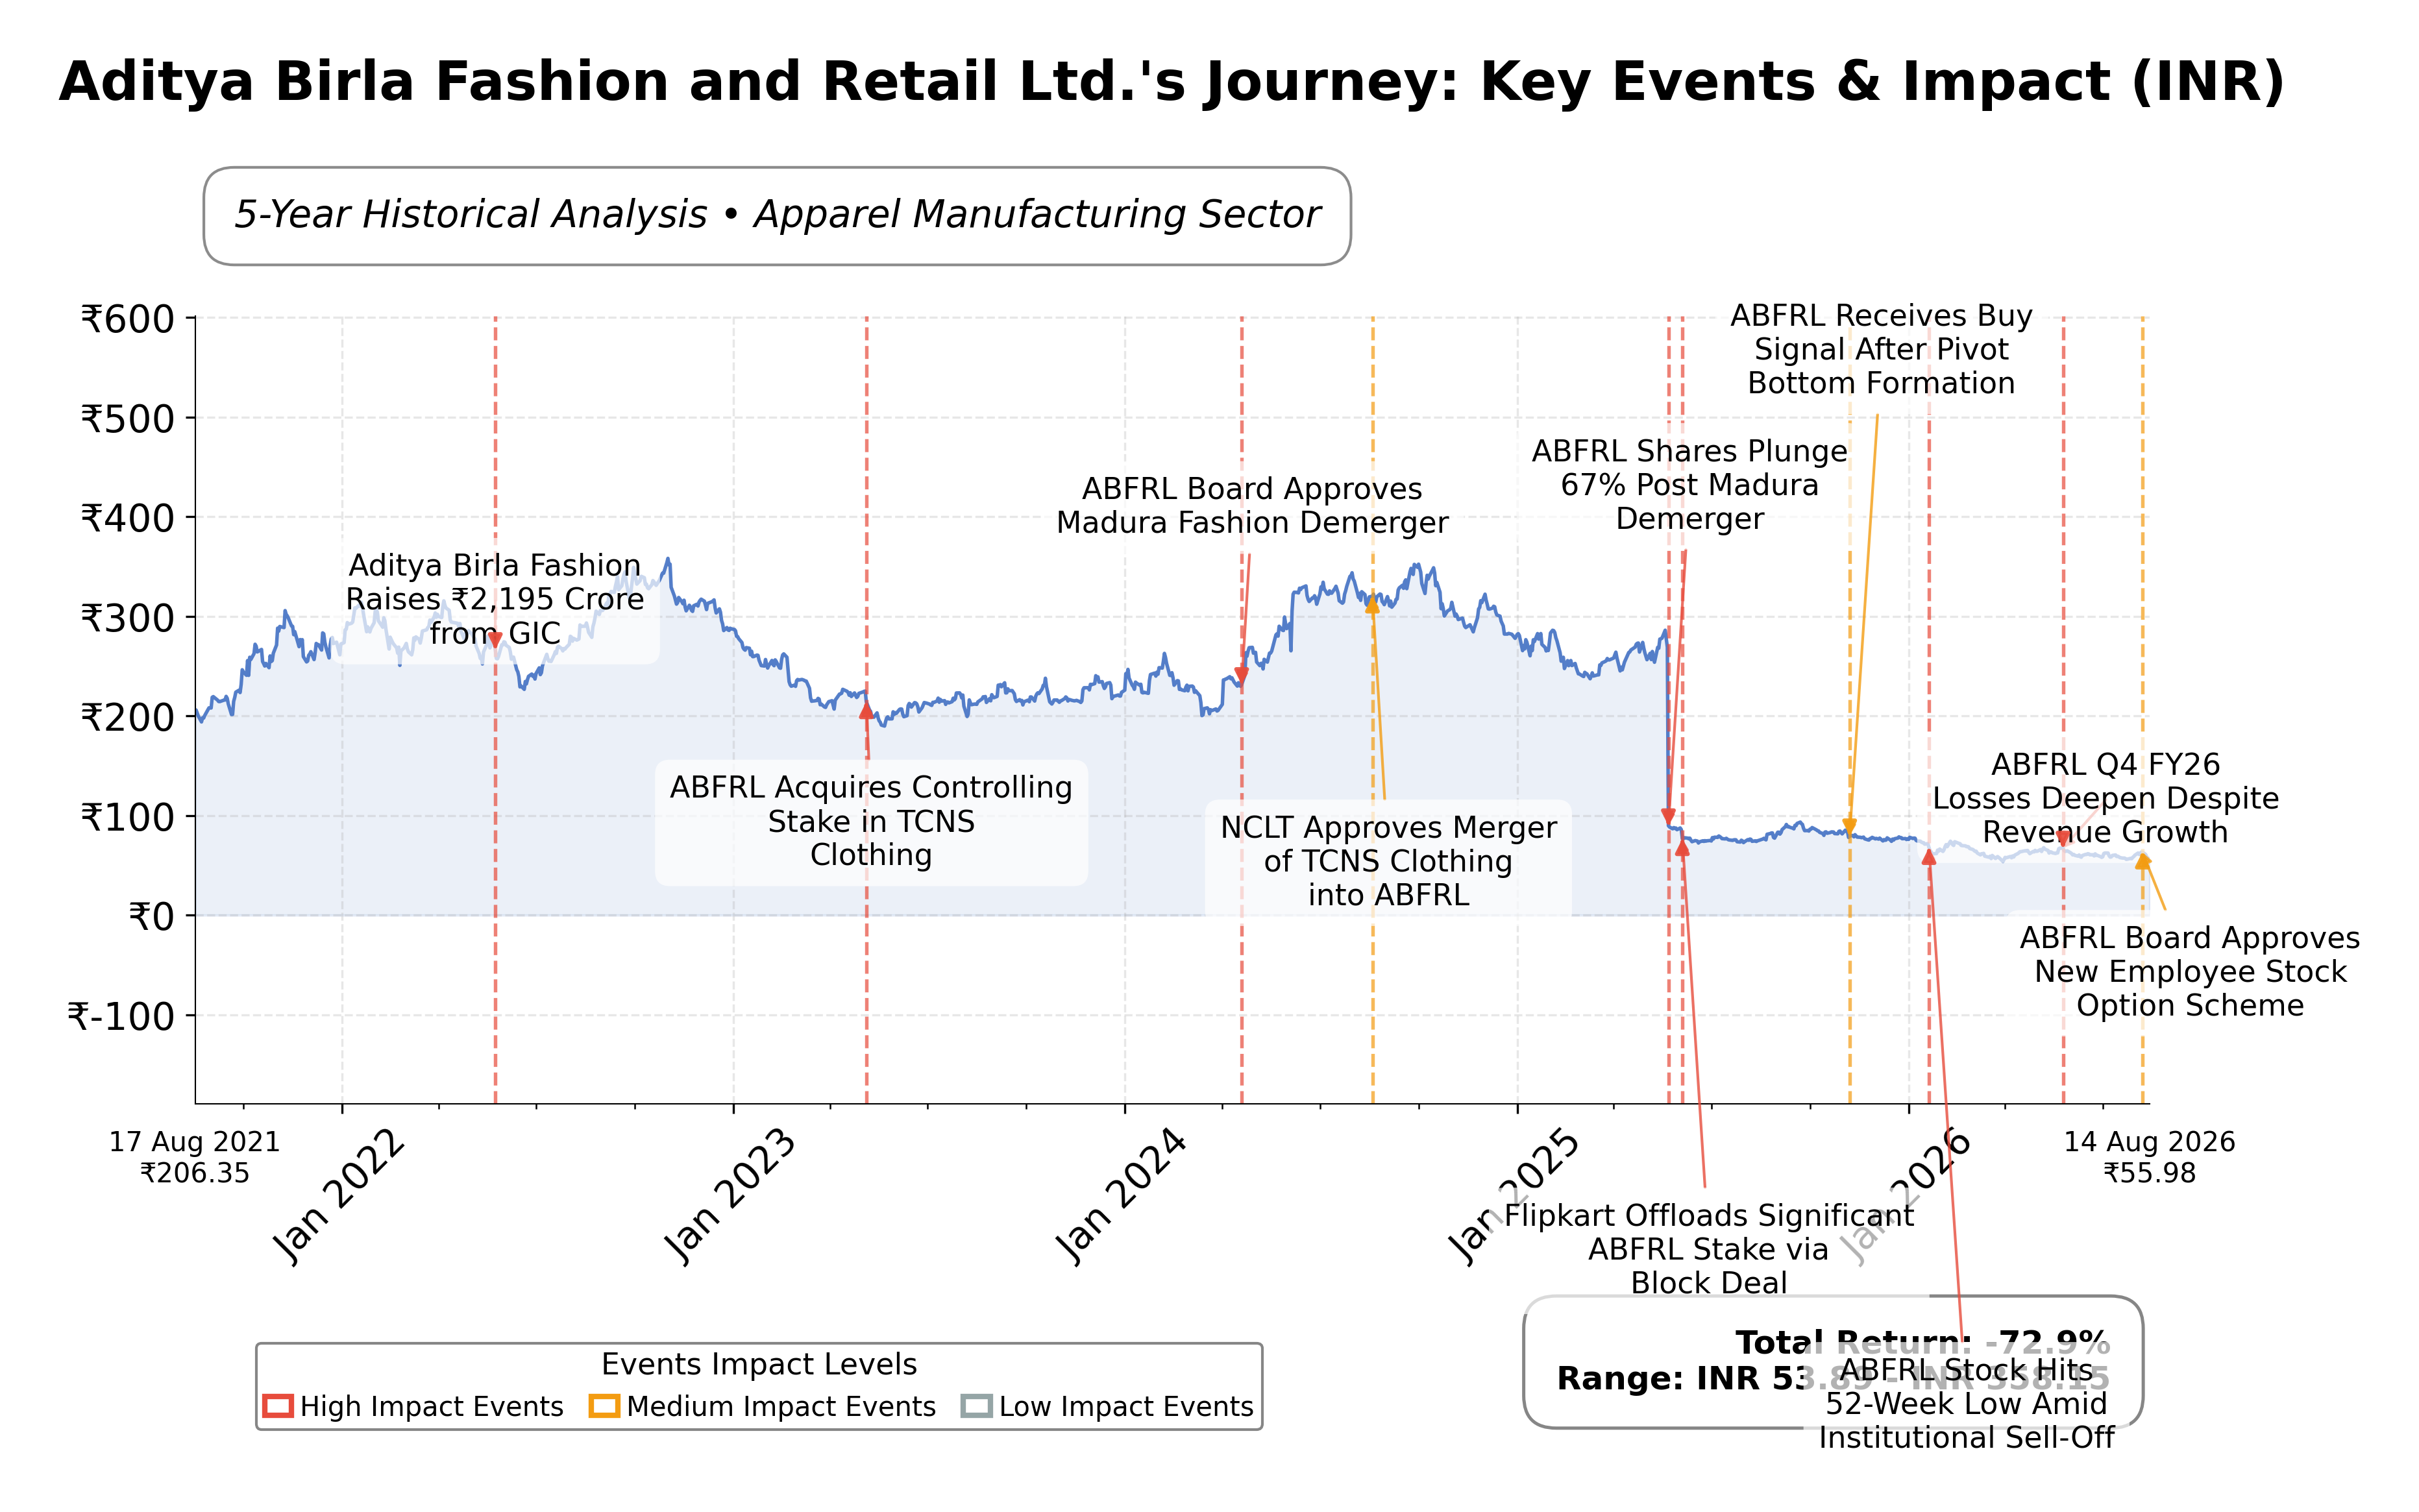
Stock Journey
Key Positives and Key Risks
Pros
- Revenue growth of 15.7% year-over-year indicates strong top-line momentum amid challenging conditions.
- Cash reserves of approximately INR 15.45 billion provide liquidity support for ongoing investments.
- Newer business segments such as TMRW and Tasva show robust growth around 30%, signaling potential future profitability.
Cons
- Net loss margin of -9.49% and negative ROE of -12.69% highlight ongoing profitability challenges.
- High debt-to-equity ratio of 98.82 increases financial risk and interest burden.
- Negative free cash flow of INR -2.21 billion indicates continued cash outflows despite operational cash inflows.
Disclosure: This information is for general awareness and does not constitute investment advice
Report Summary
Aditya Birla Fashion and Retail Ltd. (ABFRL) operates primarily in the Indian apparel manufacturing sector, listed on the NSE under the symbol ABFRL. The company offers a diverse portfolio of fashion products including casual, formal, and ethnic wear through well-known brands such as Louis Philippe, Van Heusen, Allen Solly, Peter England, and Pantaloons. It maintains a significant retail presence across metropolitan and tier II/III cities in India, leveraging both physical stores and digital channels to engage a broad consumer base. ABFRL is positioned as a key player in the consumer cyclical sector, focusing on evolving fashion trends and market demands.
Financially, ABFRL reported trailing twelve months (TTM) revenue of approximately INR 81.77 billion with a gross margin of 56.11%, indicating efficient cost management at the production level. However, the company is currently operating at a net loss margin of -9.49% and an operating margin of -7.63%, reflecting challenges in profitability. Return on equity (ROE) and return on assets (ROA) stand at -12.69% and -2.37%, respectively, signaling negative returns for shareholders and asset utilization inefficiencies. The company’s return on invested capital (ROIC) is also under pressure, consistent with its current financial performance.
Valuation metrics show a trailing price-to-earnings (P/E) ratio of 96.27, which is significantly higher than typical industry averages, while the forward P/E is negative at -11.62, indicating expected losses in the near term. The price-to-book (P/B) ratio is 1.23, and the enterprise value to EBITDA (EV/EBITDA) stands at 17.82, suggesting the stock is priced at a premium relative to earnings and book value. The market capitalization is approximately INR 73.3 billion, with a 52-week price range between INR 53.51 and INR 94.95. The current share price of INR 55.29 is closer to the lower end of this range, reflecting recent downward price momentum.
Key strengths include a strong brand portfolio and diversified revenue streams across multiple fashion segments, supported by a robust retail footprint. The company benefits from solid cash reserves totaling INR 15.45 billion but carries substantial debt of INR 61.89 billion, resulting in a high debt-to-equity ratio of 98.82. Risks involve margin pressures from input cost inflation, ongoing investments in new store openings, and competitive challenges in the apparel retail sector. Recent strategic initiatives include expansion of newer business lines such as TMRW and Tasva, which have shown promising growth trajectories, alongside cautious market sentiment reflected in analyst downgrades.
Technically, the stock is trading below its 50-day and 200-day moving averages, with momentum indicators suggesting subdued price action. Recent news highlights mixed earnings results with revenue growth offset by margin contraction and net losses. Overall, the data suggests a cautious stance with potential for selective accumulation as the company navigates margin pressures and operational challenges, warranting close monitoring of financial and market developments.
Company and Industry Overview
Company Basics
Price Performance
Company Size
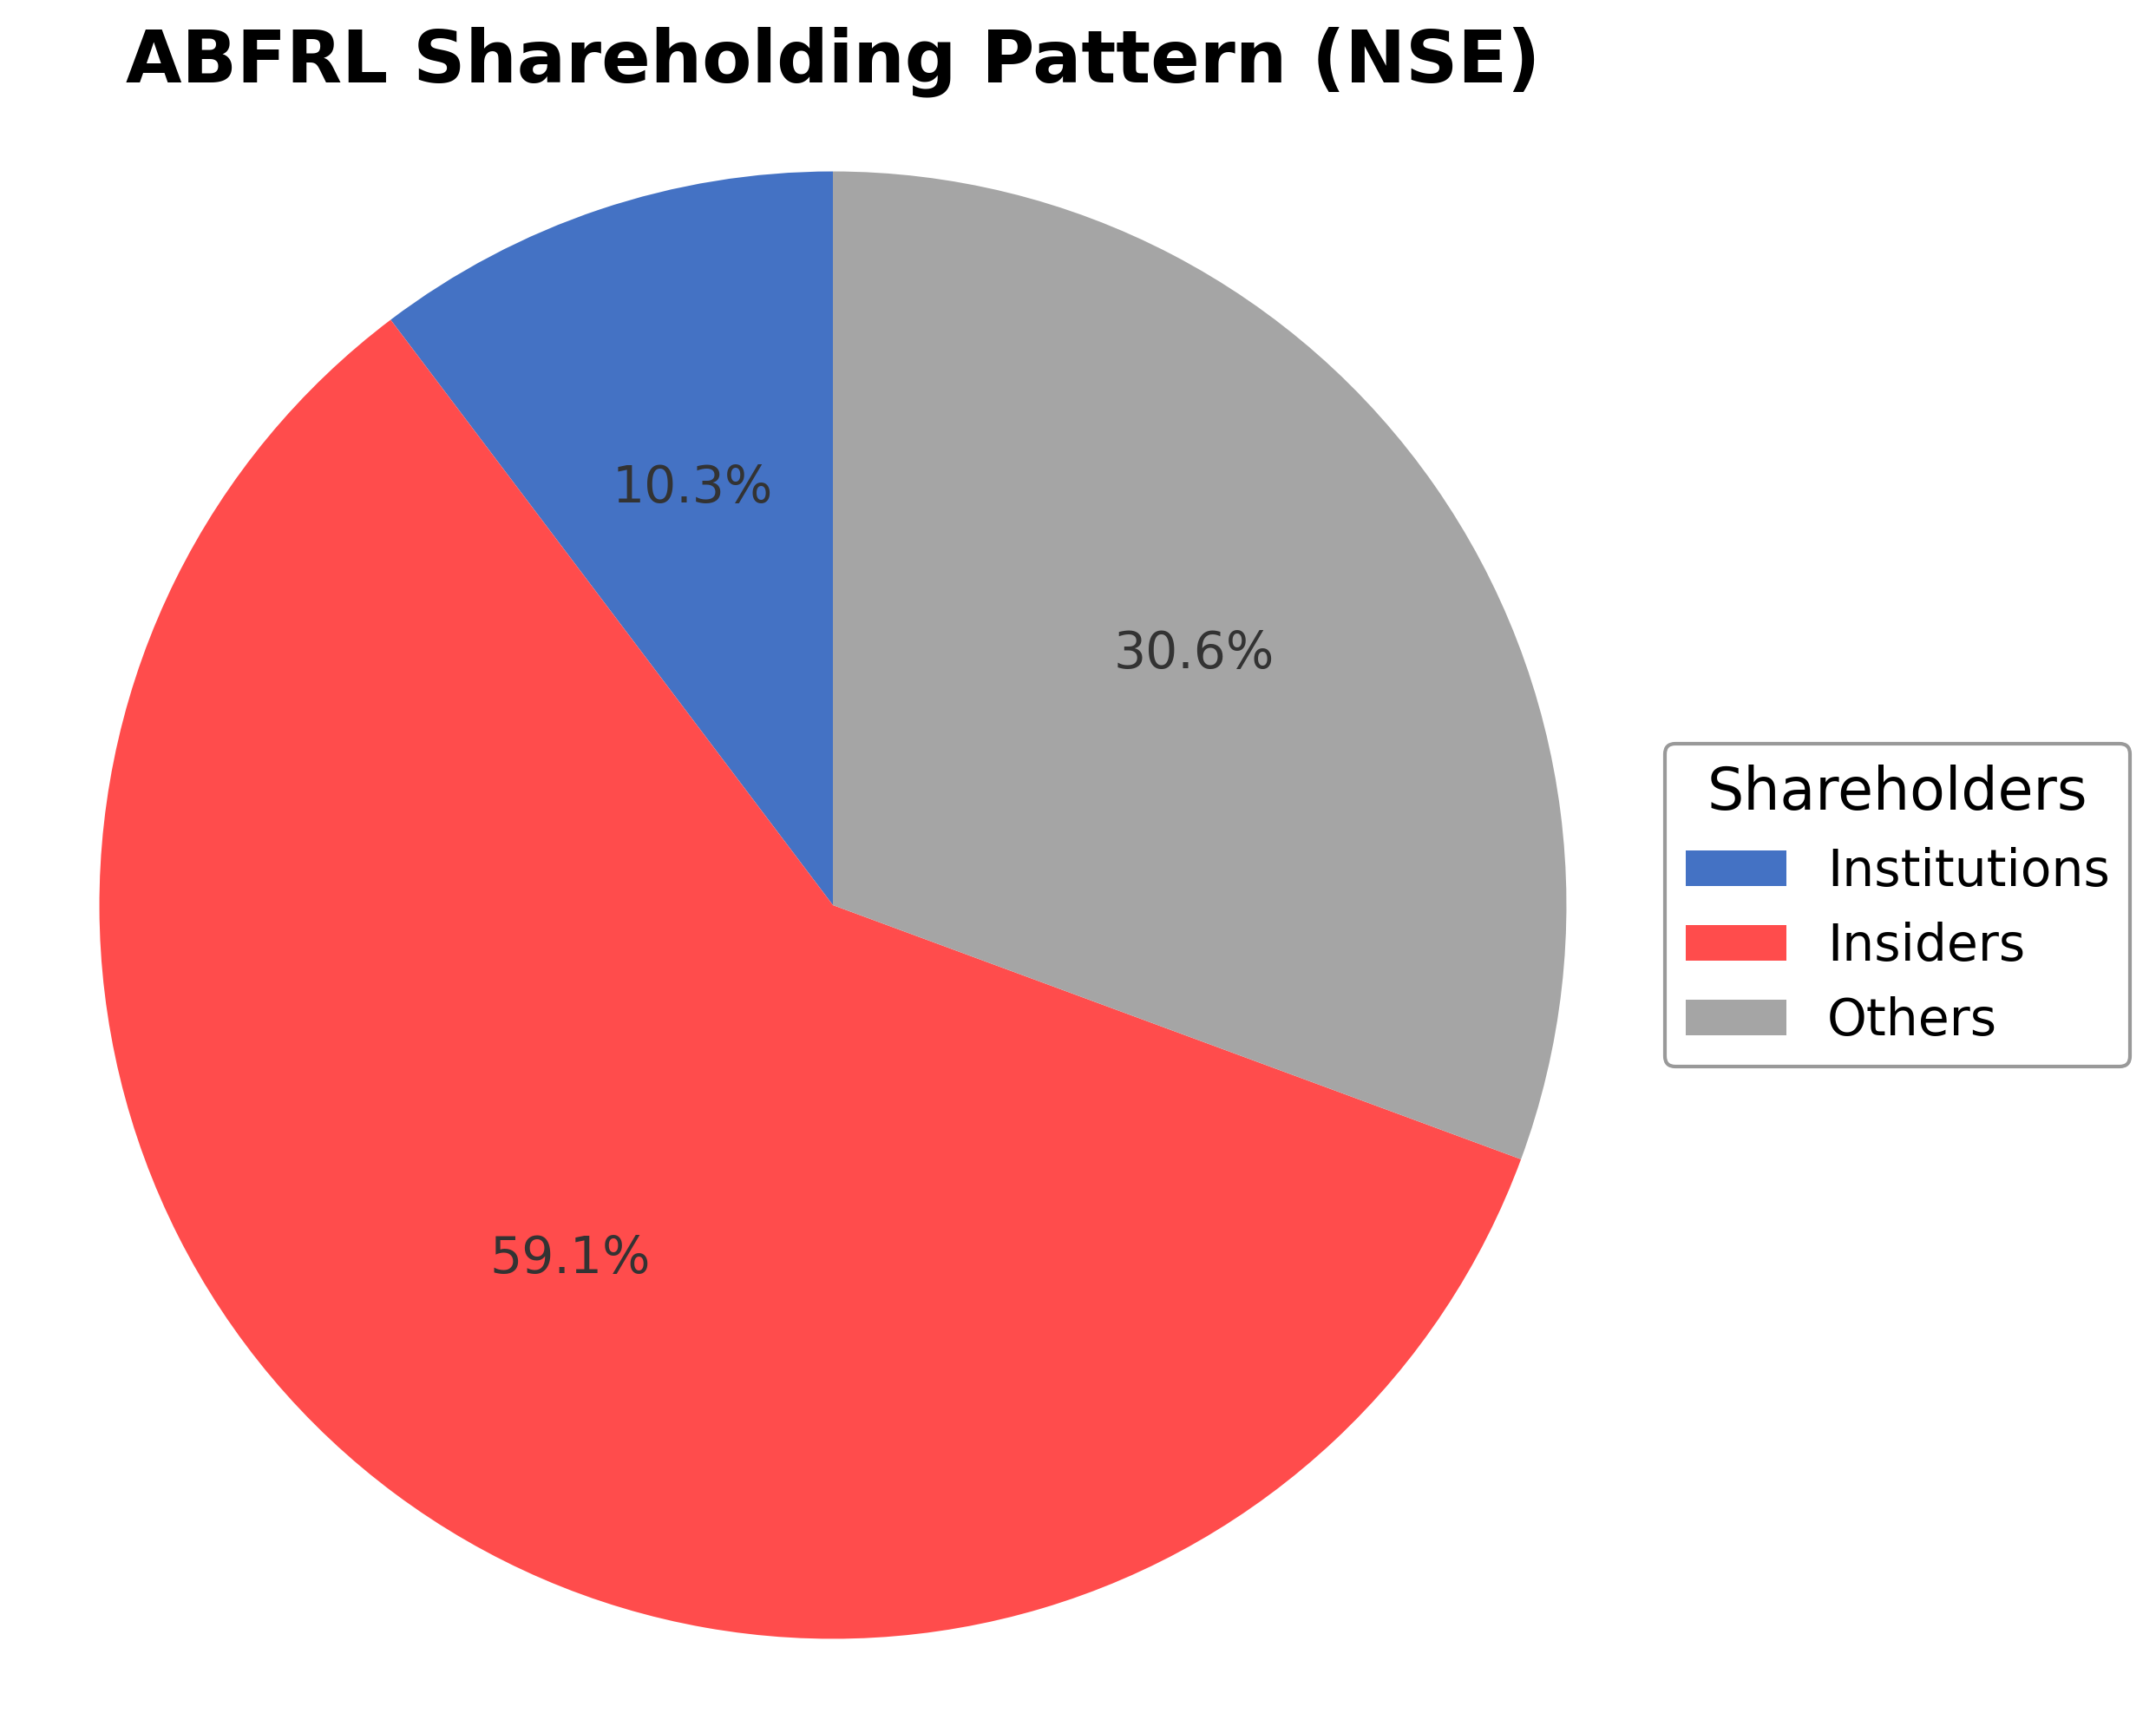
Shareholding Pattern
Sector and Industry Analysis
The Indian fashion and retail sector is a rapidly expanding market, projected to reach approximately $115 billion by 2026, driven by rising consumer spending and urbanization. The sector encompasses a broad range of segments including apparel, footwear, and accessories, with organized retail gaining significant traction. Key players include Aditya Birla Fashion and Retail Ltd (ABFRL), Trent, and Reliance Retail, which dominate through extensive brand portfolios and distribution networks.
Industry trends reveal a strong shift towards lifestyle and ethnic wear, with companies like ABFRL expanding through acquisitions and new brand launches to capture diverse consumer preferences. The sector is characterized by high competition, requiring robust brand equity, wide retail presence, and innovation in product offerings. Barriers to entry remain moderate due to capital intensity and the need for strong supply chain capabilities, while digital transformation and direct-to-consumer (D2C) models are reshaping competitive dynamics.
The regulatory environment for the fashion and retail sector in India includes policies on foreign direct investment (FDI), taxation, and labor laws, which influence operational frameworks and expansion strategies. Recent reforms facilitating increased FDI in retail and easing compliance norms have encouraged growth and investment. Going forward, regulatory stability and supportive government initiatives are expected to sustain sector expansion, although evolving consumer protection and environmental regulations may require ongoing adaptation.
Note: Analysis synthesized from industry research, market reports, and regulatory filings. Information is subject to change based on market conditions.
Financial Ratios Dashboard
Illustrative Scenario Analysis
DCF Assumptions:
Method: Two-Stage EPS-Priority Model
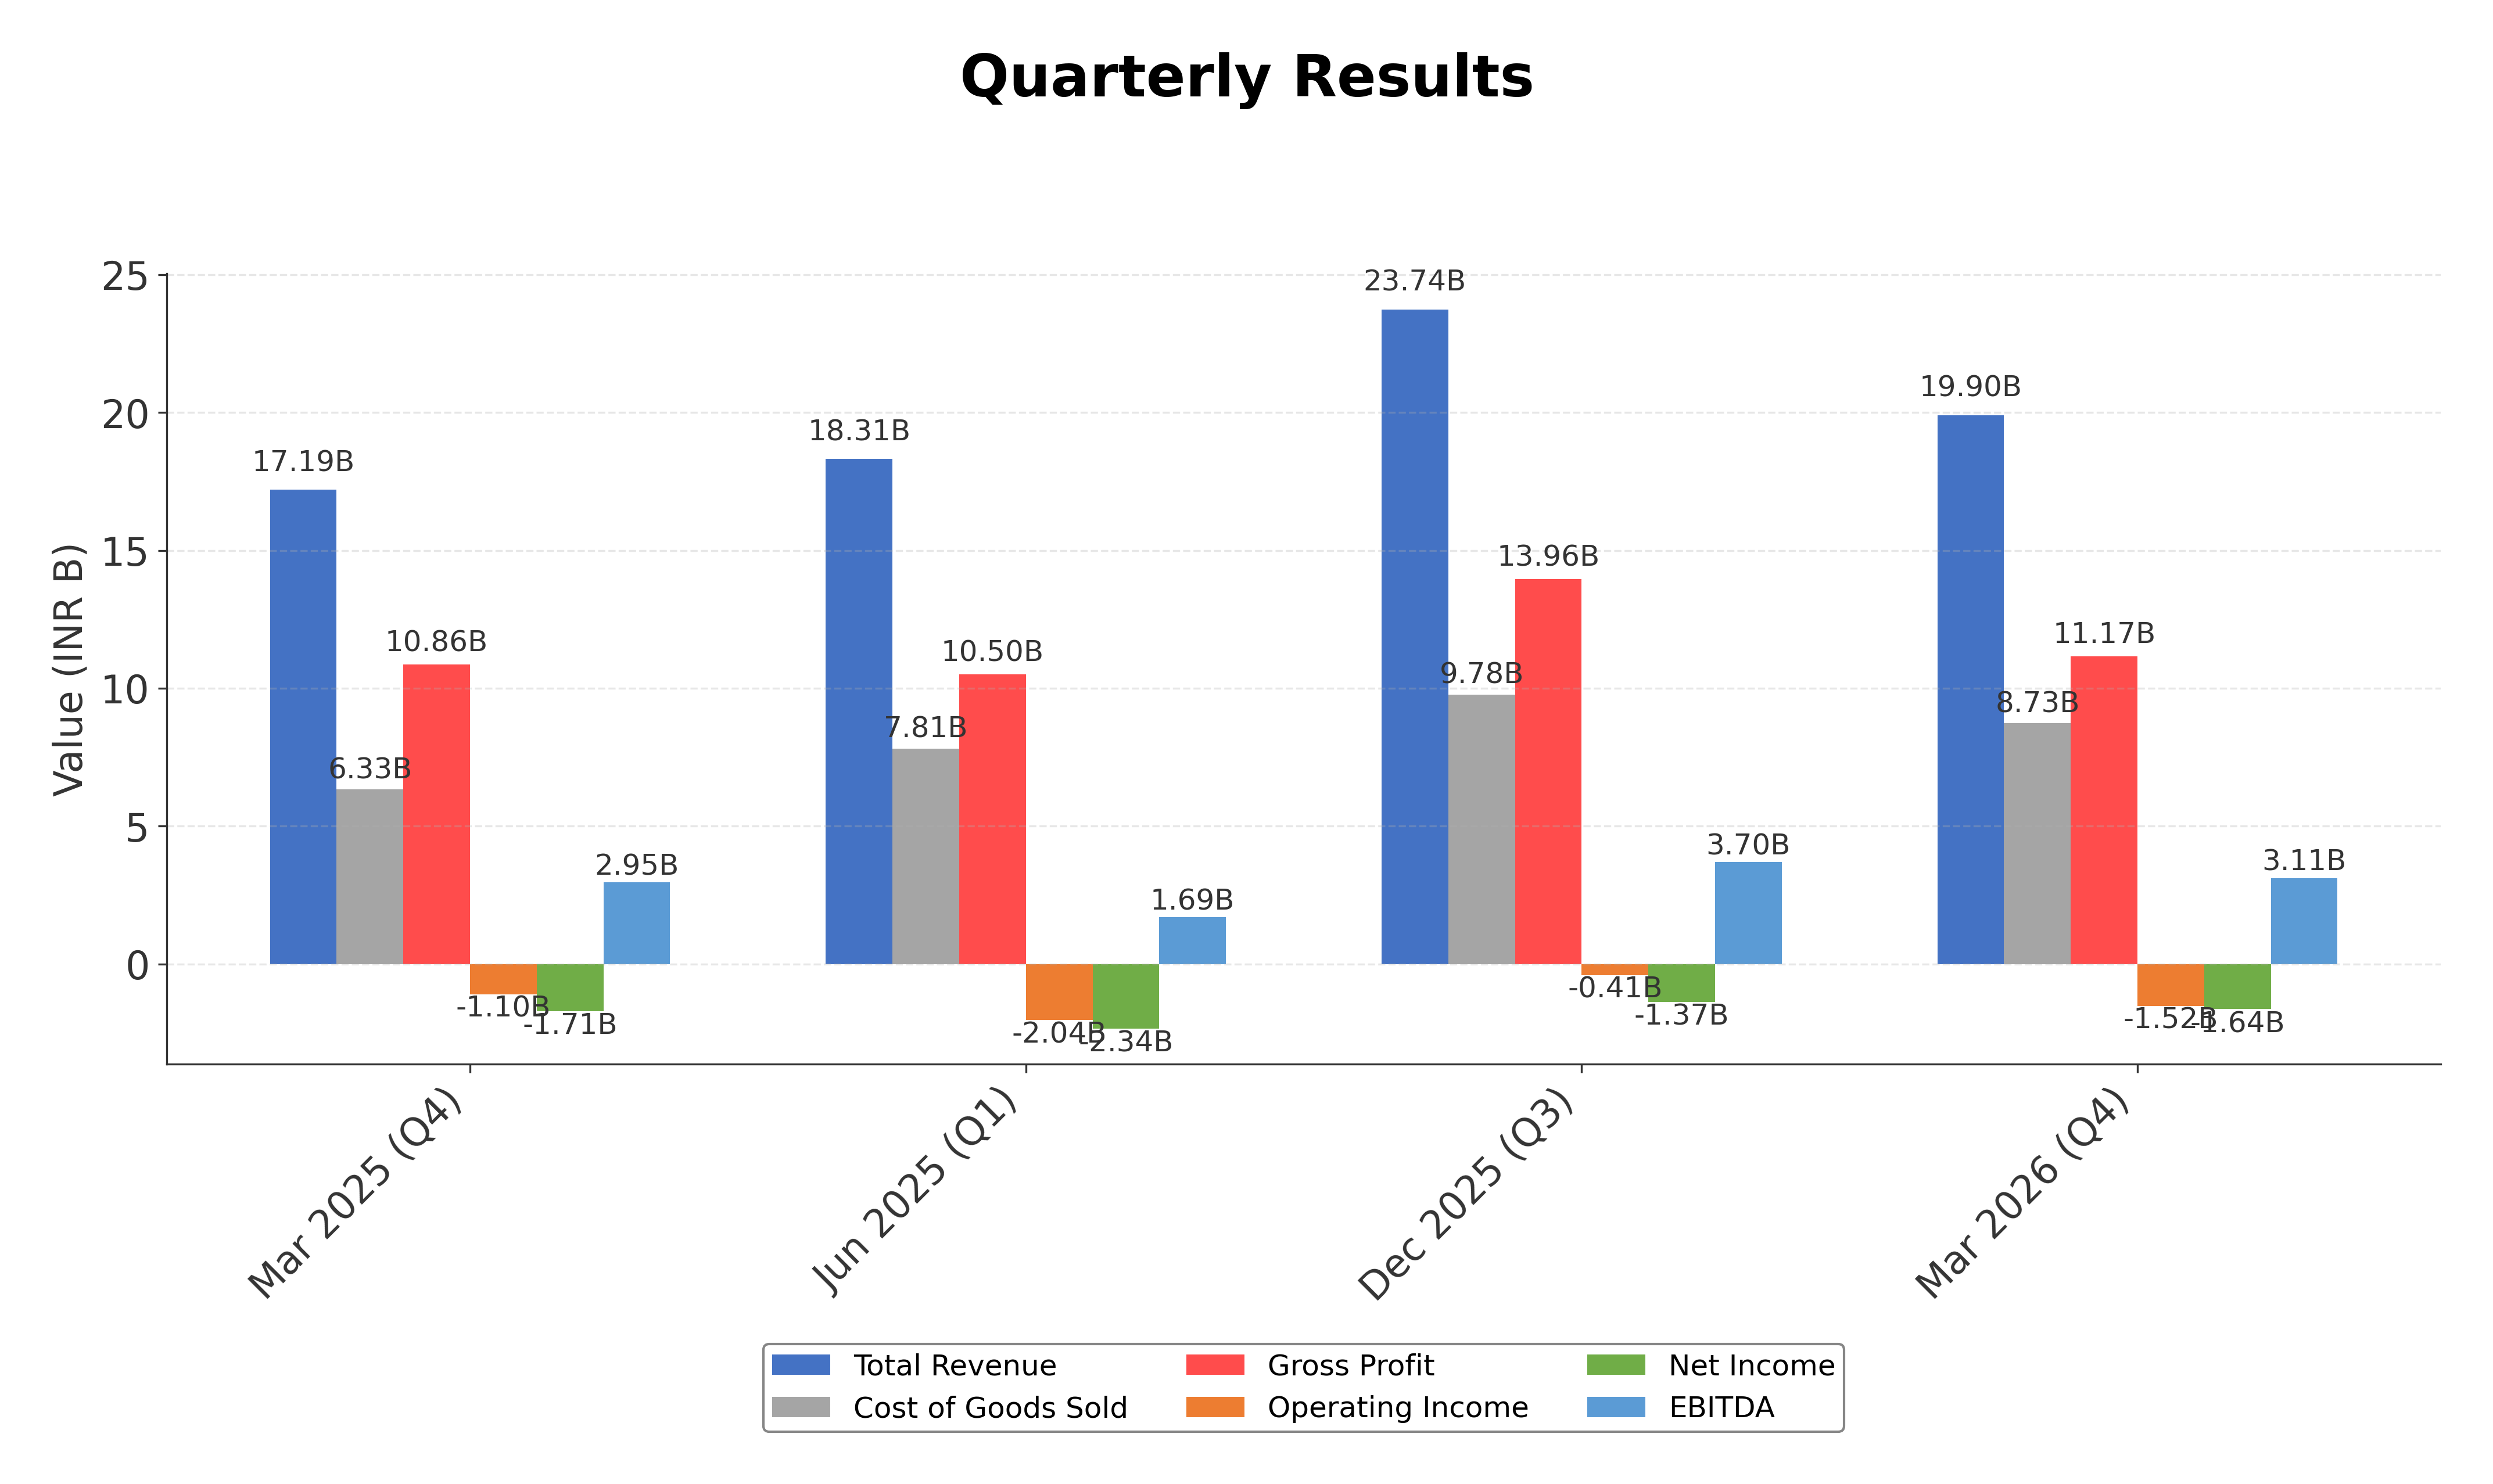
Financials
Peer Analysis
| Company Name | Market Cap | P/E Ratio | P/B Ratio | EV/EBITDA | Price to CFO |
|---|---|---|---|---|---|
| Aditya Birla Fashion and Retail Ltd. | ₹73.30B | 96.27 | 1.23 | 17.82 | 45.60 |
| Vedant Fashions Ltd. | ₹97.75B | 26.06 | 4.97 | 15.41 | 20.30 |
| Lux Industries Ltd. | ₹36.36B | 34.16 | 1.94 | 20.85 | -24.48 |
| Rupa & Company Ltd. | ₹11.86B | 16.56 | 1.13 | 10.42 | 26.20 |
| Page Industries Ltd. | ₹449.22B | 58.80 | 29.89 | 40.44 | 56.55 |
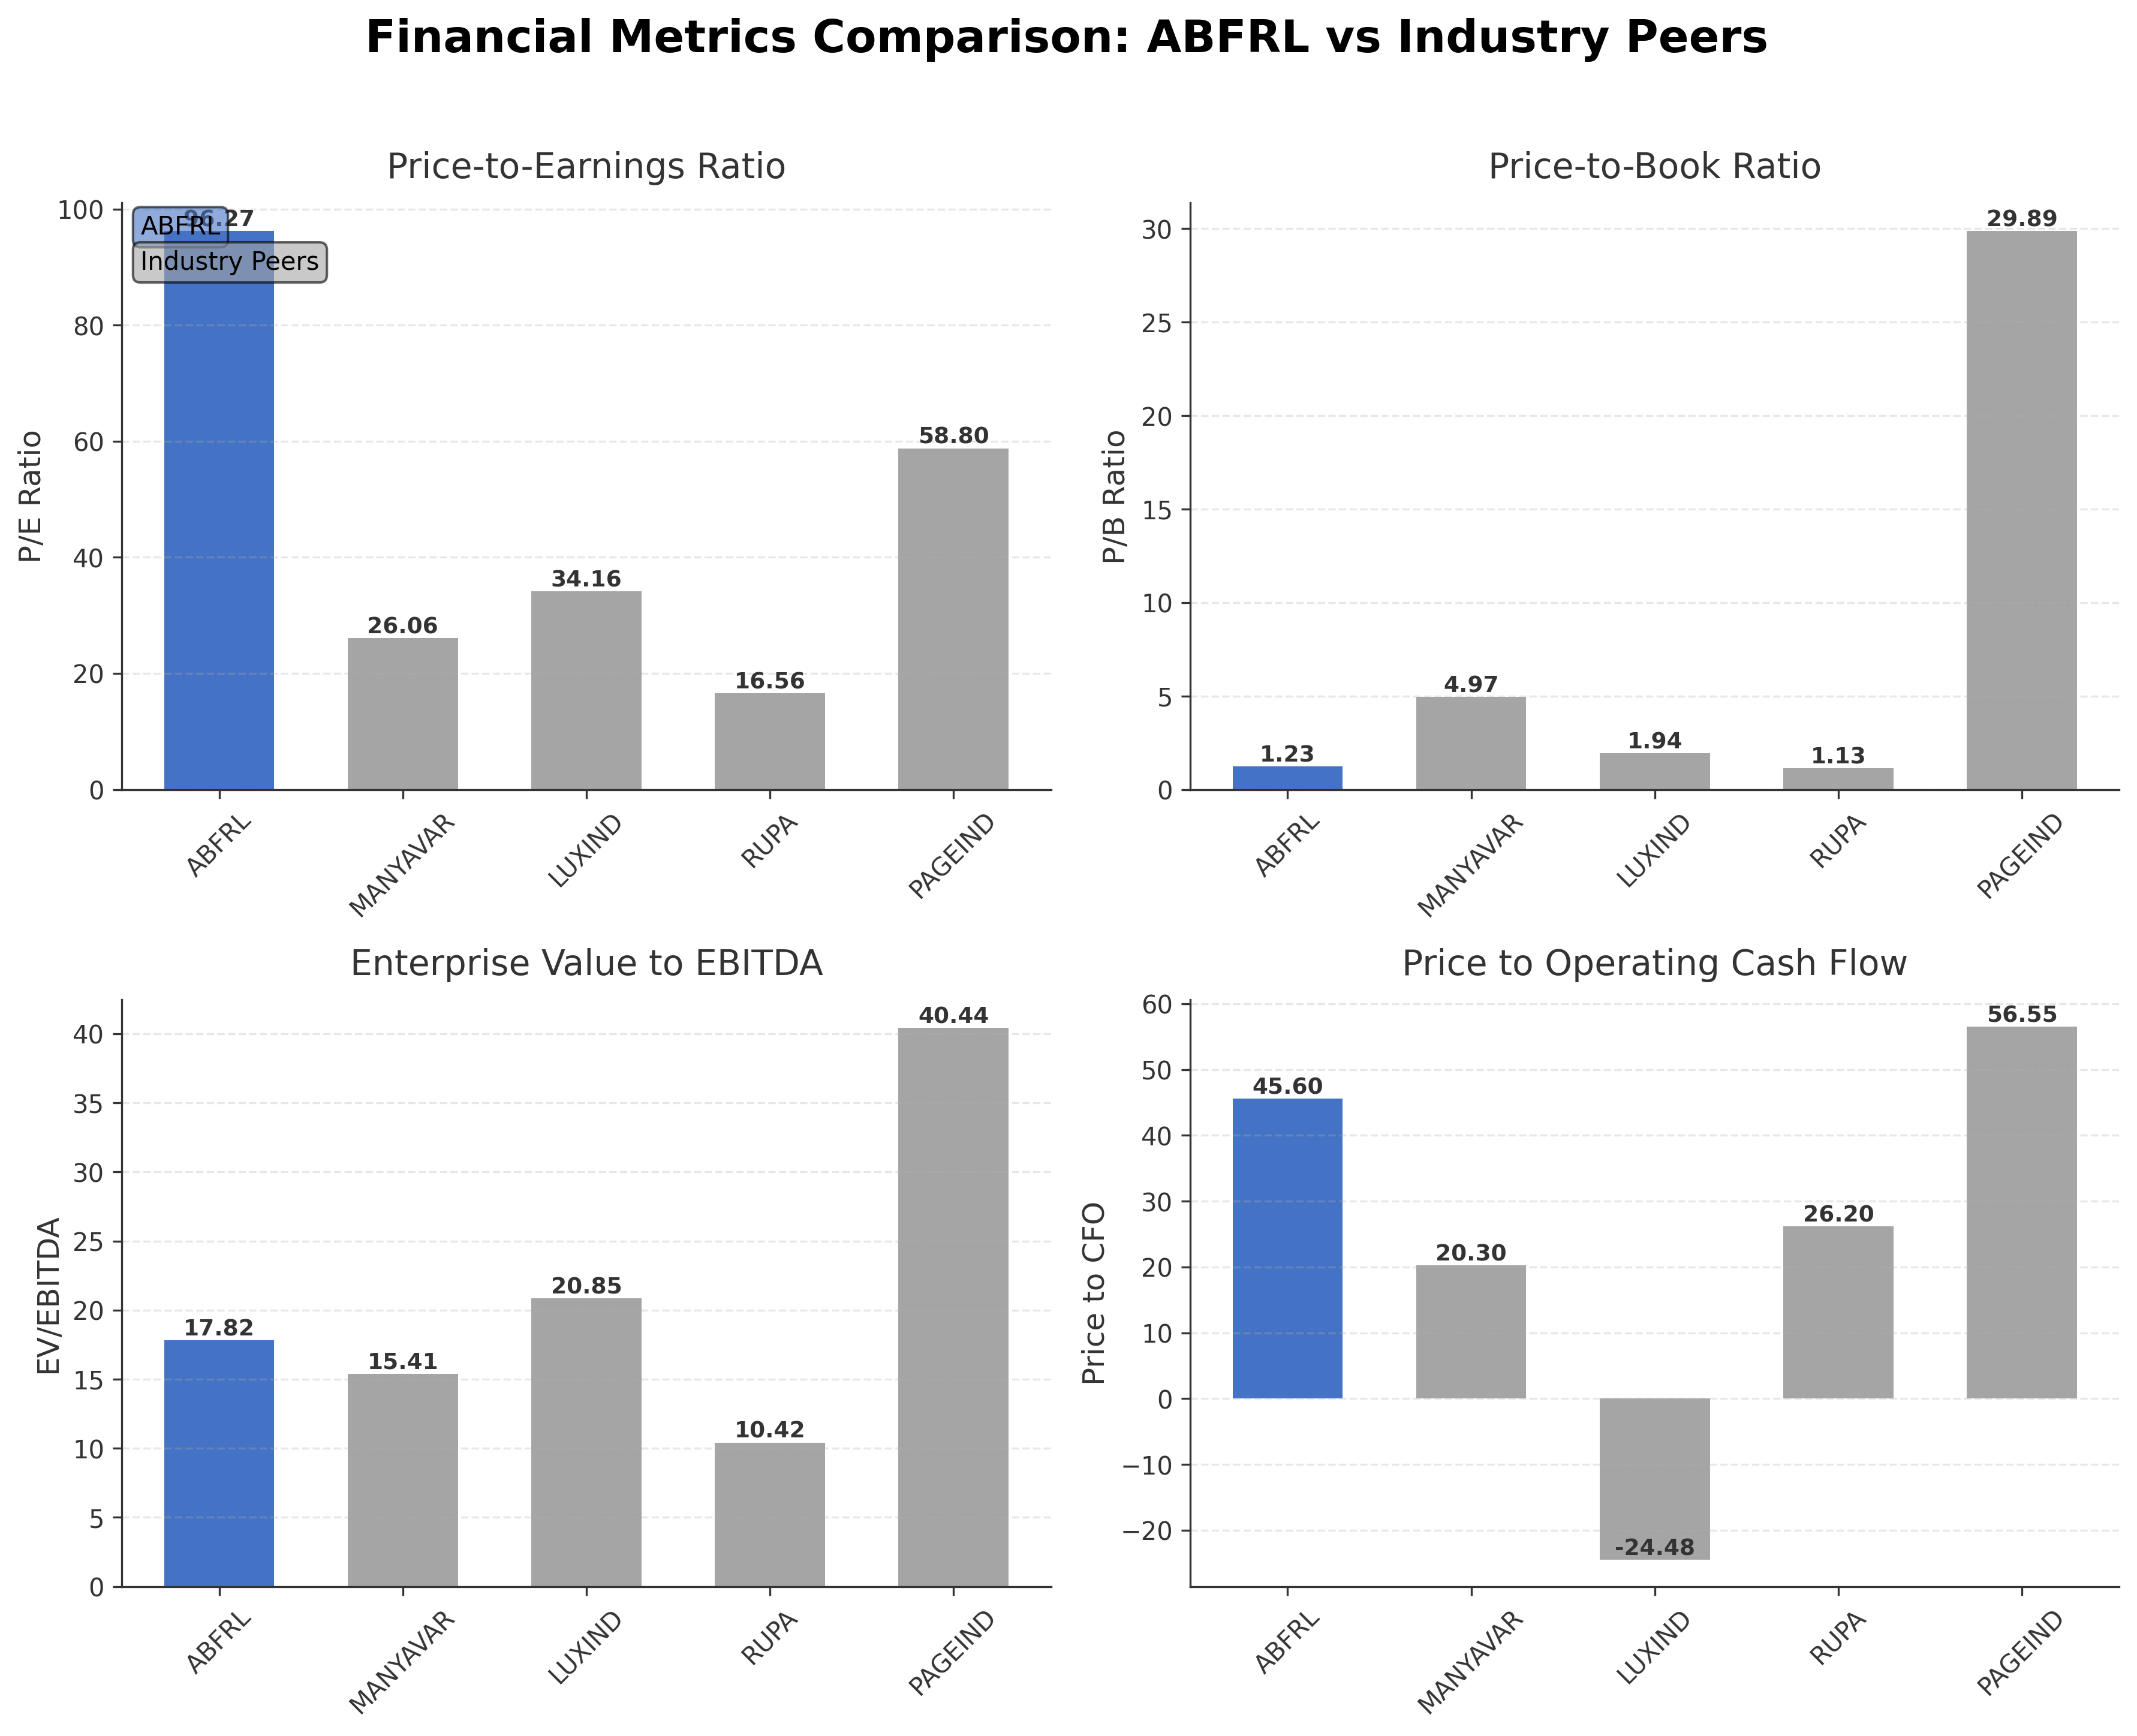
Comparison Analysis: Aditya Birla Fashion and Retail Ltd. exhibits a significantly higher trailing P/E ratio of 96.27 compared to its peers, indicating elevated valuation relative to earnings. Its P/B ratio of 1.23 is lower than many peers, suggesting a more moderate premium on book value. The EV/EBITDA multiple of 17.82 is within the mid-range of the peer group, reflecting moderate enterprise valuation. ABFRL’s return on equity is negative at -12.69%, contrasting with positive ROE figures among peers, highlighting challenges in profitability. Price to CFO is notably high at 45.60, indicating less efficient cash flow conversion relative to market price. Overall, ABFRL shows valuation premiums and profitability weaknesses compared to regional industry peers.
Financial Metrics Comparison with Peers
Financial Statements
Comprehensive financial data including income, balance sheet, and cash flow metrics
Income Statement
| fiscal_date | 2026-03-31 | 2025-03-31 | 2024-03-31 | 2023-03-31 | 2022-03-31 |
|---|---|---|---|---|---|
| Sales | 81.40B | 73.09B | 139.30B | 123.63B | 80.93B |
| Cost Of Goods | 34.85B | 31.94B | 63.07B | 55.85B | 37.44B |
| Gross Profit | 46.55B | 41.15B | 76.23B | 67.78B | 43.49B |
| Operating Expense Selling General And Administrative | 10.13B | 8.61B | 12.43B | 10.67B | 5.71B |
| Operating Expense Other Operating Expenses | 14.39B | 12.33B | 21.16B | 17.39B | 11.20B |
| Operating Income | -6.07B | -4.48B | -1.24B | 3.38B | 1.51B |
| Non Operating Interest Income | 430.60M | 108.10M | 262.60M | 102.10M | 93.80M |
| Non Operating Interest Expense | 5.14B | 5.59B | 8.72B | 4.71B | 3.48B |
| Pretax Income | -9.28B | -7.18B | -8.29B | -824.40M | -1.45B |
| Income Tax | -982.40M | -942.10M | -929.90M | -229.70M | -265.70M |
| Net Income | -8.30B | -4.56B | -7.36B | -594.70M | -1.18B |
| Eps Basic | -6.38 | -3.53 | -6.52 | -0.38 | -1.18 |
| Eps Diluted | -6.38 | -3.53 | -6.52 | -0.38 | -1.18 |
| Basic Shares Outstanding | 1.22B | 1.09B | 964.34M | 947.73M | 924.93M |
| Diluted Shares Outstanding | 1.22B | 1.09B | 964.34M | 947.73M | 924.93M |
| Ebit | -4.14B | -1.60B | 434.50M | 3.89B | 2.03B |
| Ebitda | 7.19B | 6.79B | 15.43B | 15.26B | 11.35B |
| Net Income Continuous Operations | -9.28B | -4.87B | -8.29B | -824.40M | -1.45B |
| Minority Interests | 540.00M | 800.00M | 1.08B | 234.70M | 96.40M |
| Preferred Stock Dividends | 0.00 | 0.00 | 0.00 | 0.00 | 0.00 |
Data provided by Twelve Data
Balance Sheet
| fiscal_date | 2026-03-31 | 2025-03-31 | 2024-03-31 | 2023-03-31 | 2022-03-31 |
|---|---|---|---|---|---|
| Cash And Cash Equivalents | 669.60M | 7.67B | 4.54B | 6.93B | 1.18B |
| Accounts Receivable | 4.07B | 3.73B | 12.79B | 8.86B | 7.56B |
| Total Assets | 177.57B | 166.40B | 224.11B | 170.41B | 124.07B |
| Total Liabilities | 114.94B | 98.26B | 176.90B | 136.95B | 96.18B |
| Long Term Debt | 46.77B | 39.71B | 65.98B | 48.54B | 28.54B |
| Shareholders Equity | 62.63B | 68.13B | 47.21B | 33.46B | 27.89B |
Data provided by Twelve Data
Cash Flow Statement
| fiscal_date | 2026-03-31 | 2025-03-31 | 2024-03-31 | 2023-03-31 | 2022-03-31 |
|---|---|---|---|---|---|
| Operating Activities Net Income | -9.28B | -4.87B | -8.29B | -824.40M | -1.45B |
| Operating Activities Stock Based Compensation | 55.40M | 507.40M | 253.50M | 312.90M | 291.30M |
| Operating Activities Other Non Cash Items | 4.13B | 6.77B | 7.87B | 4.33B | 1.18B |
| Operating Activities Accounts Receivable | -397.10M | -4.15B | -1.74B | -1.08B | -1.54B |
| Operating Activities Other Assets Liabilities | -6.94B | -1.13B | 783.00M | -11.81B | -10.98B |
| Operating Activities Operating Cash Flow | 1.61B | 16.81B | -1.13B | -9.07B | -12.50B |
| Investing Activities Net Acquisitions | -423.90M | -2.76B | -16.09B | -1.76B | 0.00 |
| Investing Activities Purchase Of Investments | -4.07B | -7.59B | -190.10B | -127.92B | -100.08B |
| Investing Activities Sale Of Investments | 6.16B | N/A | 183.41B | 132.41B | 97.65B |
| Investing Activities Investing Cash Flow | 1.67B | -10.35B | -30.18B | -3.97B | -5.61B |
| Financing Activities Long Term Debt Issuance | 1.87B | 8.83B | 14.85B | 10.86B | 4.14B |
| Financing Activities Long Term Debt Payments | -679.50M | -20.61B | -3.53B | -4.62B | -7.51B |
| Financing Activities Short Term Debt Issuance | 1.36B | -6.37B | 6.56B | 3.65B | 4.32B |
| Financing Activities Common Stock Issuance | 4.35B | 48.98B | 14.36B | 7.73B | 2.49B |
| Financing Activities Other Financing Charges | 222.30M | -7.45B | N/A | N/A | -10.00M |
| Financing Activities Financing Cash Flow | 7.11B | 23.37B | 32.23B | 17.49B | 3.44B |
| End Cash Position | 669.60M | 7.67B | 4.54B | 6.93B | 1.18B |
| Free Cash Flow | -3.48B | 10.47B | 5.94B | -451.20M | 6.03B |
| Investing Activities Capital Expenditures | N/A | N/A | -7.41B | -6.71B | -3.18B |
| Financing Activities Common Stock Repurchase | N/A | N/A | N/A | -119.10M | N/A |
| Investing Activities Other Investing Activity | N/A | N/A | N/A | N/A | 13.70M |
Data provided by Twelve Data
Technical Analysis
Key Insights
- Current trend shows a downward price action with the stock trading below both the 50-day (₹60.40) and 200-day (₹67.24) moving averages, indicating bearish momentum.
- Key support levels are near the 52-week low of ₹53.51, while resistance is observed around the 50-day moving average at ₹60.40 and the 200-day moving average at ₹67.24.
- The stock is positioned below major moving averages (10-day, 50-day, 200-day), suggesting sustained selling pressure in the short to medium term.
- Momentum indicators show RSI near oversold levels, MACD below the signal line, and Stochastic oscillator indicating weak upward momentum, reflecting subdued buying interest.
- Multi-timeframe analysis reveals bearish trends on daily and weekly charts, with monthly charts showing consolidation near support levels.
- Potential market scenarios include continued consolidation near current lows or a gradual recovery if support holds, but overall technical setup remains cautious.
Trending News
1. Headline: Aditya Birla Capital Engages Global Investors in Singapore Analyst Meet - TipRanks.com
Summary: Aditya Birla Capital Ltd. ( ($IN:ABCAPITAL) ) just unveiled an update. Aditya Birla Capital Limited informed exchanges that it participated in an analyst and instit...
Sentiment: neutral
2. Headline: Aditya Birla Fashion and Retail Ltd (BOM:535755) (Q1 2027) Earnings Call Highlights: Revenue ...
Summary: Aditya Birla Fashion and Retail Ltd (BOM:535755) reports double-digit growth across key segments, yet faces margin pressure from new store investments and input cost inflation.
Sentiment: positive
3. Headline: Q1 2027 Aditya Birla Fashion and Retail Limited Earnings Call Transcript
Summary: Aug 10, 2026 / 10:30AM GMTOperator Ladies and gentlemen, good day and welcome to the first-quarter earnings conference call of Aditya Birla Fashion and Retail L
Sentiment: neutral
4. Headline: Aditya Birla Fashion and Retail Ltd (ABFRL:IN) PT Lowered to INR60 at Kotak
Summary: Kotak analyst Garima Mishra lowered the price target on Aditya Birla Fashion and Retail Ltd (ABFRL:IN) to INR60.00 (from INR65.00) while maintaining a Reduce (3) rating.
Sentiment: negative
5. Headline: Neutral Aditya Birla Fashion and Retail; target of Rs 60: Motilal Oswal — TradingView News
Summary: Motilal Oswal's research report on Aditya Birla Fashion and RetailABFRL delivered ~11% YoY revenue growth in 1QFY27, led by Luxury (+30%), TMRW (+11% YoY) and Pantaloons (+10%), while a short wedding season dragged down growth in Ethnics (+4% YoY). Reported EBITDA grew by a modest ~5% YoY (18% ...
Sentiment: positive
Powered by Brave
Recent Updates
News Summary
As of August 11, 2026. Aditya Birla Fashion and Retail Ltd reported its Q1 2027 earnings, highlighting double-digit revenue growth driven by newer business segments including TMRW, Galeries Lafayette, Wrogn, and Tasva, which grew approximately 30% year-over-year. The Pantaloons segment showed solid performance with 7% revenue growth and 4% like-to-like growth. Despite these positives, the company reported a net loss of INR 249 crore, wider than the previous year, due to increased interest, depreciation, and finance costs associated with new store openings. The ethnic portfolio's growth was subdued at 4%, impacted by seasonal factors and lower wedding-related purchases, while TCNS Retail faced challenges with only 2% like-to-like growth. Input cost inflation exceeding 4% is expected to pressure margins further in the second half of the fiscal year. New value retail format OWND remains in an investment phase, delaying segment-level profitability. Analyst commentary from Kotak Securities lowered the price target to INR 60 citing margin pressures, while Motilal Oswal and Systematix noted cautious optimism amid earnings recovery challenges.
News Sentiment
The overall sentiment from recent updates is mixed to cautiously negative, reflecting strong top-line growth offset by margin pressures and widening net losses. Positive momentum in newer business segments and Pantaloons is tempered by cost inflation and ongoing investments that weigh on profitability. Analyst downgrades and target price cuts underscore market concerns about near-term earnings recovery. However, strategic focus on scaling emerging brands and improving operational efficiencies provides some balance to the outlook. The prevailing tone suggests vigilance around margin management and cost control as key factors influencing future performance.
Source List
- https://streetinsider.com/Analyst+PT+Change/Aditya+Birla+Fashion+and+Retail+Ltd+(ABFRL:IN)+PT+Lowered+to+INR60+at+Kotak/26900210.html
Analytical Overview
Analysis Summary
The company's trailing P/E ratio of 96.27 is substantially higher than the industry average, indicating a premium valuation despite negative earnings, while the forward P/E is negative, reflecting expected continued losses. Revenue growth at 15.7% year-over-year and positive cash flow from operations demonstrate a growth trajectory, but free cash flow remains negative, highlighting ongoing investment and cash burn. The debt-to-equity ratio near 99% indicates significant leverage, which combined with negative profitability metrics, raises concerns about financial health. Sector-specific challenges include input cost inflation and competitive pressures in the Indian apparel retail market, while opportunities arise from expanding newer business lines and digital retail channels. Considering India-specific factors, regulatory stability and growing consumer demand for branded apparel support market potential, although economic fluctuations may impact discretionary spending.
Overall Business and Market Assessment
Supporting Factors: strong revenue growth driven by diversified brand portfolios and expanding newer businesses such as TMRW and Tasva, alongside a solid retail footprint
Risk Factors: margin pressures from inflation, high leverage with a debt-to-equity ratio near 99%, and continued net losses impacting shareholder returns
SWOT Analysis
Strengths
- Strong brand portfolio with established names like Louis Philippe and Pantaloons.
- Diversified revenue streams across multiple fashion segments and formats.
- Robust retail presence in metros and tier II/III cities across India.
- Growing newer business lines showing double-digit growth momentum.
Weaknesses
- Negative profitability with net loss margin of -9.49% and operating margin of -7.63%.
- High debt-to-equity ratio of 98.82 indicating significant financial leverage.
- Negative return on equity at -12.69% reflecting shareholder value erosion.
- Free cash flow remains negative, indicating ongoing cash burn.
Opportunities
- Expansion of newer brands like TMRW and Tasva with strong growth potential.
- Increasing consumer demand for branded apparel in India’s growing market.
- Leveraging digital channels to complement physical retail presence.
- Potential margin improvement through cost control and operational efficiencies.
Threats
- Input cost inflation exceeding 4% pressuring gross margins.
- Competitive pressures from domestic and international apparel brands.
- Slower earnings recovery impacting investor sentiment and valuations.
- Macroeconomic factors affecting discretionary consumer spending.
Company Description
Aditya Birla Fashion and Retail Ltd. is a leading player in the Indian fashion and apparel industry, encompassing both retail and wholesale business operations. It serves a diverse market with a spectrum of fashion products ranging from casual and formal wear to ethnic clothing. The company operates well-known brands like Louis Philippe, Van Heusen, Allen Solly, and Peter England, which are staples in the men's clothing segment, alongside Pantaloons, a popular multi-brand fashion retail chain catering to a broader demographic. Aditya Birla Fashion and Retail Ltd. focuses on offering stylish, quality products paired with a robust retail presence across metros and tier II and III cities in India. Its significance in the market stems from a strategic blend of in-house and external brands, enabling diverse consumer engagement and positioning it as a significant contributor to the evolving fashion landscape in India. By leveraging both physical and digital channels, the company continuously adapts to trends, sustaining its influence and appeal in the competitive retail sector.