
Adani Power Ltd (ADANIPOWER)
Stock Analysis Report
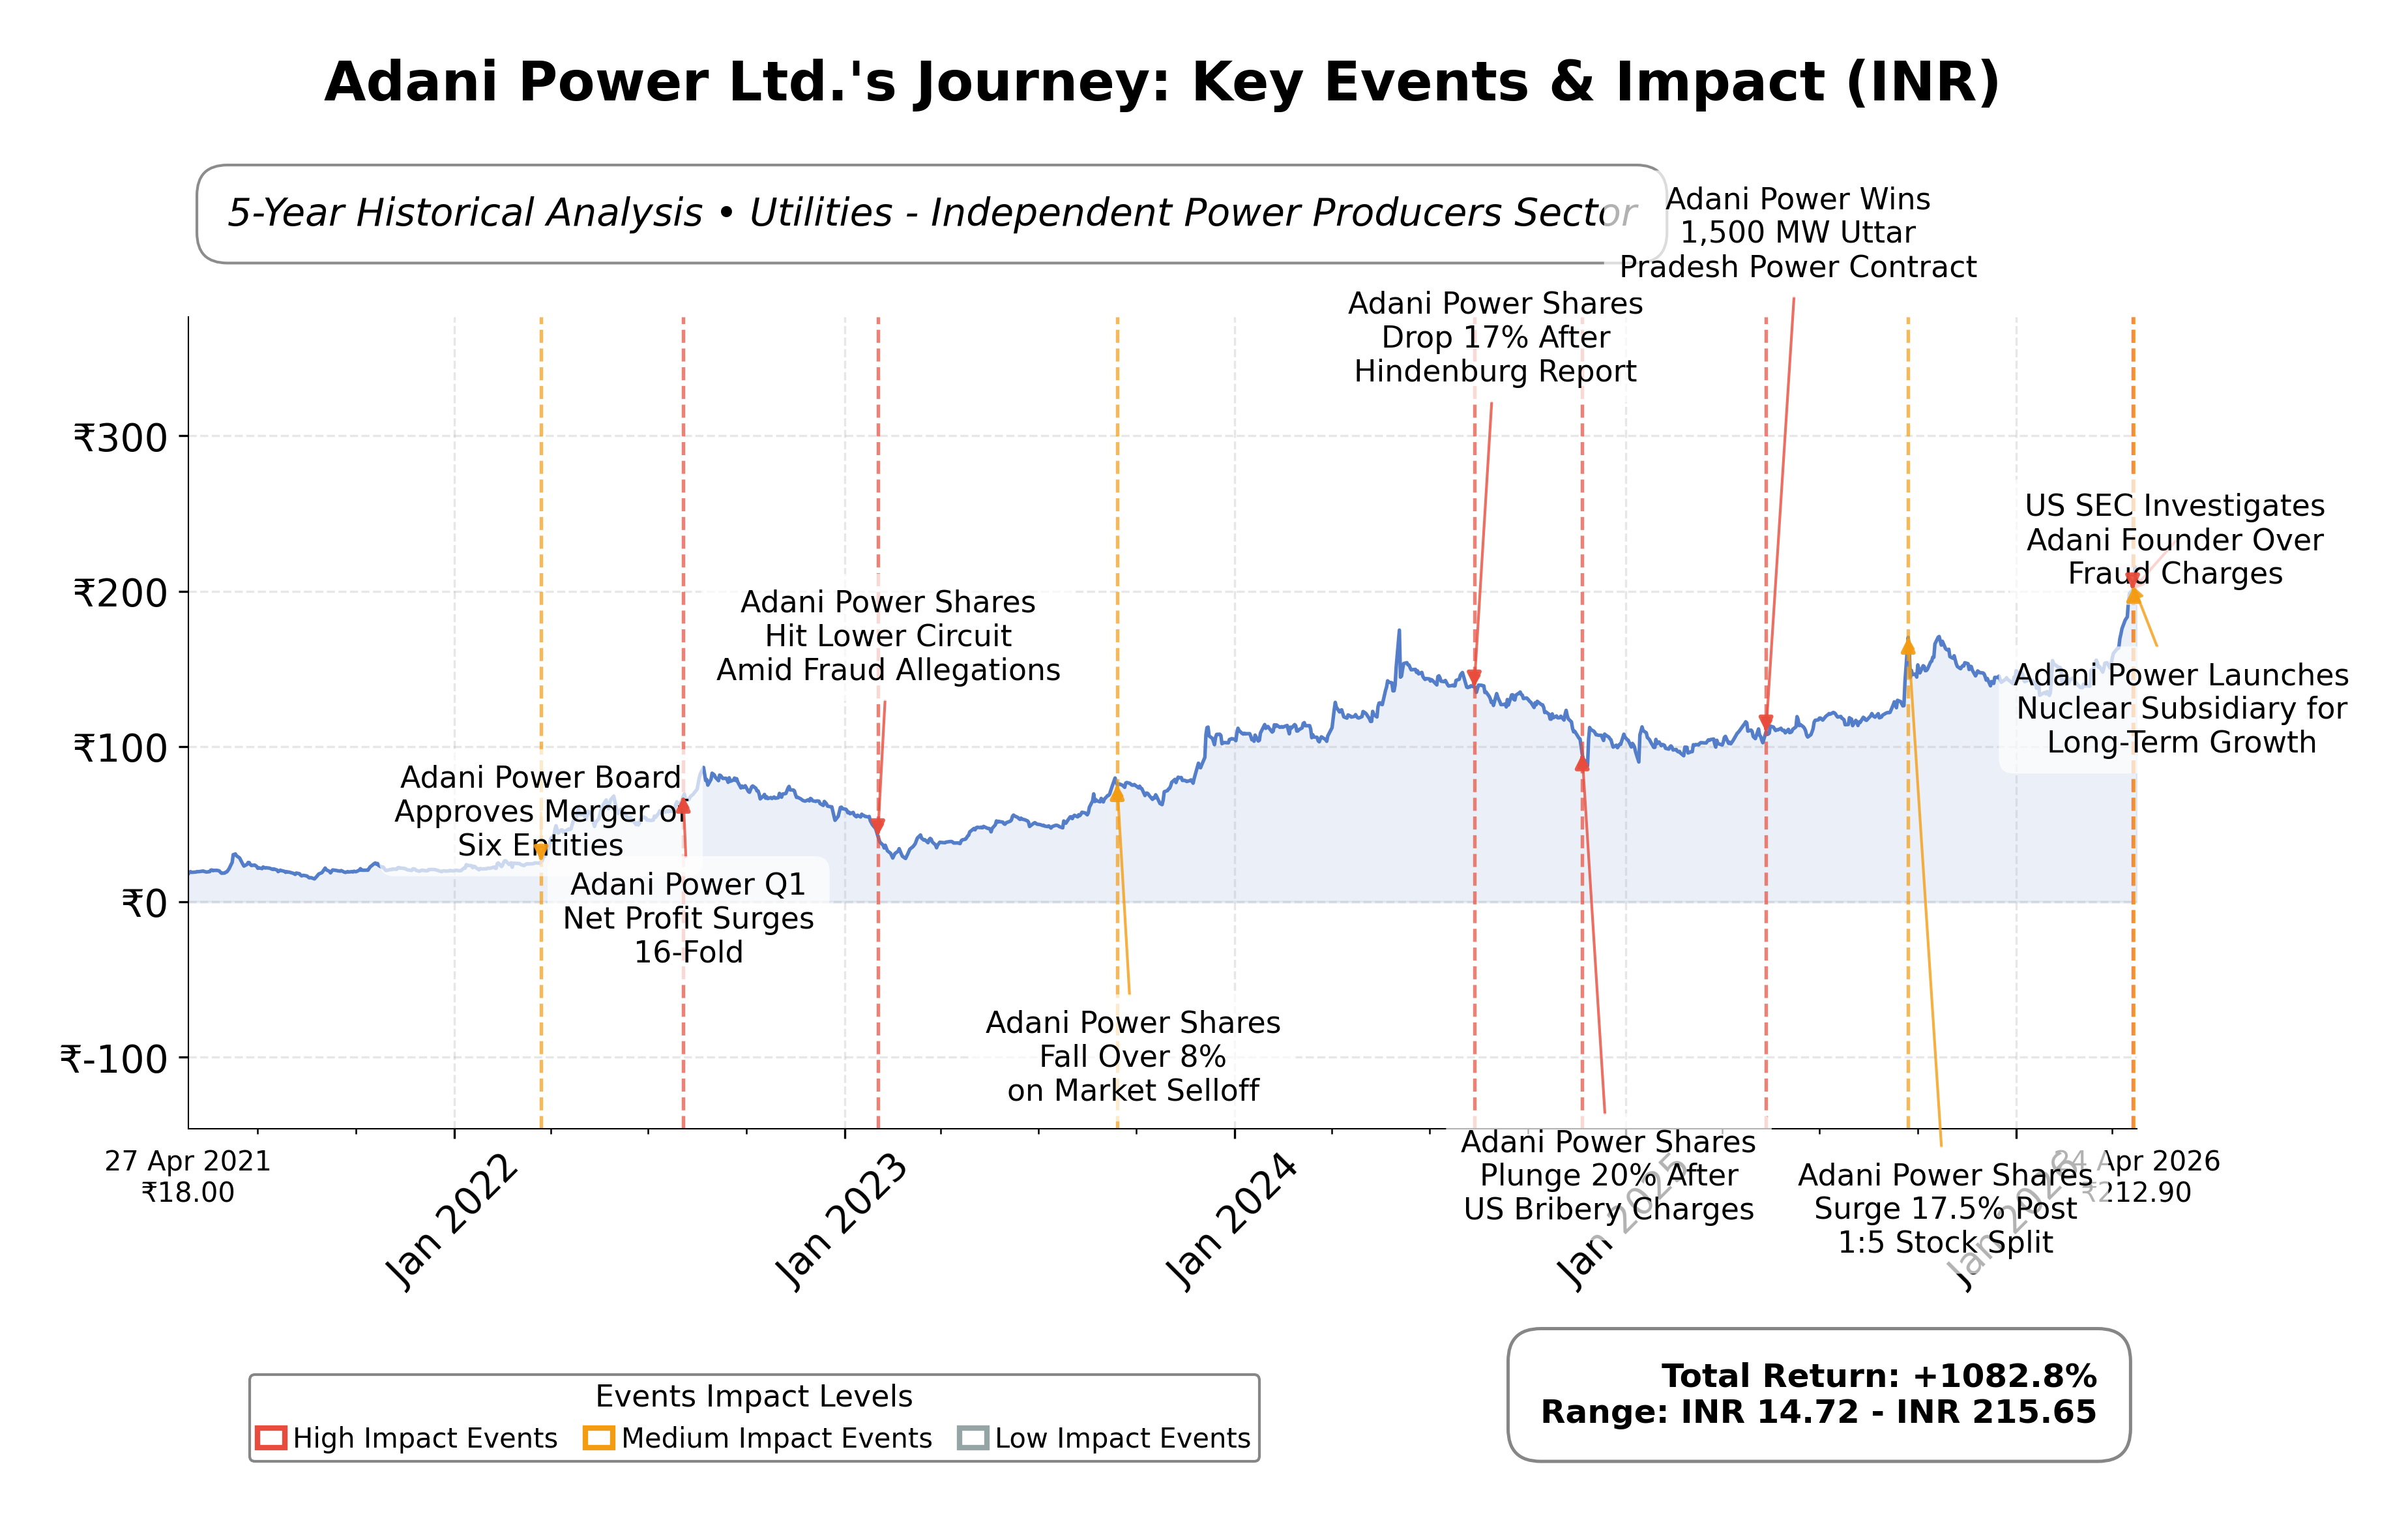
Stock Journey
Key Positives and Key Risks
Pros
- Return on equity of 21.61% demonstrates strong profitability relative to peers.
- Operating cash flow of INR 180.3 billion and free cash flow of INR 124.6 billion indicate solid cash generation capacity.
- Market capitalization of INR 4.11 trillion reflects significant scale and market presence.
Cons
- Negative quarterly revenue growth of -8.9% signals recent operational challenges.
- High price-to-book ratio of 7.03 suggests the stock is trading at a premium valuation.
- Debt-to-equity ratio of 81.25% indicates moderate leverage that could impact financial flexibility.
Disclosure: This information is for general awareness and does not constitute investment advice
Report Summary
Adani Power Ltd. is a prominent energy producer in India, operating primarily in the utilities sector with a focus on independent power production. Listed on the NSE, the company is part of the larger Adani Group conglomerate and operates a mix of thermal and solar power plants across India. Its strategic presence supports the national grid and contributes to the country's growing electricity demand, positioning it as a key player in the Indian power generation industry.
Financially, Adani Power reported trailing twelve months (TTM) revenue of approximately INR 542.5 billion, with a gross margin of 43.48%, operating margin of 24.92%, and net profit margin of 21.11%. The company’s return on equity (ROE) stands at 21.61%, return on assets (ROA) at 11.04%, and return on invested capital (ROIC) is reflected in an enterprise value to EBITDA ratio of 22.51, indicating solid profitability and operational efficiency within its sector.
Valuation metrics show a trailing price-to-earnings (P/E) ratio of 36.27 and a price-to-book (P/B) ratio of 7.03, with a forward P/E of 31.19. The enterprise value is approximately INR 4.51 trillion, and the market capitalization is INR 4.11 trillion. The stock is currently trading near its 52-week high of INR 217.25, with a current price of INR 218.50, reflecting a 52-week price range between INR 101 and INR 217.25.
Key strengths include robust operating cash flow of INR 180.3 billion and levered free cash flow of INR 124.6 billion, alongside a manageable total debt of INR 484.6 billion and a current ratio of 1.60, indicating reasonable liquidity. Risks include the negative PEG ratio of -1.63, signaling challenges in growth expectations, and sector-specific regulatory and competitive pressures. The company’s recent 5-for-1 stock split in September 2025 and its expanding renewable energy portfolio are notable strategic developments.
Technically, the stock is trading above both its 50-day and 200-day moving averages, with a low beta of 0.15 suggesting limited volatility relative to the market. Momentum indicators and multi-timeframe analysis suggest a stable upward trend, though the recent slight decline in quarterly revenue and earnings growth warrants monitoring. Overall, the data suggests a balanced environment where market participants may consider accumulation or observation depending on evolving fundamentals.
Company and Industry Overview
Company Basics
Price Performance
Company Size
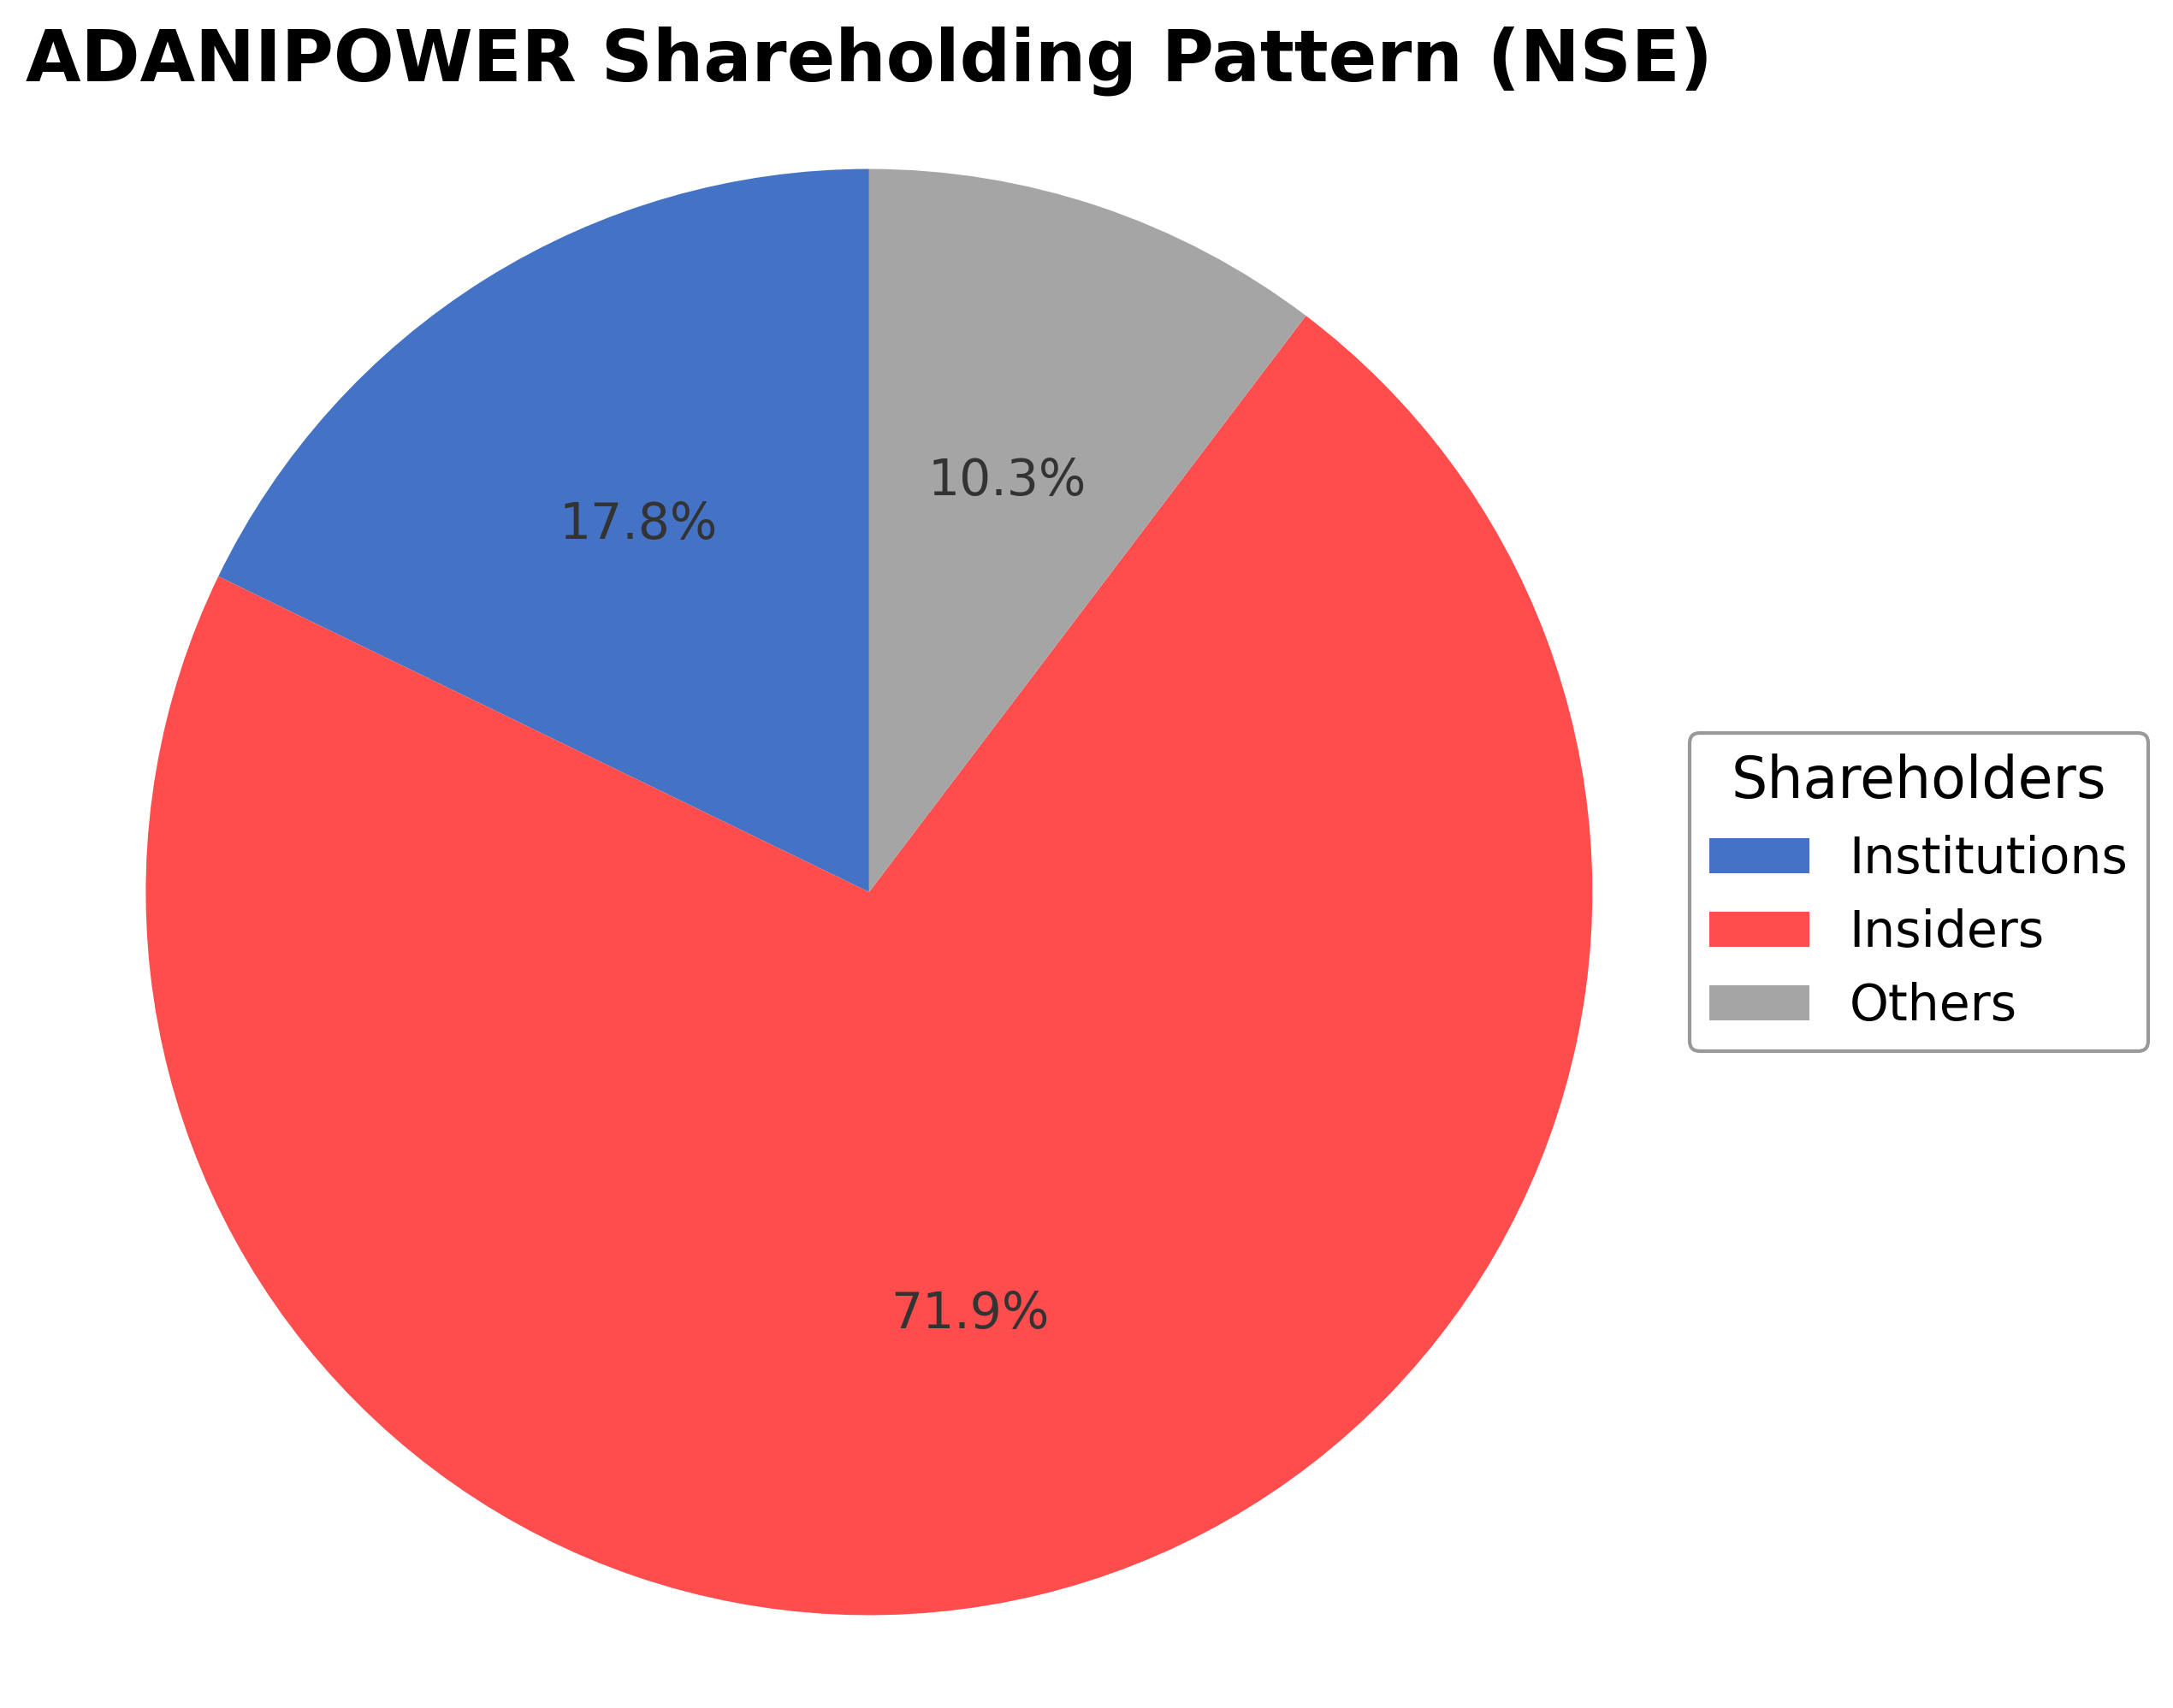
Shareholding Pattern
Sector and Industry Analysis
The Indian power sector is one of the largest and fastest-growing globally, driven by rising energy demand from industrialization and urbanization. The sector's installed capacity surpassed 400 GW as of 2025, with thermal power constituting a significant share, though renewable capacity is rapidly increasing. Major players include NTPC, Tata Power, and Adani Power, which is among the largest private thermal power producers with an operating capacity of 17.5 GW.
Industry dynamics are shaped by a gradual shift from coal-based thermal power to renewable energy sources, reflecting government priorities and global climate commitments. Barriers to entry remain high due to capital intensity, fuel supply logistics, and regulatory approvals. Companies like Adani Power leverage scale, diversified fuel linkages, and strategic acquisitions to maintain competitive advantages amid increasing operational and environmental challenges.
The regulatory environment is evolving with stricter emissions norms and policies favoring renewable integration, impacting coal-reliant firms. Tariff regulations and power purchase agreements influence revenue stability, while government incentives support capacity expansion and cleaner technologies. Adani Power faces regulatory scrutiny and tariff fluctuations but benefits from captive fuel sources and strategic capacity growth plans aligned with national energy goals.
Note: Analysis synthesized from industry research, market reports, and regulatory filings. Information is subject to change based on market conditions.
Financial Ratios Dashboard
Illustrative Scenario Analysis
DCF Assumptions:
Method: Two-Stage EPS-Priority Model
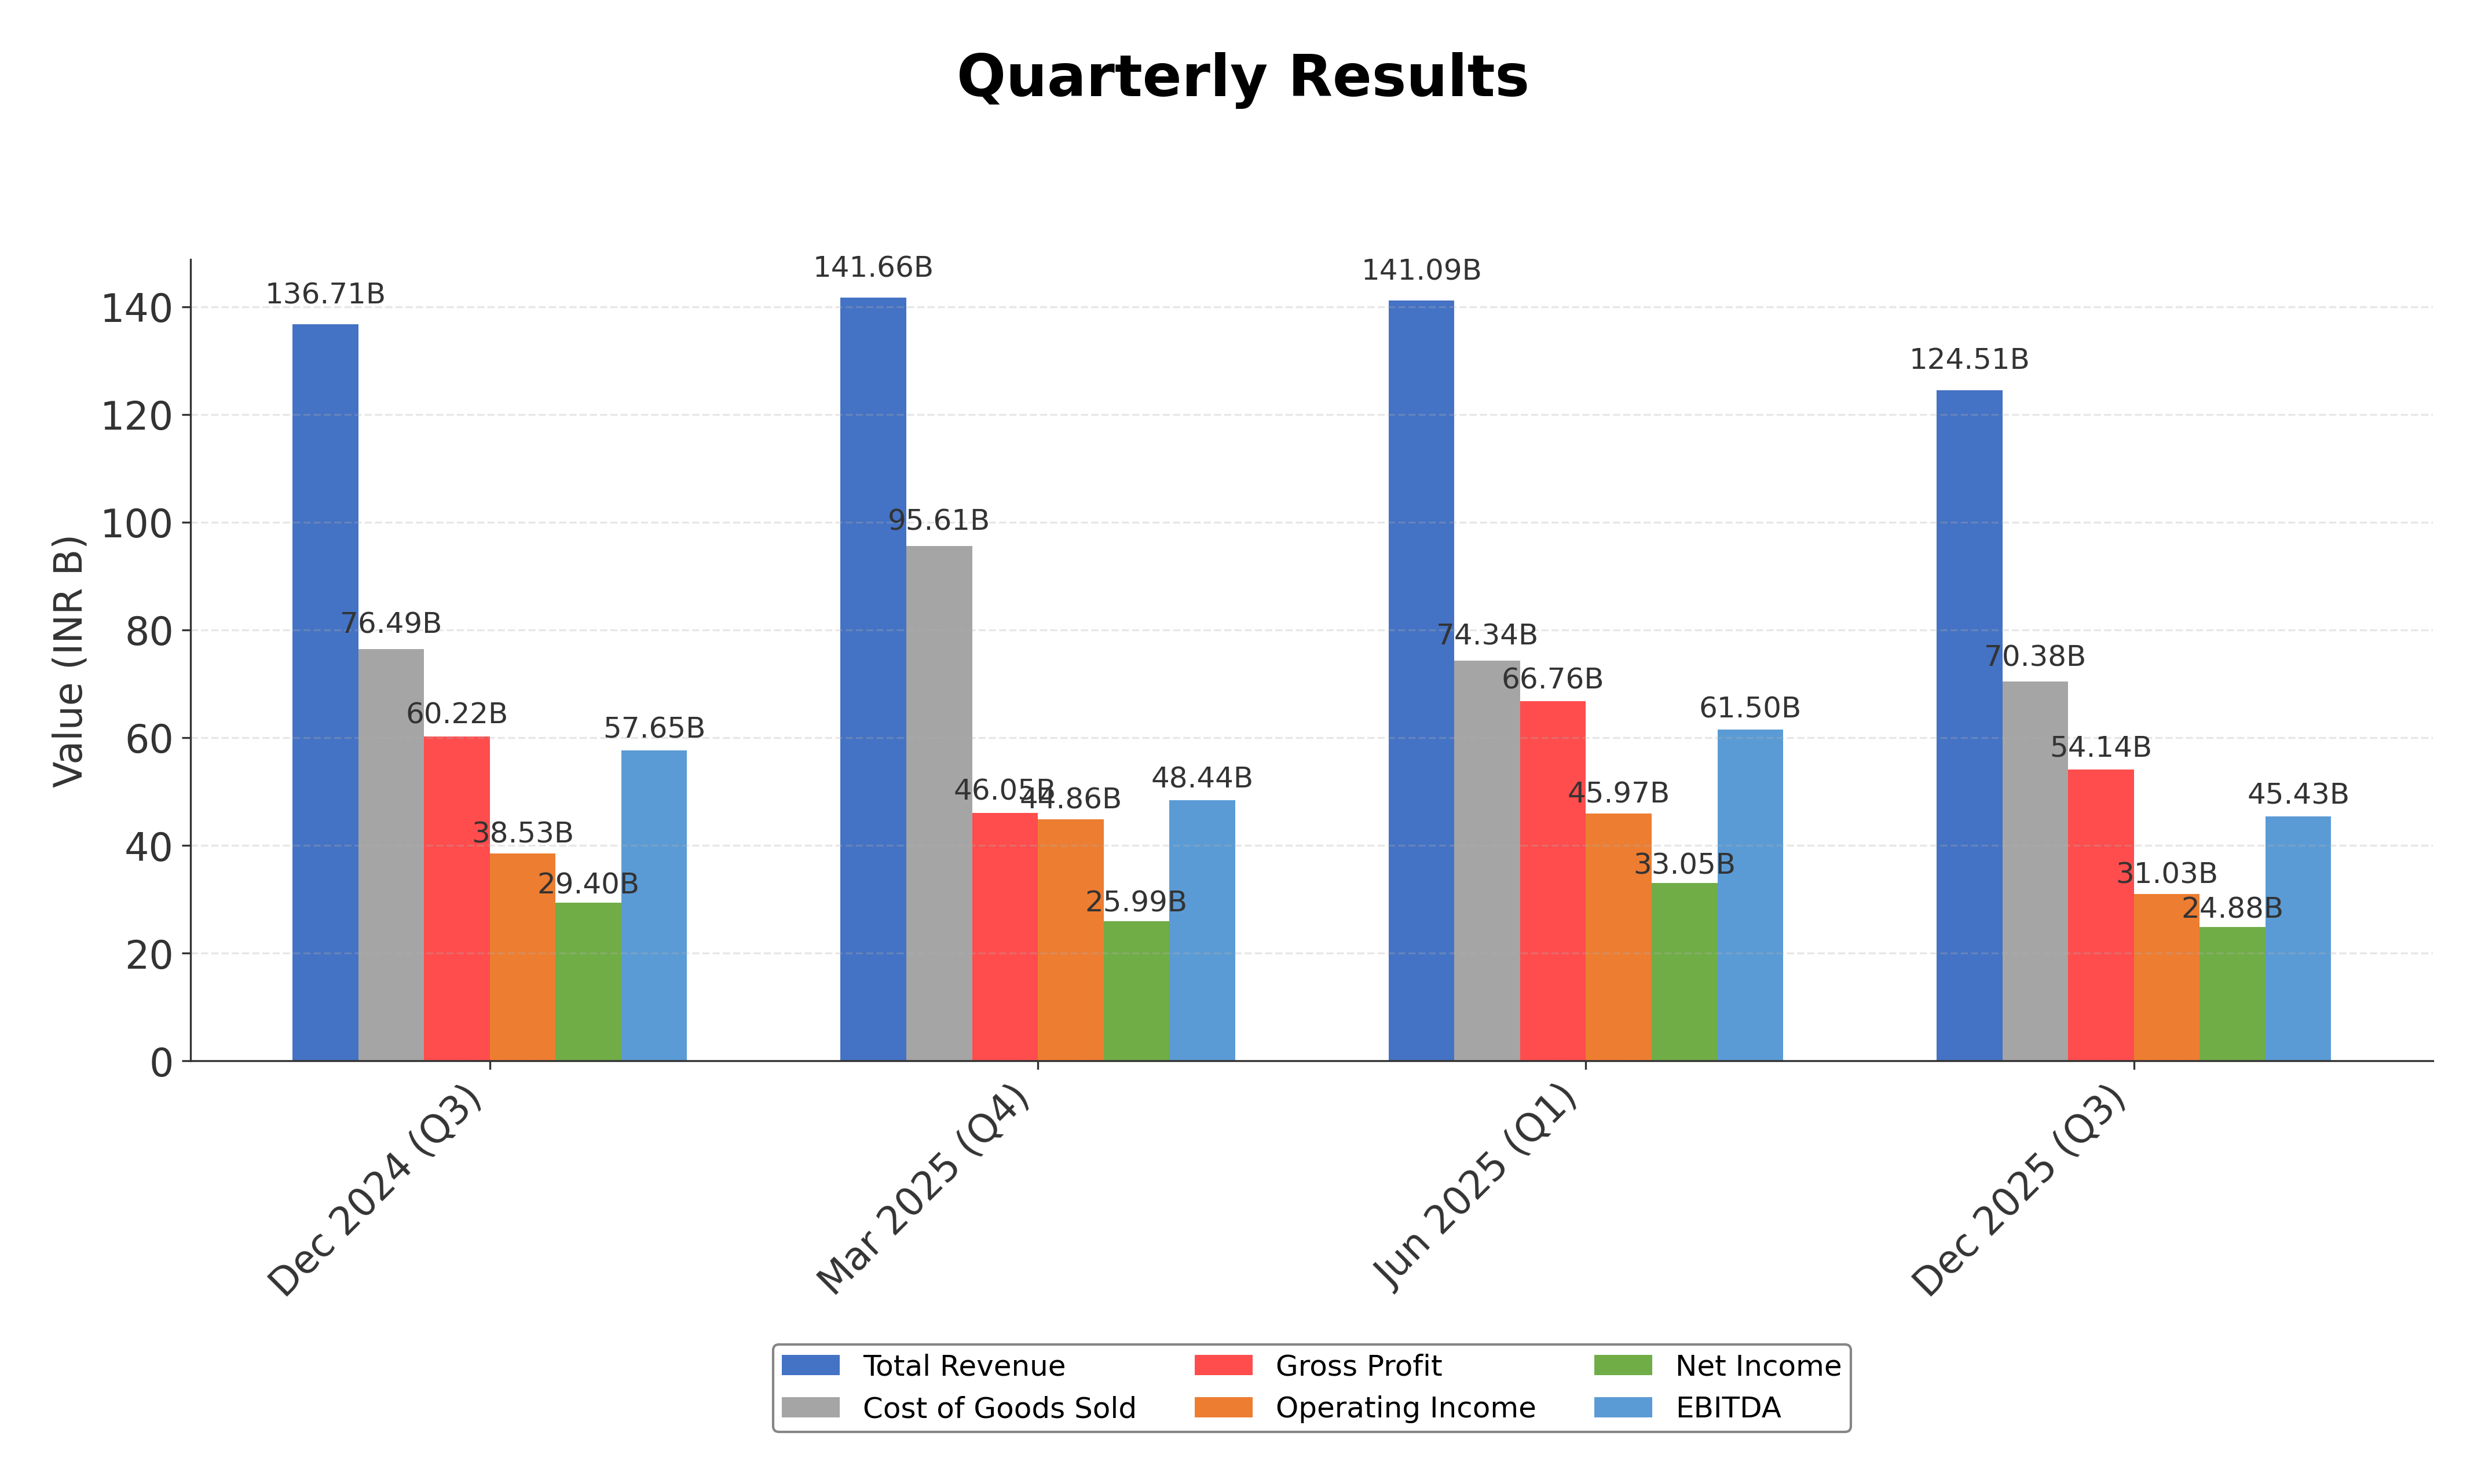
Financials
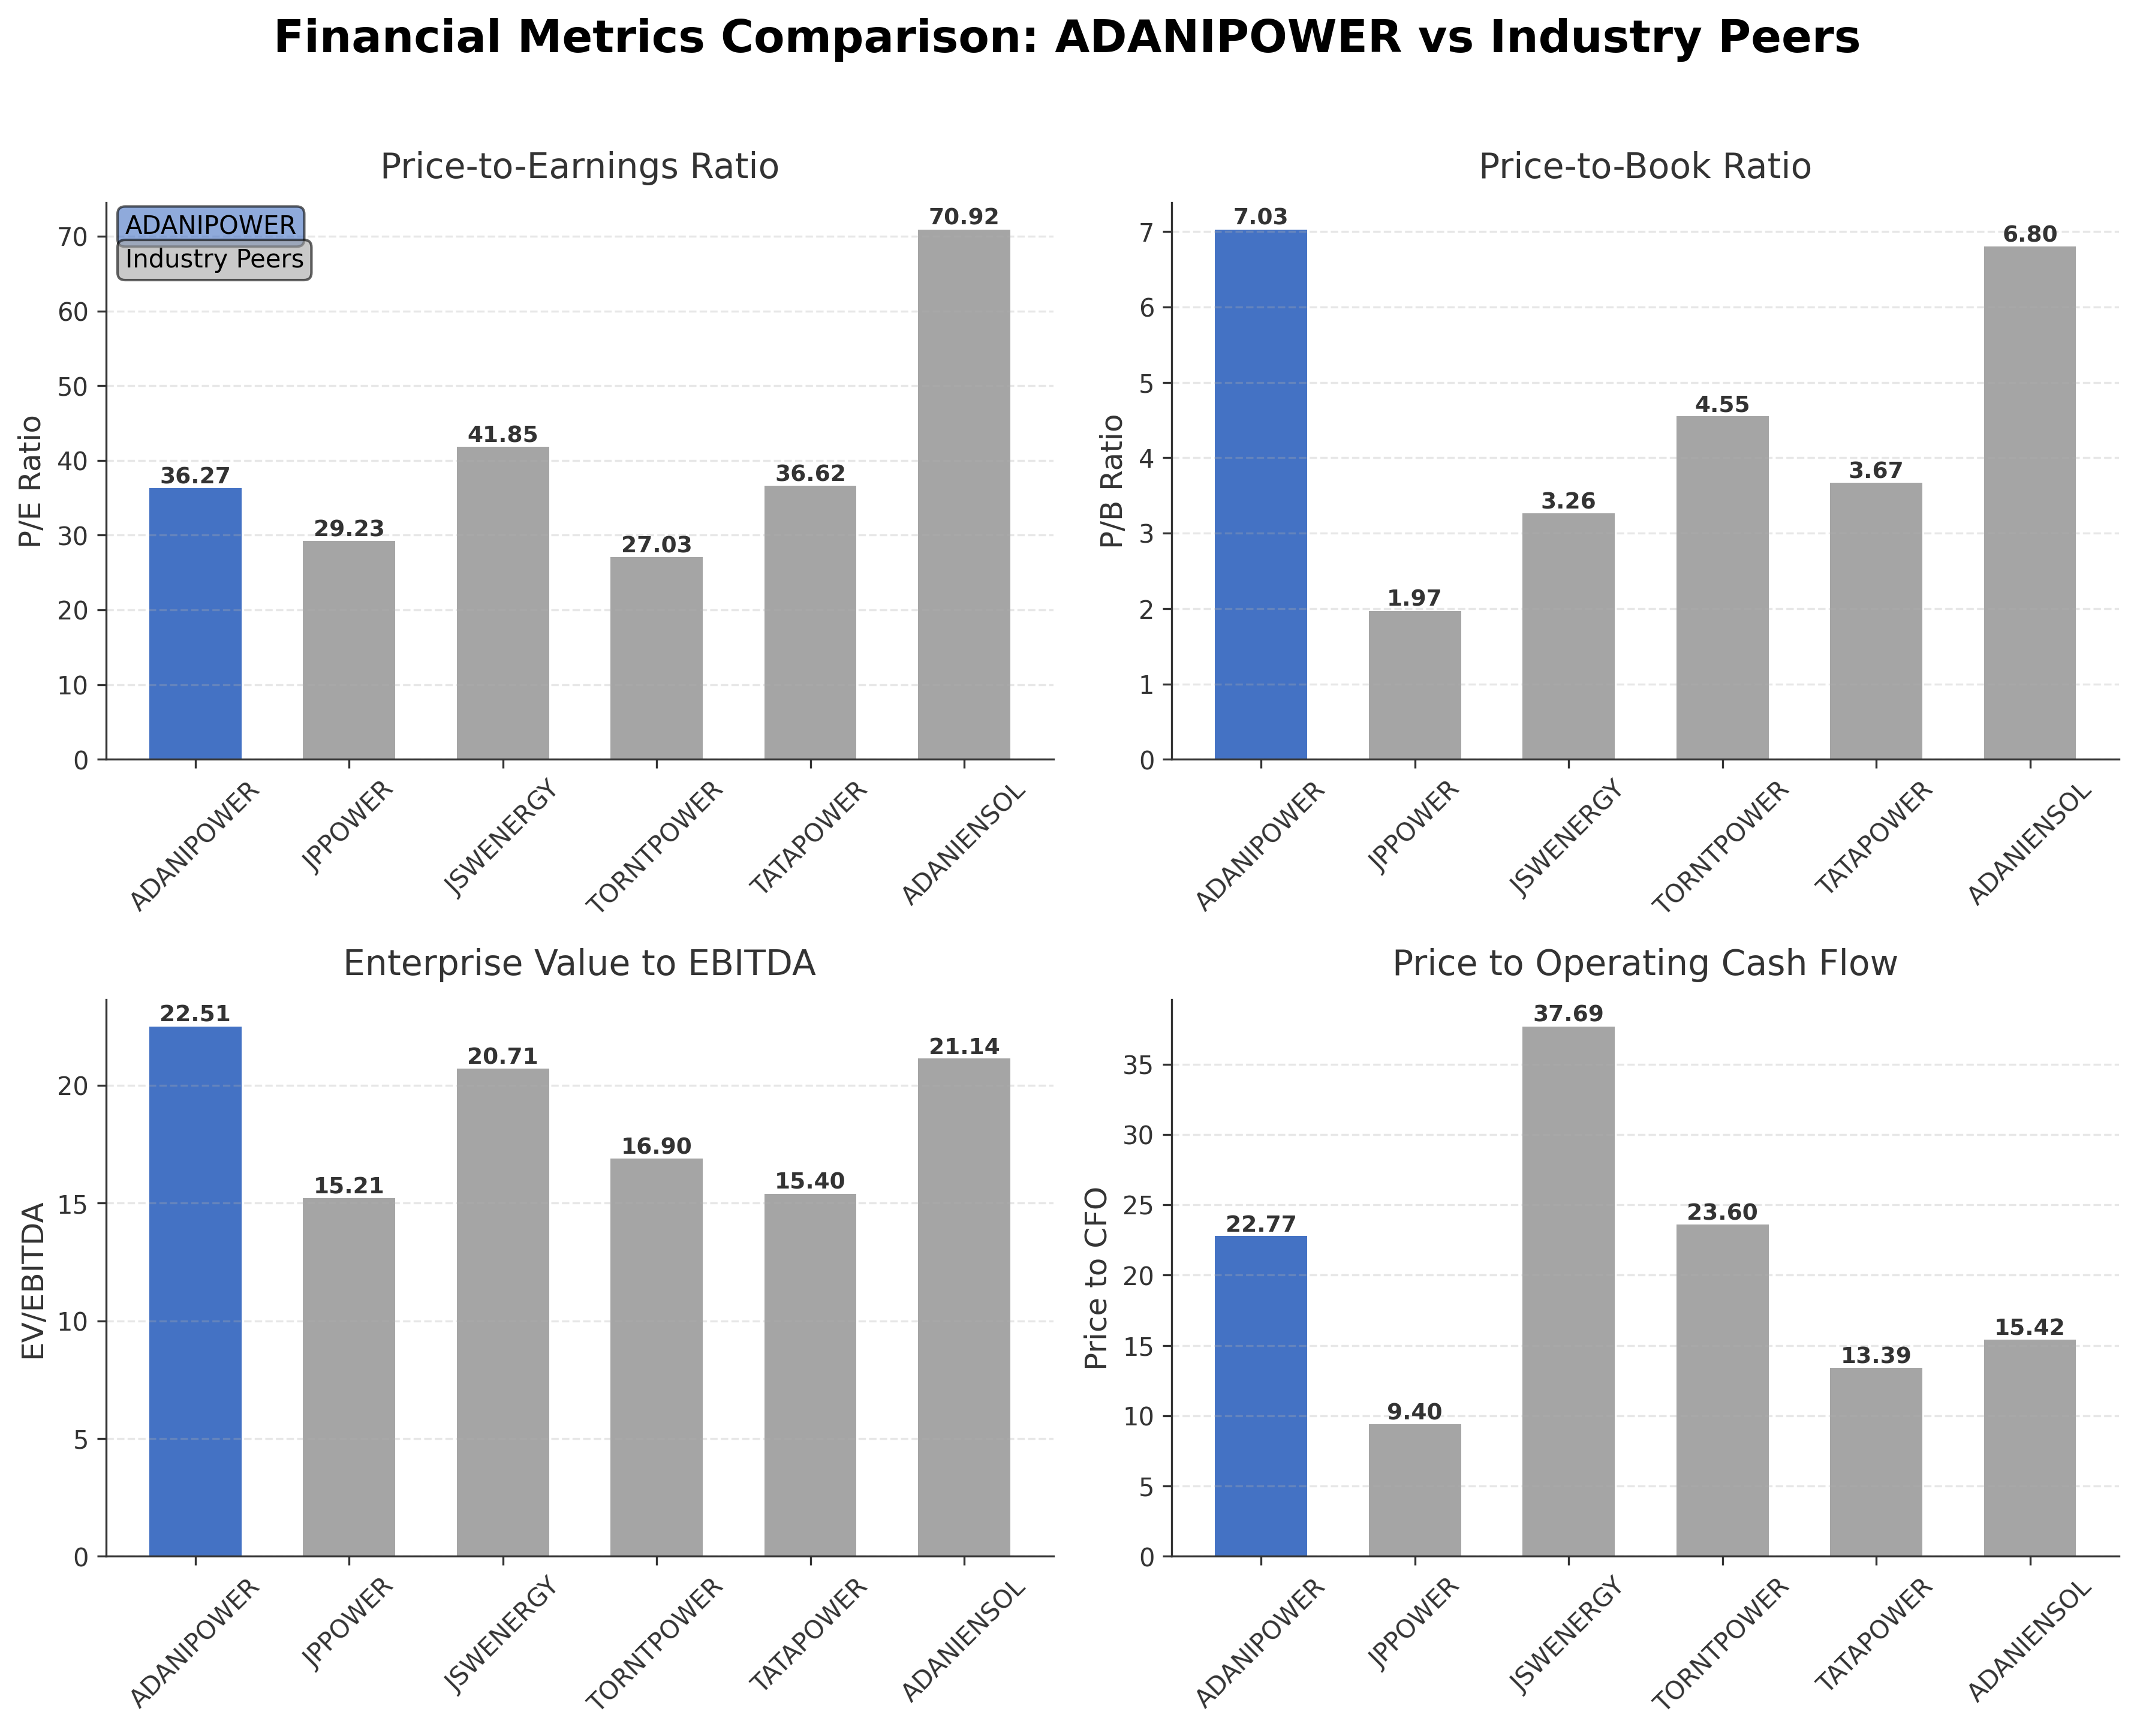
Peer Analysis
| Company Name | Market Cap | P/E Ratio | P/B Ratio | EV/EBITDA | Price to CFO |
|---|---|---|---|---|---|
| Adani Power Ltd. | ₹4.11T | 36.27 | 7.03 | 22.51 | 22.77 |
| Jaiprakash Power Ventures Ltd. | ₹132.20B | 29.23 | 1.97 | 15.21 | 9.40 |
| JSW Energy Ltd. | ₹957.00B | 41.85 | 3.26 | 20.71 | 37.69 |
| Torrent Power Ltd. | ₹856.38B | 27.03 | 4.55 | 16.90 | 23.60 |
| Tata Power Company Limited | ₹1.39T | 36.62 | 3.67 | 15.40 | 13.39 |
| Adani Energy Solutions Ltd. | ₹1.70T | 70.92 | 6.80 | 21.14 | 15.42 |
Comparison Analysis: Adani Power Ltd. exhibits a higher P/E ratio of 36.27 compared to most peers, indicating relatively elevated valuation levels. Its P/B ratio of 7.03 is also above the peer average, reflecting premium pricing relative to book value. The EV/EBITDA multiple of 22.51 is on the higher side, suggesting a more expensive enterprise valuation. However, Adani Power's return on equity at 21.61% significantly exceeds peer averages, demonstrating superior profitability. Price to CFO is moderate relative to peers, indicating balanced cash flow valuation. Overall, Adani Power stands out for its strong profitability metrics but trades at a premium valuation compared to regional industry peers.
Financial Metrics Comparison with Peers
Financial Statements
Comprehensive financial data including income, balance sheet, and cash flow metrics
Income Statement
| fiscal_date | 2025-03-31 | 2024-03-31 | 2023-03-31 | 2022-03-31 | 2021-03-31 |
|---|---|---|---|---|---|
| Sales | 561.32B | 502.84B | 387.17B | 276.55B | 261.51B |
| Cost Of Goods | 324.90B | 302.93B | 271.89B | 168.23B | 166.13B |
| Gross Profit | 236.41B | 199.91B | 115.29B | 108.32B | 95.38B |
| Operating Expense Selling General And Administrative | 3.74B | 3.15B | 2.58B | 1.64B | 1.64B |
| Operating Expense Other Operating Expenses | 9.13B | 8.48B | 5.26B | 2.82B | 2.95B |
| Operating Income | 177.55B | 147.22B | 72.41B | 71.72B | 58.32B |
| Non Operating Interest Income | 14.44B | 89.21B | 36.07B | 35.58B | 10.45B |
| Non Operating Interest Expense | 30.73B | 30.79B | 30.40B | 38.72B | 46.48B |
| Pretax Income | 163.60B | 207.92B | 76.75B | 65.77B | 22.89B |
| Income Tax | 36.10B | -372.80M | -30.52B | 16.66B | 10.19B |
| Net Income | 127.50B | 208.29B | 107.27B | 49.12B | 12.70B |
| Eps Basic | 6.46 | 51.62 | 24.57 | 9.63 | 0.06 |
| Eps Diluted | 6.46 | 51.62 | 24.57 | 9.63 | 0.06 |
| Basic Shares Outstanding | 19.28B | 3.86B | 3.86B | 3.86B | 3.86B |
| Diluted Shares Outstanding | 19.28B | 3.86B | 3.86B | 3.86B | 3.86B |
| Ebit | 194.32B | 238.71B | 107.15B | 104.49B | 69.36B |
| Ebitda | 239.40B | 278.18B | 139.37B | 136.68B | 104.87B |
| Net Income Continuous Operations | 163.60B | 207.92B | 76.75B | 65.77B | 22.89B |
| Minority Interests | 1.89B | N/A | N/A | 0.00 | 0.00 |
| Preferred Stock Dividends | 4.75B | 9.19B | 12.52B | 11.98B | 12.45B |
Source: Financial statements and regulatory filings
Balance Sheet
| fiscal_date | 2025-03-31 | 2024-03-31 | 2023-03-31 | 2022-03-31 | 2021-03-31 |
|---|---|---|---|---|---|
| Cash And Cash Equivalents | 3.20B | 11.36B | 3.49B | 7.82B | 1.13B |
| Accounts Receivable | 130.22B | 116.77B | 115.29B | 95.61B | 118.39B |
| Total Assets | 1129.18B | 923.25B | 858.21B | 819.81B | 788.06B |
| Total Liabilities | 552.44B | 491.80B | 559.46B | 632.78B | 656.93B |
| Long Term Debt | 286.02B | 265.54B | 336.22B | 378.11B | 399.68B |
| Shareholders Equity | 576.74B | 431.45B | 298.76B | 187.03B | 131.13B |
Source: Financial statements and regulatory filings
Cash Flow Statement
| fiscal_date | 2025-03-31 | 2024-03-31 | 2023-03-31 | 2022-03-31 | 2021-03-31 |
|---|---|---|---|---|---|
| Operating Activities Net Income | 163.60B | 207.92B | 76.75B | 65.77B | 22.89B |
| Operating Activities Other Non Cash Items | 12.32B | -60.17B | -6.07B | 3.29B | 34.49B |
| Operating Activities Accounts Receivable | -3.42B | -17.38B | -29.95B | 9.81B | 1.89B |
| Operating Activities Other Assets Liabilities | 7.81B | -33.27B | 20.68B | -3.08B | -3.46B |
| Operating Activities Operating Cash Flow | 180.32B | 97.09B | 61.40B | 75.79B | 55.81B |
| Investing Activities Capital Expenditures | -115.44B | 5.60M | 8.30M | 12.40M | 99.60M |
| Investing Activities Net Acquisitions | -63.96B | 5.34B | 2.62B | -10.00M | 0.00 |
| Investing Activities Purchase Of Investments | -6.26B | N/A | -4.58B | -1.62B | -4.29B |
| Investing Activities Sale Of Investments | 0.00 | 4.06B | 0.00 | 815.40M | 21.49B |
| Investing Activities Other Investing Activity | 5.12B | -45.45B | 1.51B | -2.15B | -3.85B |
| Investing Activities Investing Cash Flow | -180.54B | -36.04B | -440.60M | -2.95B | 13.45B |
| Financing Activities Long Term Debt Issuance | 37.13B | 226.72B | 212.05B | 133.32B | 225.58B |
| Financing Activities Long Term Debt Payments | -28.52B | -305.98B | -269.48B | -178.96B | -251.33B |
| Financing Activities Short Term Debt Issuance | 27.43B | 18.97B | -12.00B | -18.32B | 7.04B |
| Financing Activities Common Stock Issuance | 2.50B | N/A | N/A | N/A | N/A |
| Financing Activities Common Stock Repurchase | -5.00B | N/A | N/A | N/A | N/A |
| Financing Activities Other Financing Charges | -50.98B | -74.03B | -946.80M | 101.70M | 196.40M |
| Financing Activities Financing Cash Flow | -17.45B | -134.33B | -70.38B | -63.85B | -18.50B |
| End Cash Position | 3.20B | 11.36B | 3.49B | 7.82B | 1.13B |
| Free Cash Flow | 99.42B | 115.68B | 51.87B | 67.98B | 33.97B |
Source: Financial statements and regulatory filings
Technical Analysis
Key Insights
- The stock is currently in an upward trend, trading above its 50-day moving average of ₹157.79 and 200-day moving average of ₹144.58, indicating sustained bullish momentum.
- Key support levels are observed near ₹157 and ₹145, while resistance is close to the recent 52-week high of ₹217.25.
- The price remains comfortably above the 10-day moving average, reinforcing short-term strength.
- Momentum indicators show RSI in a neutral to slightly overbought range, MACD remains positive, and stochastic oscillators suggest moderate upward momentum.
- Analysis across daily, weekly, and monthly timeframes confirms a consistent upward trend with no immediate signs of reversal.
- Current technical setup suggests potential continuation of the upward trend, with possible consolidation near resistance levels before further moves.
Trending News
No trending news available.
Recent Updates
News Summary
As of the latest available data, there are no recent significant news updates or web articles related to Adani Power Ltd. covering earnings, leadership changes, strategic partnerships, or regulatory developments within the past three months. The absence of new material events suggests a period of operational stability without major corporate announcements or market-moving disclosures.
News Sentiment
The overall sentiment from recent updates is neutral due to the lack of fresh news. No positive or negative catalysts have emerged recently to influence market perception or investor sentiment significantly. This stable news environment reflects a holding pattern in company developments.
Source List
Analytical Overview
Analysis Summary
Adani Power’s valuation metrics, including a trailing P/E of 36.27 and forward P/E of 31.19, are slightly elevated relative to the industry average P/E of 36.27, indicating pricing in line with sector norms but at a premium to some peers. The company’s revenue growth is negative at -8.9% quarterly, and cash flow trends remain robust with operating cash flow of INR 180.3 billion and free cash flow of INR 124.6 billion, demonstrating solid cash generation despite recent revenue contraction. Financial health is supported by a current ratio of 1.60 and a debt-to-equity ratio of 81.25%, reflecting moderate leverage balanced by strong liquidity. Sector-specific challenges include regulatory oversight and competition within India’s power generation market, while opportunities arise from expanding renewable energy capacity and government support for sustainable power. Considering India’s regulatory environment and growing energy demand, Adani Power’s market positioning and operational scale provide competitive advantages.
Overall Business and Market Assessment
Supporting Factors: strong profitability with a 21.61% ROE, robust cash flow generation, and a strategic position within India’s growing power sector
Risk Factors: the recent negative revenue growth trend and relatively high valuation multiples compared to some peers
SWOT Analysis
Strengths
- Strong profitability with a return on equity of 21.61%.
- Robust operating and free cash flow generation supporting liquidity.
- Strategic presence across India with diversified thermal and solar power assets.
- Part of the well-established Adani Group providing operational and financial support.
Weaknesses
- Negative recent quarterly revenue growth of -8.9%.
- High price-to-book ratio of 7.03 indicating premium valuation.
- Moderate leverage with a debt-to-equity ratio of 81.25%.
- Lack of dividend payments may limit income-focused investor appeal.
Opportunities
- Expansion into renewable energy aligns with national and global sustainability goals.
- Government initiatives supporting infrastructure development in the power sector.
- Potential for operational efficiencies and capacity enhancements.
- Growing electricity demand in India provides long-term market growth.
Threats
- Regulatory risks inherent in the Indian utilities sector.
- Intense competition from other power producers and alternative energy sources.
- Macroeconomic factors impacting energy consumption and pricing.
- Volatility in fuel prices affecting operational costs.
Company Description
Adani Power Ltd. is an integral energy producer, primarily focusing on the generation of electricity across India. A member of the Adani Group, one of India's eminent conglomerates, this company plays a pivotal role in catering to the country's substantial energy demands. It operates both thermal and solar power plants, thus contributing significantly to the energy mix, which is crucial for meeting industrial and household electricity needs in a rapidly developing economy. Noted for its efficient and large-scale operations, Adani Power has facilities strategically located in various parts of India, which supports grid reliability and reduces transmission losses. The company’s ventures into renewable energy align with global and national sustainable energy goals. As a key player in India's energy sector, Adani Power Ltd. aids in driving economic growth by ensuring stable power supply and is actively involved in large-scale projects that aim to enhance its capacity and infrastructure to support the nation’s growing energy requirements.