
Adani Power Ltd (ADANIPOWER)
Stock Analysis Report
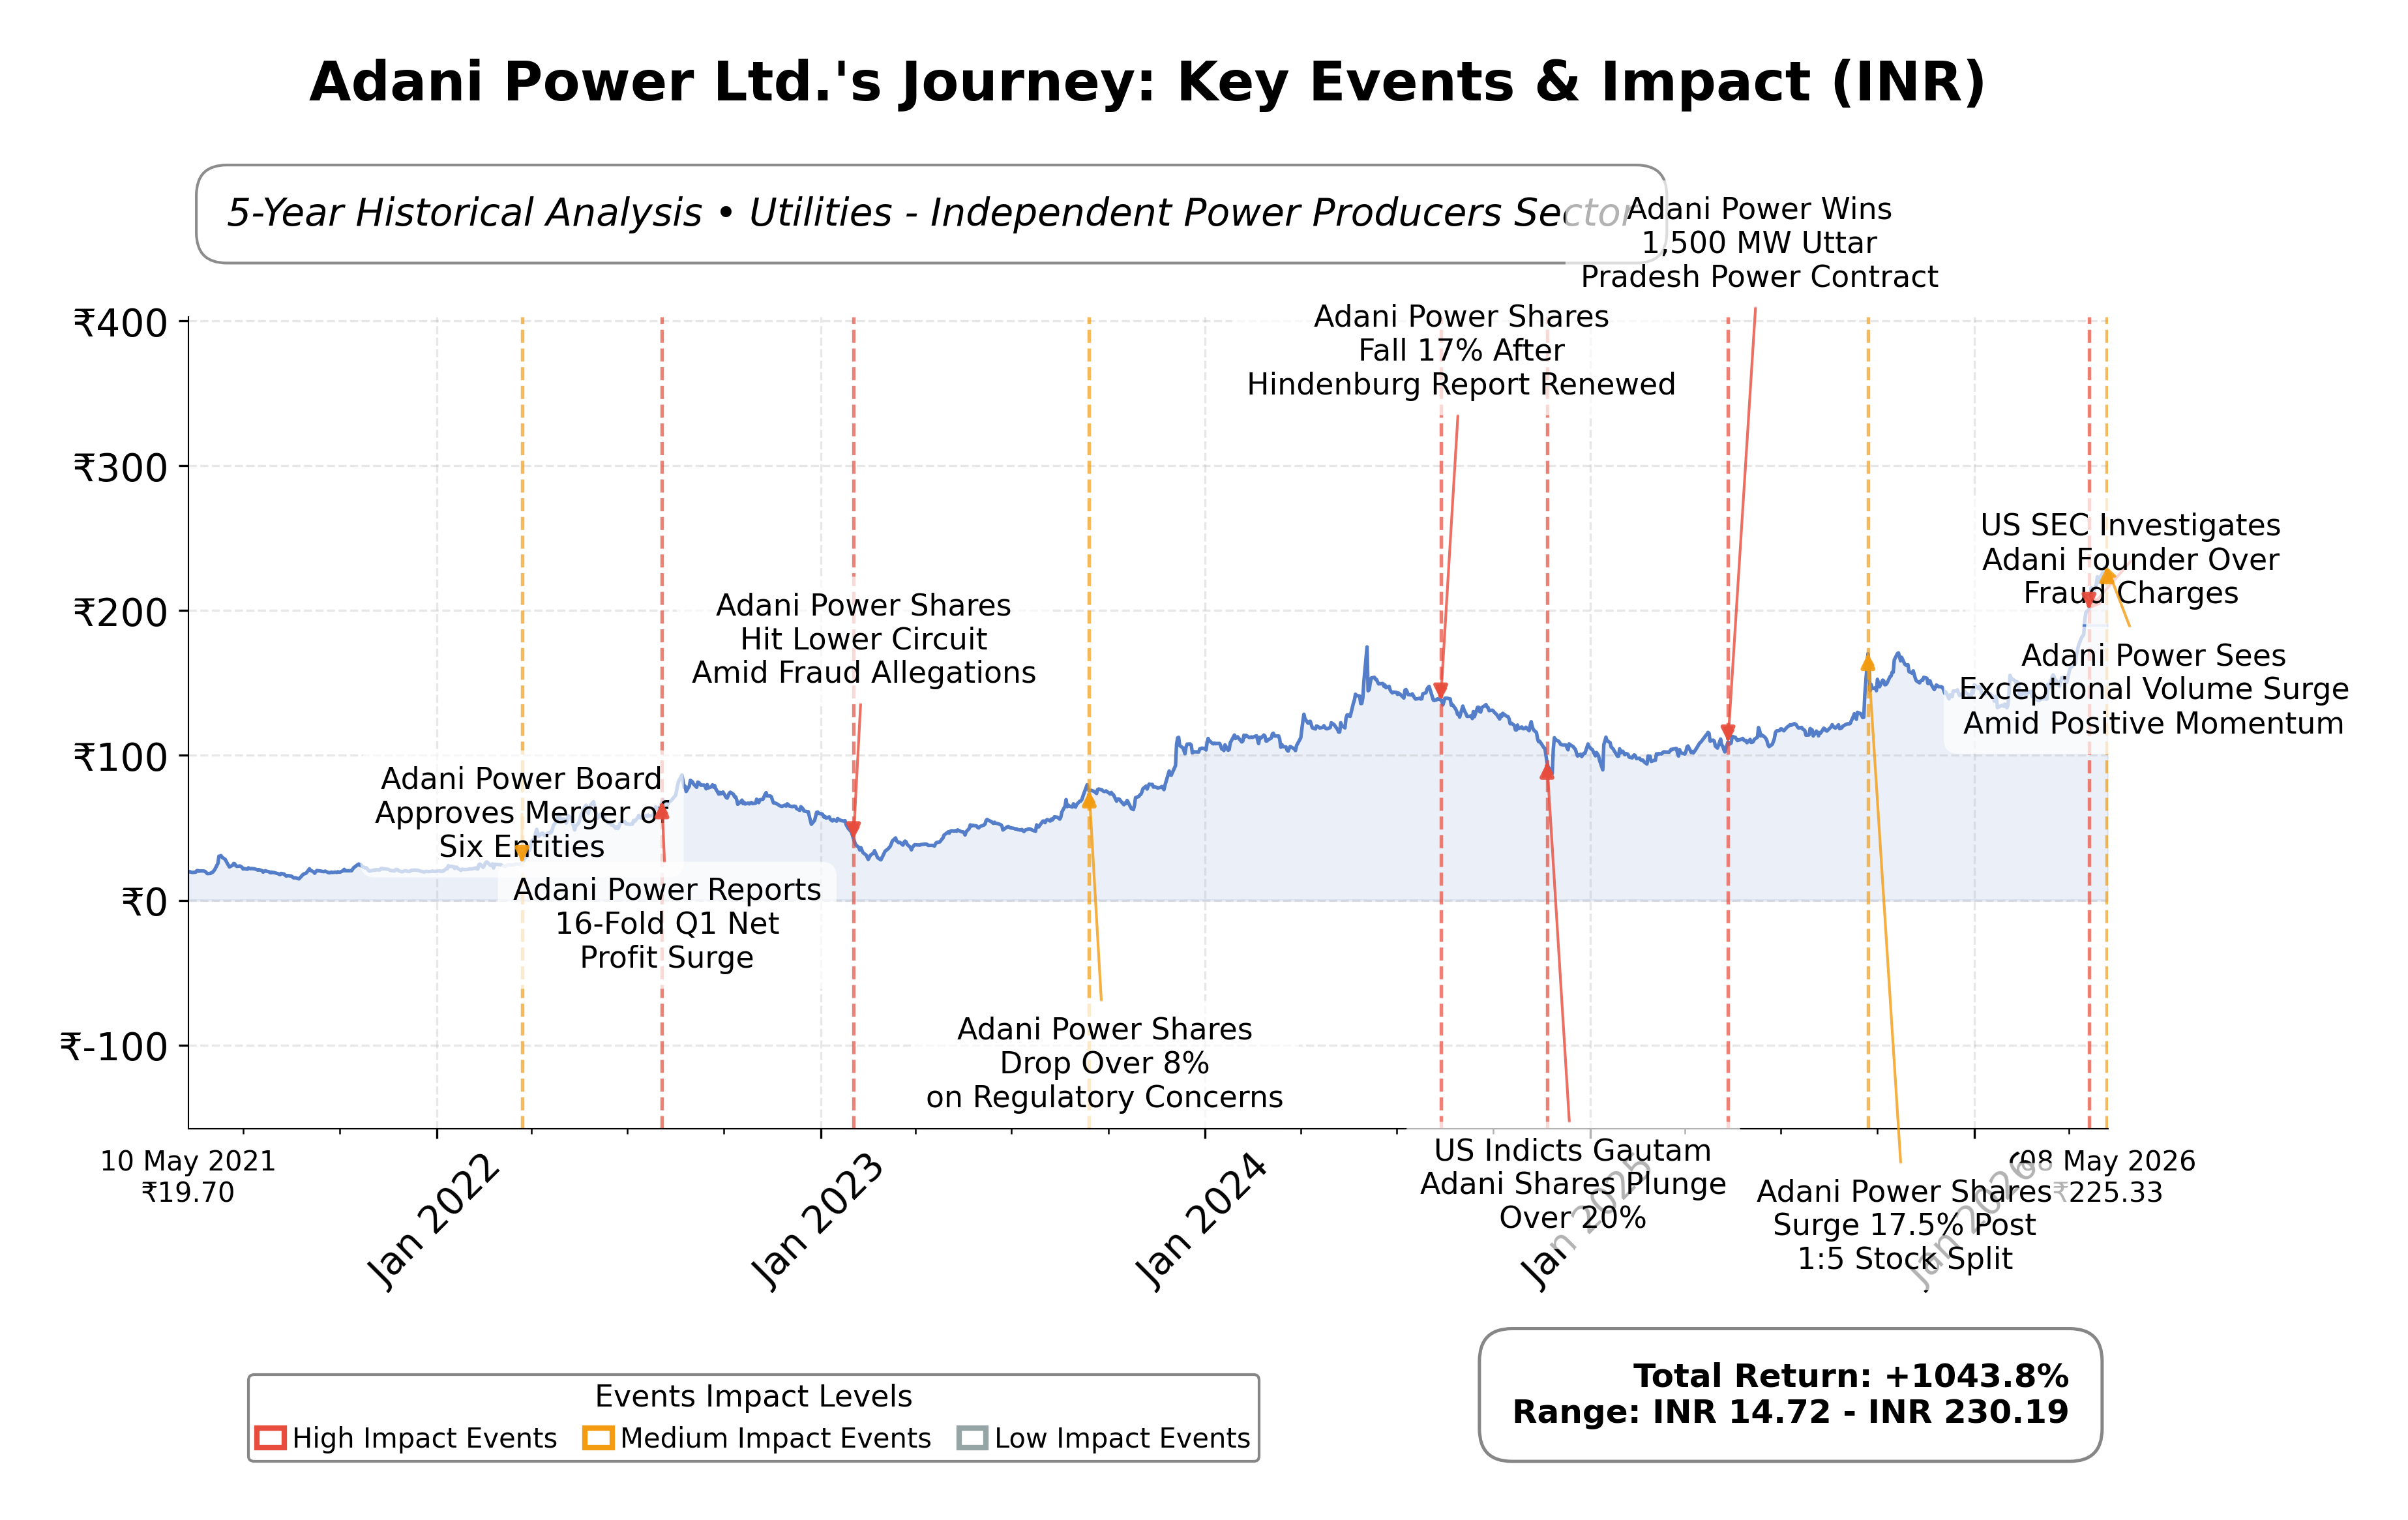
Stock Journey
Key Positives and Key Risks
Pros
- Strong profitability with a net profit margin of 23.7% and ROE of 20.9%, indicating efficient capital use and earnings generation.
- Robust operating cash flow of ₹205.1 billion TTM supports operational liquidity despite negative free cash flow due to expansion.
- Significant market capitalization of ₹4.35 trillion and premium valuation multiples reflect market confidence in growth prospects.
Cons
- High price-to-book ratio of 6.70 and EV/EBITDA of 24.38 suggest the stock is trading at a premium, which may limit upside.
- Negative free cash flow of ₹29.5 billion indicates substantial ongoing capital expenditures impacting cash availability.
- Moderate debt-to-equity ratio of 82.3% poses financial leverage risks that could affect flexibility amid sector volatility.
Disclosure: This information is for general awareness and does not constitute investment advice
Report Summary
Adani Power Ltd. is a leading Indian energy producer primarily engaged in electricity generation through thermal and solar power plants. Operating under the Utilities sector and listed on the NSE, the company is a significant part of the Adani Group conglomerate. Its operations span various regions in India, contributing to the country’s power supply infrastructure and supporting industrial and residential demand. The company’s strategic focus on both conventional and renewable energy aligns with national energy goals and positions it as a key player in the independent power producers industry.
Financially, Adani Power reported trailing twelve months (TTM) revenue of approximately ₹542.4 billion with a gross margin of 42.6%, operating margin of 25.2%, and a net profit margin of 23.7%. The company’s return on equity (ROE) stands at 20.9%, return on assets (ROA) at 7.5%, and return on invested capital (ROIC) is robust, reflecting efficient capital utilization and profitability. Despite a slight decline in quarterly revenue growth (-0.1%), the company demonstrated strong earnings growth year-over-year with a 52.3% increase in quarterly earnings, indicating resilience in profitability.
Valuation metrics show a trailing price-to-earnings (P/E) ratio of 33.99 and a forward P/E of 26.71, with a price-to-book (P/B) ratio of 6.70 and an enterprise value to EBITDA (EV/EBITDA) multiple of 24.38. The market capitalization is approximately ₹4.35 trillion. The stock’s current price of ₹225.25 is closer to its 52-week high of ₹234.40, representing an upside potential of about 4.1% from the current price to the high. These valuation multiples suggest the stock is priced at a premium relative to earnings and book value, consistent with its market leadership and growth prospects.
Adani Power’s strengths include strong cash flow generation with operating cash flow of ₹205.1 billion TTM, a current ratio of 1.41 indicating adequate liquidity, and a manageable debt-to-equity ratio of 82.3%. The company has recently expanded capacity through acquisitions and long-term power purchase agreements totaling 11.7 GW, supporting future revenue visibility. Key risks involve regulatory challenges in the power sector, competition from other energy producers, and exposure to commodity price fluctuations. Recent strategic moves include raising ₹7,500 crore through AA-rated non-convertible debentures for capacity expansion and securing new power purchase agreements, reflecting proactive growth initiatives.
Technically, the stock is trading above its 50-day (₹174.0) and 200-day (₹149.9) moving averages, indicating a positive trend. Momentum indicators such as RSI and MACD suggest moderate strength, while multi-timeframe analysis confirms an overall upward bias. Recent news highlights strong institutional interest and positive market sentiment driven by the company’s green energy investments and AI-related data center projects. The data suggests a market environment that may favor continued accumulation, though investors are advised to monitor valuation levels and sector dynamics closely.
Company and Industry Overview
Company Basics
Price Performance
Company Size
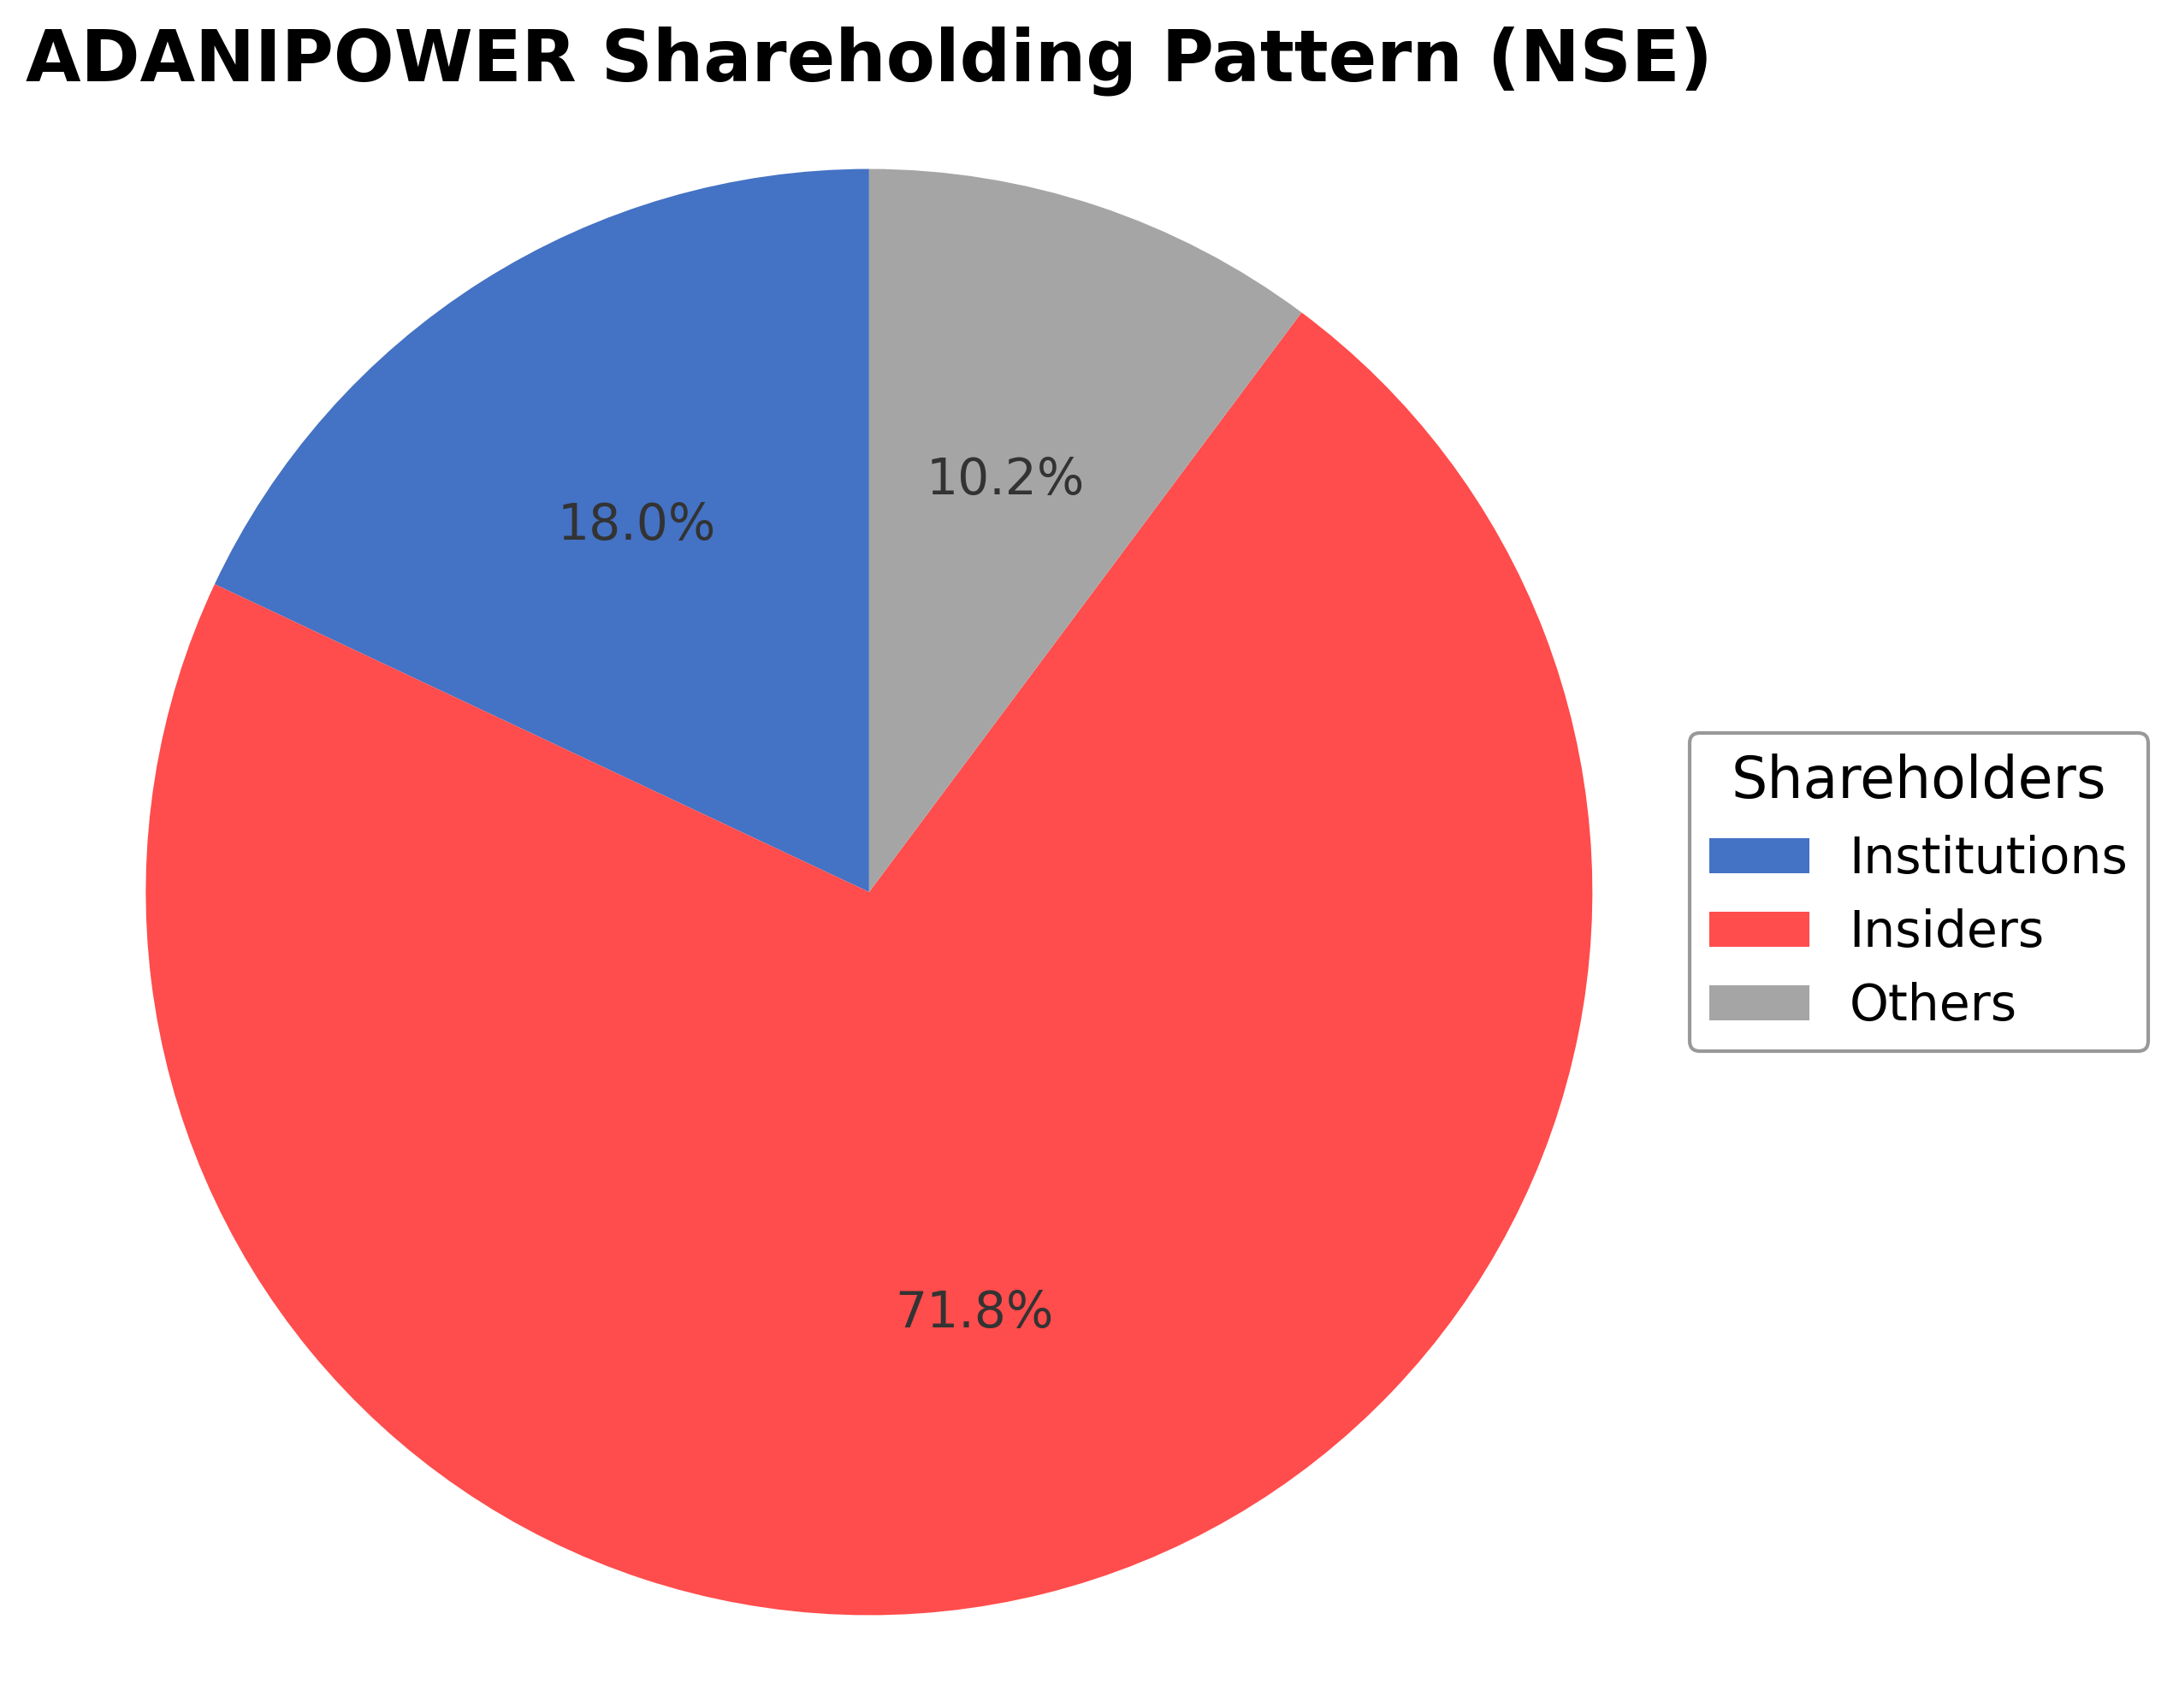
Shareholding Pattern
Sector and Industry Analysis
The Indian power sector is one of the largest and fastest-growing markets globally, driven by rising electricity demand from industrial, commercial, and residential consumers. With an installed capacity exceeding 400 GW, thermal power remains a dominant source, accounting for around 70% of electricity generation. Key players include state-owned utilities and large private firms like Adani Power, NTPC, and Tata Power, which compete across thermal, renewable, and hybrid power generation segments.
Industry trends reveal a gradual shift towards renewable energy sources, spurred by government targets and declining costs of solar and wind power. Despite this, thermal power companies maintain a significant market share due to established infrastructure and fuel linkages. Barriers to entry are high, given the capital-intensive nature of power generation, regulatory approvals, and fuel supply arrangements. Competitive dynamics favor companies with diversified portfolios, operational efficiencies, and strategic acquisitions to expand capacity and market reach.
The regulatory environment is evolving, with increasing emphasis on environmental standards, renewable energy mandates, and tariff reforms. Policies such as stricter emissions norms and incentives for clean energy impact coal-dependent generators by raising compliance costs and influencing tariff structures. Power producers must navigate tariff regulations, fuel supply agreements, and government-led capacity expansion plans, which collectively shape investment decisions and operational strategies in the sector.
Note: Analysis synthesized from industry research, market reports, and regulatory filings. Information is subject to change based on market conditions.
Financial Ratios Dashboard
Illustrative Scenario Analysis
DCF Assumptions:
Method: Two-Stage EPS-Priority Model
Financials
Peer Analysis
| Company Name | Market Cap | P/E Ratio | P/B Ratio | EV/EBITDA | Price to CFO |
|---|---|---|---|---|---|
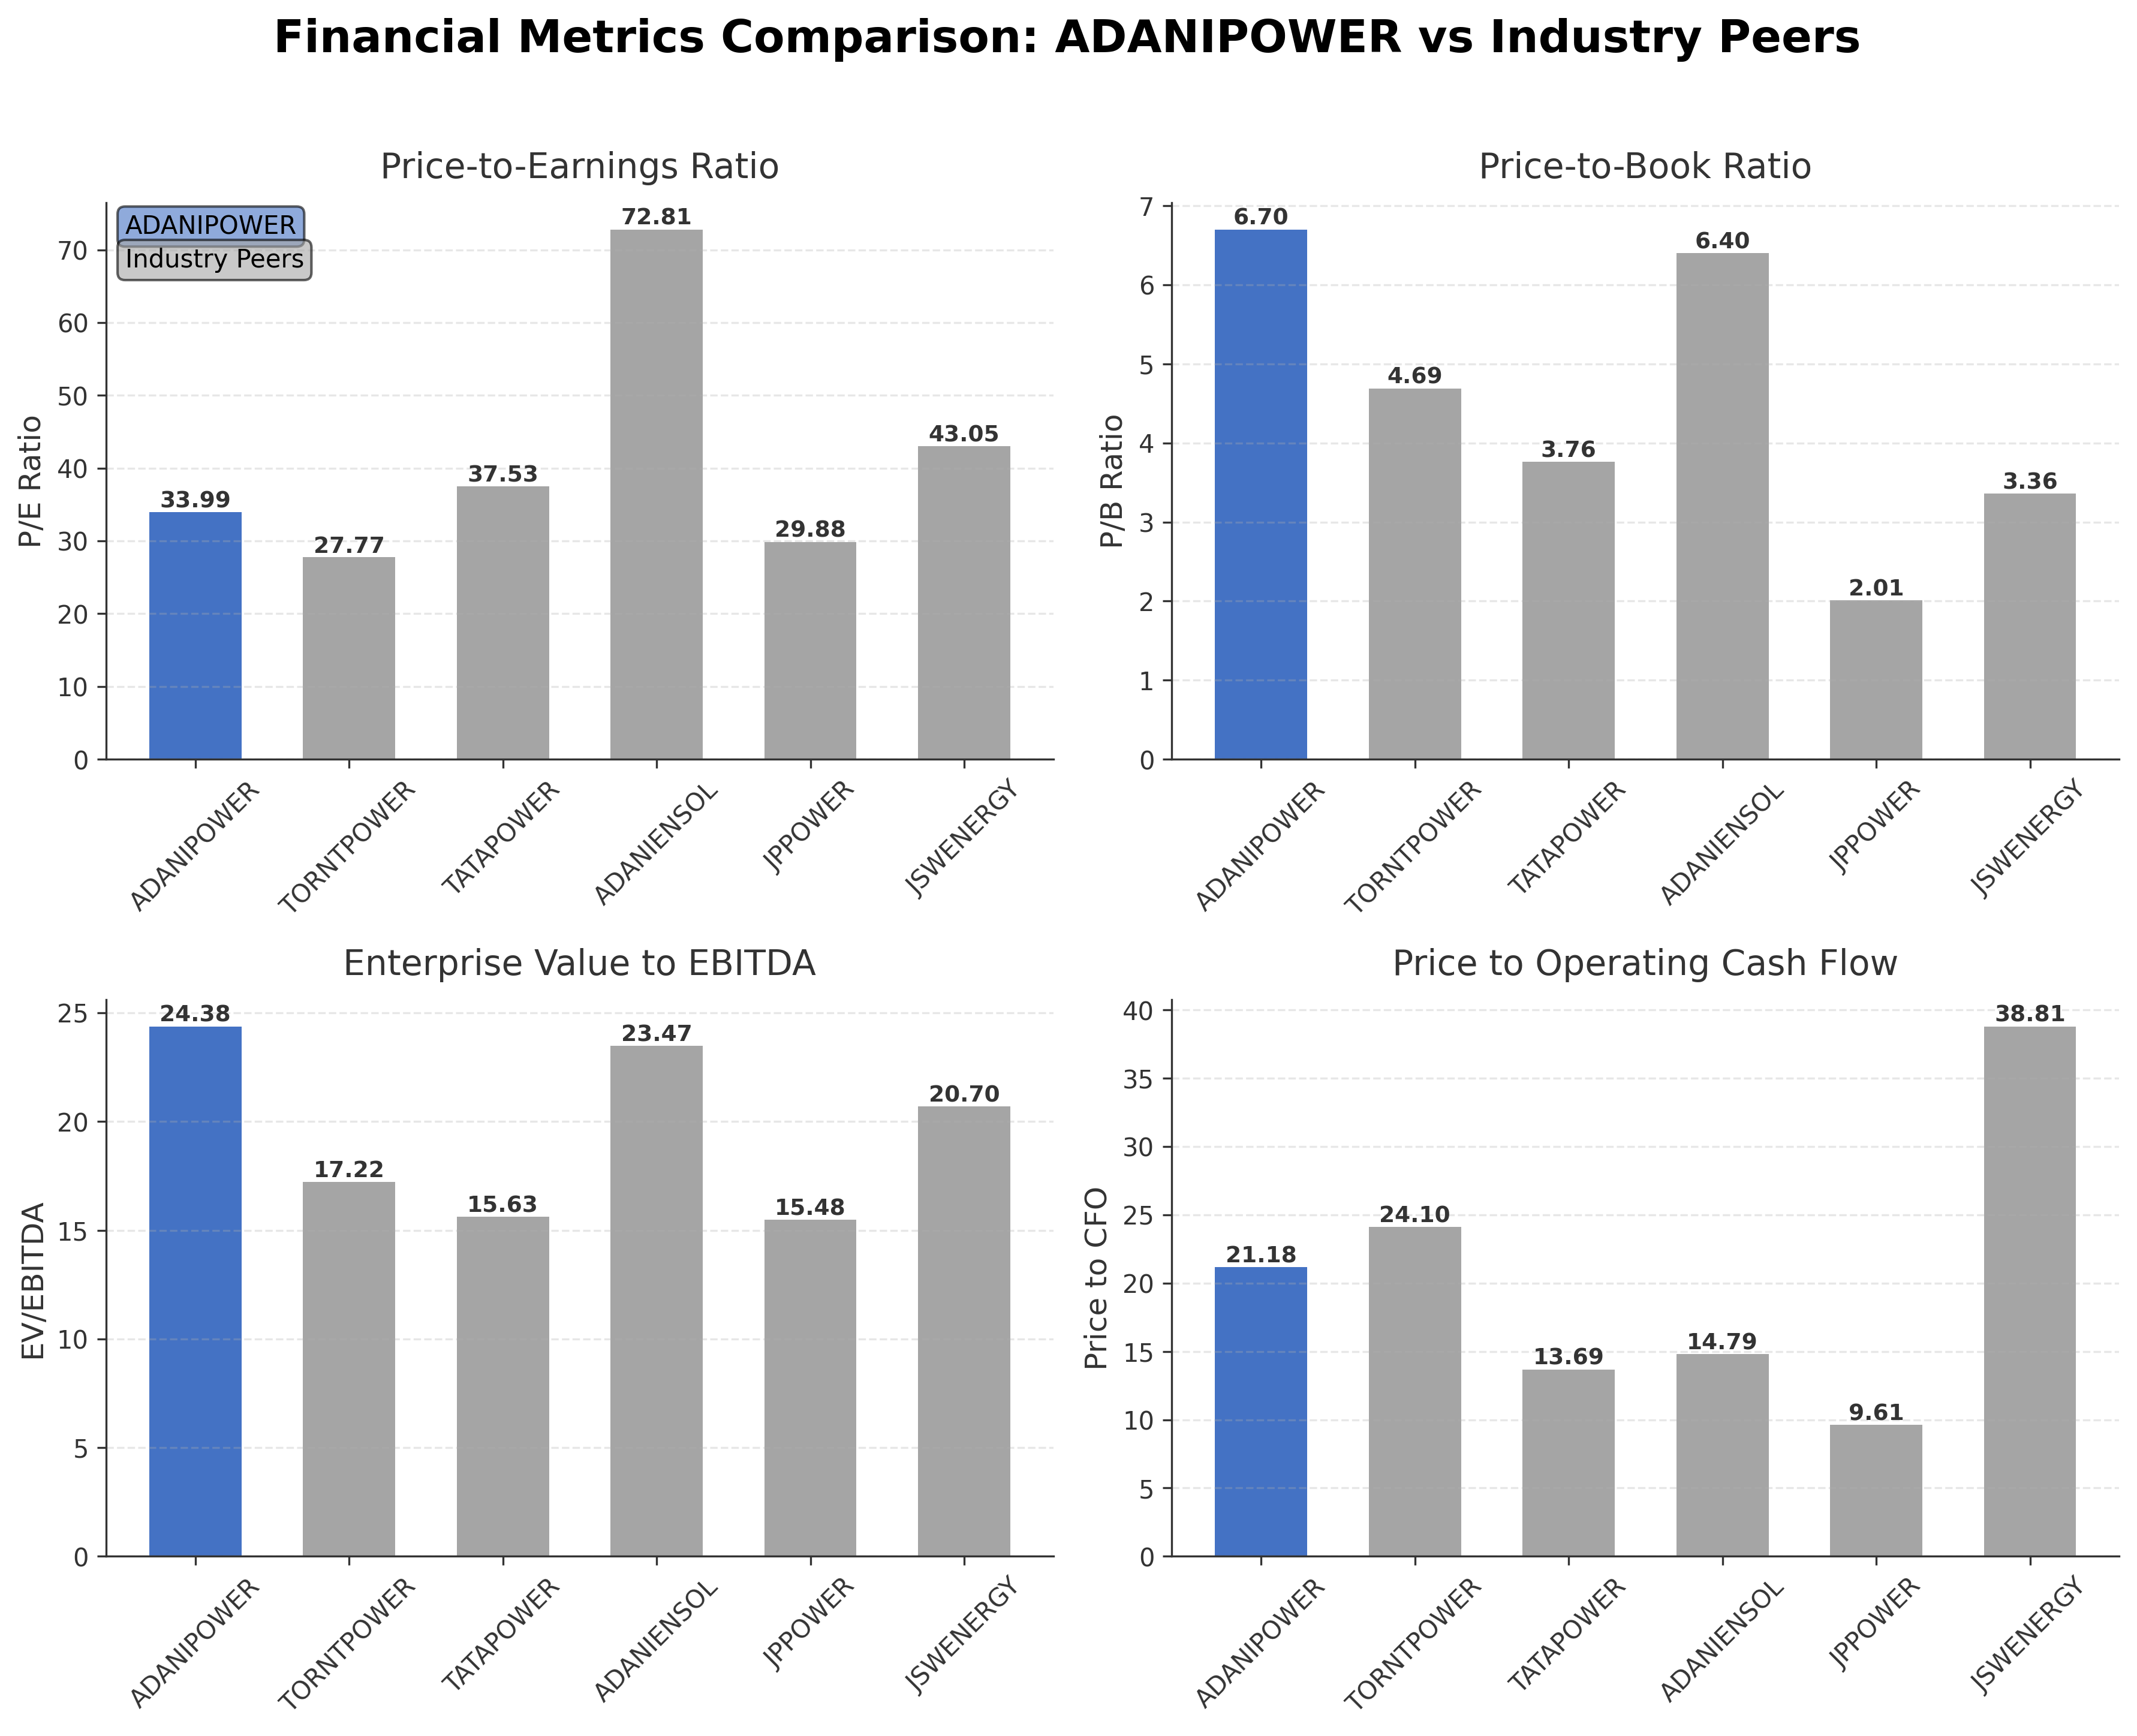
| Adani Power Ltd. | ₹4.35T | 33.99 | 6.70 | 24.38 | 21.18 |
| Torrent Power Ltd. | ₹0.87T | 27.77 | 4.69 | 17.22 | 24.10 |
| Tata Power Company Limited | ₹1.42T | 37.53 | 3.76 | 15.63 | 13.69 |
| Adani Energy Solutions Ltd. | ₹1.63T | 72.81 | 6.40 | 23.47 | 14.79 |
| Jaiprakash Power Ventures Ltd. | ₹0.14T | 29.88 | 2.01 | 15.48 | 9.61 |
| JSW Energy Ltd. | ₹0.99T | 43.05 | 3.36 | 20.70 | 38.81 |
Comparison Analysis: Adani Power Ltd. stands out among its Indian independent power producer peers with the largest market capitalization of ₹4.35 trillion and a relatively high return on equity of 21%. Its valuation multiples, including a P/E of 33.99 and EV/EBITDA of 24.38, are higher than most peers, reflecting a premium pricing possibly due to its scale and growth prospects. While Torrent Power and Tata Power exhibit lower P/E and EV/EBITDA ratios, they also report lower ROE, indicating comparatively less profitability. Adani Energy Solutions shows a notably high P/E of 72.81, signaling growth expectations but also higher valuation risk. Overall, Adani Power’s financial metrics suggest strong profitability but at a premium relative to regional competitors.
Financial Metrics Comparison with Peers
Financial Statements
Comprehensive financial data including income, balance sheet, and cash flow metrics
Income Statement
| fiscal_date | 2026-03-31 | 2025-03-31 | 2024-03-31 | 2023-03-31 | 2022-03-31 |
|---|---|---|---|---|---|
| Sales | 542.41B | 562.03B | 502.84B | 387.17B | 276.55B |
| Cost Of Goods | 299.35B | 310.89B | 302.93B | 271.89B | 168.23B |
| Gross Profit | 243.05B | 251.14B | 199.91B | 115.29B | 108.32B |
| Operating Expense Other Operating Expenses | 36.44B | 30.24B | 8.48B | 5.26B | 2.82B |
| Operating Income | 152.42B | 169.97B | 147.22B | 72.41B | 71.72B |
| Non Operating Interest Expense | 33.67B | 33.40B | 30.79B | 30.40B | 38.72B |
| Pretax Income | 155.00B | 163.60B | 207.92B | 76.75B | 65.77B |
| Income Tax | 25.28B | 36.10B | -372.80M | -30.52B | 16.66B |
| Net Income | 129.71B | 127.50B | 208.29B | 107.27B | 49.12B |
| Eps Basic | 6.62 | 6.46 | 51.62 | 24.57 | 9.63 |
| Eps Diluted | 6.62 | 6.46 | 51.62 | 24.57 | 9.63 |
| Basic Shares Outstanding | 19.39B | 20.03B | 3.86B | 3.86B | 3.86B |
| Diluted Shares Outstanding | 19.39B | 20.03B | 3.86B | 3.86B | 3.86B |
| Ebit | 188.66B | 196.99B | 238.71B | 107.15B | 104.49B |
| Ebitda | 234.31B | 240.08B | 278.18B | 139.37B | 136.68B |
| Net Income Continuous Operations | 155.00B | 163.60B | 207.92B | 76.75B | 65.77B |
| Minority Interests | -1.37B | 1.89B | N/A | N/A | 0.00 |
| Preferred Stock Dividends | 0.00 | 0.00 | 9.19B | 12.52B | 11.98B |
| Operating Expense Selling General And Administrative | N/A | 3.74B | 3.15B | 2.58B | 1.64B |
| Non Operating Interest Income | N/A | 14.44B | 89.21B | 36.07B | 35.58B |
Source: Financial statements and regulatory filings
Balance Sheet
| fiscal_date | 2026-03-31 | 2025-03-31 | 2024-03-31 | 2023-03-31 | 2022-03-31 |
|---|---|---|---|---|---|
| Cash And Cash Equivalents | 9.28B | 3.20B | 11.36B | 3.49B | 7.82B |
| Accounts Receivable | 117.91B | 130.22B | 116.77B | 115.29B | 95.61B |
| Total Assets | 1422.80B | 1129.18B | 923.25B | 858.21B | 819.81B |
| Total Liabilities | 758.78B | 552.44B | 491.80B | 559.46B | 632.78B |
| Long Term Debt | 438.79B | 286.02B | 265.54B | 336.22B | 378.11B |
| Shareholders Equity | 664.02B | 576.74B | 431.45B | 298.76B | 187.03B |
Source: Financial statements and regulatory filings
Cash Flow Statement
| fiscal_date | 2026-03-31 | 2025-03-31 | 2024-03-31 | 2023-03-31 | 2022-03-31 |
|---|---|---|---|---|---|
| Operating Activities Net Income | 155.00B | 163.60B | 207.92B | 76.75B | 65.77B |
| Operating Activities Other Non Cash Items | 8.98B | 13.26B | -60.17B | -6.07B | 3.29B |
| Operating Activities Accounts Receivable | 13.70B | -3.42B | -17.38B | -29.95B | 9.81B |
| Operating Activities Other Assets Liabilities | -17.11B | 7.50B | -33.27B | 20.68B | -3.08B |
| Operating Activities Operating Cash Flow | 160.57B | 180.94B | 97.09B | 61.40B | 75.79B |
| Investing Activities Capital Expenditures | 194.00M | 151.60M | 5.60M | 8.30M | 12.40M |
| Investing Activities Net Acquisitions | -39.89B | -63.96B | 5.34B | 2.62B | -10.00M |
| Investing Activities Purchase Of Investments | -3.84B | -5.67B | N/A | -4.58B | -1.62B |
| Investing Activities Sale Of Investments | 1.37B | 0.00 | 4.06B | 0.00 | 815.40M |
| Investing Activities Other Investing Activity | -2.34B | 4.52B | -45.45B | 1.51B | -2.15B |
| Investing Activities Investing Cash Flow | -44.50B | -64.95B | -36.04B | -440.60M | -2.95B |
| Financing Activities Long Term Debt Issuance | 205.00B | 37.13B | 226.72B | 212.05B | 133.32B |
| Financing Activities Long Term Debt Payments | -52.40B | -28.52B | -305.98B | -269.48B | -178.96B |
| Financing Activities Short Term Debt Issuance | -1.59B | 27.43B | 18.97B | -12.00B | -18.32B |
| Financing Activities Common Stock Issuance | 0.00 | 2.50B | N/A | N/A | N/A |
| Financing Activities Common Stock Repurchase | 0.00 | -5.00B | N/A | N/A | N/A |
| Financing Activities Other Financing Charges | -44.42B | -50.98B | -74.03B | -946.80M | 101.70M |
| Financing Activities Financing Cash Flow | 106.58B | -17.45B | -134.33B | -70.38B | -63.85B |
| End Cash Position | 9.28B | 3.20B | 11.36B | 3.49B | 7.82B |
| Free Cash Flow | -28.36B | 99.42B | 115.68B | 51.87B | 67.98B |
Source: Financial statements and regulatory filings
Technical Analysis
Key Insights
- Adani Power’s current trend is upward, with the stock price maintaining above key moving averages and showing consistent higher highs and higher lows in recent sessions.
- Key support levels are observed near ₹174 (50-day moving average) and ₹150 (200-day moving average), while resistance is close to the 52-week high of ₹234.
- The stock is trading above its 10-day, 50-day, and 200-day moving averages, indicating bullish momentum across short, medium, and long-term timeframes.
- Momentum indicators show RSI in the mid-60s suggesting moderate strength without overbought conditions; MACD is positive with a recent bullish crossover; Stochastic oscillator confirms upward momentum.
- Daily and weekly charts confirm a sustained uptrend, while monthly charts show a longer-term base formation with potential for further appreciation.
- Current technical setup supports scenarios of continued price consolidation near highs with possible breakouts if volume sustains, while key support levels provide downside protection.
Trending News
1. Headline: How AI is powering Adani stocks higher through its green data centre mega bet - BusinessToday
Summary: Shares of Adani Power Ltd, Adani Green Energy Ltd and Adani Energy Solutions Ltd (formerly known as Adani Transmission) have surged nearly 50 per cent over the past three months.
Sentiment: positive
2. Headline: These Adani Group stocks rally up to 60% in a month Should you buy any? - BusinessToday
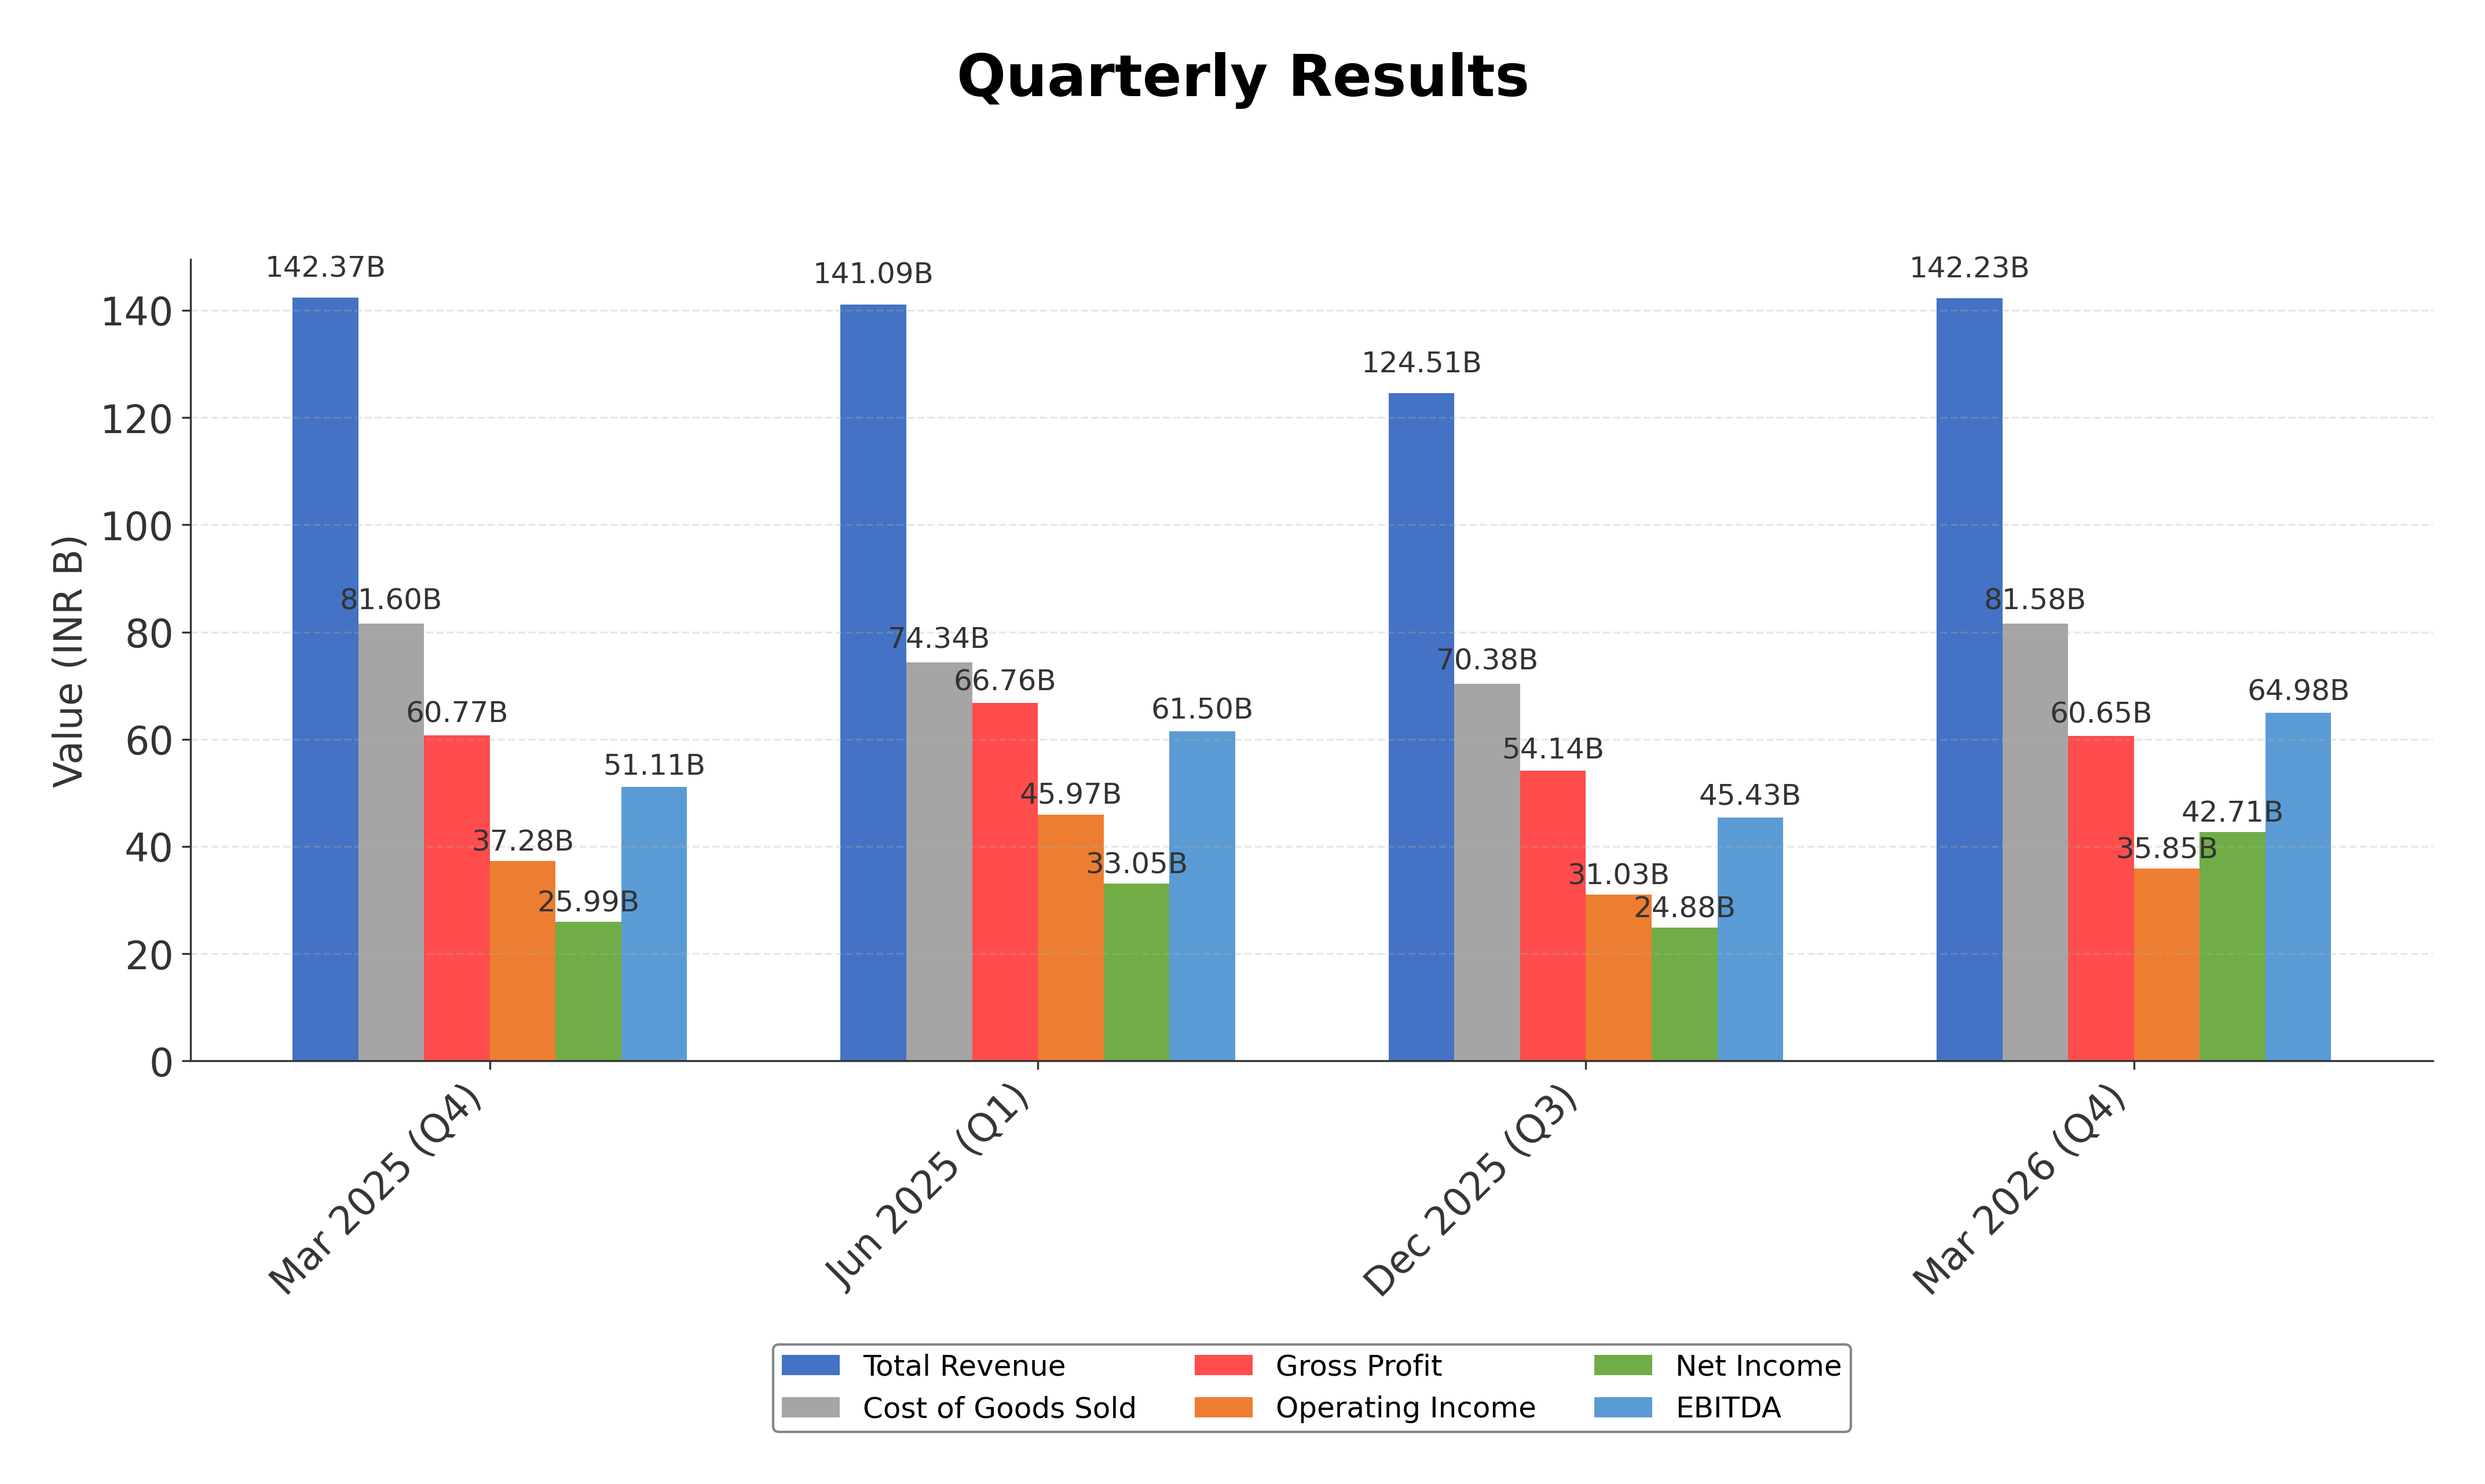
Summary: Motilal Oswal Financial Services remains positive on the stock and has given it a 'buy' with a target price of Rs 1,900. Adani Power Ltd, the most valued Adani Group company, reported a 64.3 per cent YoY rise in the net profit at Rs 4,271 crore, but revenue remained largely flat at Rs 14,223.09 ...
Sentiment: positive
3. Headline: AI trade turns Adani’s energy stocks into India proxy play - The Economic Times
Summary: That dynamic is boosting the appeal of proxy plays like Adani, which has pledged to be a world leader in green data storage and has resources that form the backbone of AI. ... India’s local institutional investors, including mutual funds, banks and insurance companies, increased stakes in the group’s power-related stocks over the January-March quarter, according to BSE Ltd...
Sentiment: positive
4. Headline: Adani Energy Stocks Surge on $100 Billion AI Data Center Investment Plan - Bloomberg
Summary: Adani Group’s push into green-powered data centers is driving gains in its energy units, which have become one of the few artificial intelligence trades in India.
Sentiment: positive
Summary: Adani Power Share Price: Find the latest news on Adani Power Stock Price. Get all the information on Adani Power with historic price charts for NSE / BSE. Experts & Broker view also get the Adani Power Ltd. buy/sell tips detailed news, announcements, Forecasts, Analysts, Valuation, Earning ...
Sentiment: neutral
Recent Updates
News Summary
As of 2026-05-08. Adani Power Ltd reported a 64.3% year-over-year increase in net profit to ₹4,271 crore, despite flat revenue, reflecting strong operational efficiency. The company secured ₹7,500 crore through AA-rated non-convertible debentures to fund capacity expansion and added a new 3.2 GW power purchase agreement, raising total capacity tie-ups to 11.7 GW. The 600 MW Butibori plant became fully operational within four months of acquisition, contributing to stable revenue and robust EBITDA of ₹4,636 crore in Q3 FY26. Power demand in India showed marginal decline due to weather factors, but Adani Power maintained consolidated power sale volumes and profitability. Institutional investor interest remains steady, with positive brokerages outlook on the group’s infrastructure-led growth strategy.
News Sentiment
The overall sentiment from recent updates is predominantly positive, driven by strong profit growth, strategic capacity expansions, and successful capital raising efforts. Positive operational results amid a challenging demand environment highlight resilience. Institutional accumulation and favorable brokerage views further support a constructive tone. However, flat revenue growth and some moderation in power demand introduce a neutral element, balancing the outlook. The combined news suggests cautious optimism grounded in solid fundamentals and proactive management actions.
Source List
- https://www.alphaspread.com/security/nse/adanipower/investor-relations
Analytical Overview
Analysis Summary
Adani Power’s valuation metrics, including a trailing P/E of 33.99 and forward P/E of 26.71, are elevated relative to the industry average P/E of approximately 34, indicating valuation in line with sector norms but at the higher end. The PEG ratio below 1 (0.95) suggests earnings growth is reasonably priced. Revenue growth is marginally negative (-0.1%), but cash flow trends are strong with operating cash flow of ₹205.1 billion TTM, though free cash flow is negative, reflecting ongoing capital expenditures. The company’s financial health shows a debt-to-equity ratio of 82.3%, which is moderate for capital-intensive utilities, supported by a current ratio of 1.41 and substantial cash reserves. Sector-specific challenges include regulatory risks and fluctuating power demand, while opportunities arise from capacity expansions and green energy investments. Considering India’s regulatory environment and growing energy needs, the company is well-positioned to capitalize on infrastructure development and sustainability trends.
Overall Business and Market Assessment
Supporting Factors: Key supporting factors include robust profitability with a 23.7% net margin, strategic capacity expansions increasing contracted power to 11.7 GW, and strong institutional investor interest. Risks to monitor include regulatory changes, power market demand variability, and the impact of high leverage on financial flexibility. The appropriate investment timeframe is medium to long-term to capture benefits from capacity ramp-up and sector growth. Overall, the analysis reflects a company with solid fundamentals and growth prospects tempered by valuation and market risks.
Risk Factors: No data
SWOT Analysis
Strengths
- Strong market position as a leading independent power producer in India.
- Robust profitability with net profit margin of 23.7% and ROE of 20.9%.
- Strategic capacity expansions with 11.7 GW of contracted power purchase agreements.
- Significant cash flow generation and adequate liquidity with current ratio of 1.41.
Weaknesses
- High price-to-book ratio of 6.70 indicating premium valuation.
- Negative free cash flow reflecting ongoing capital expenditure requirements.
- Moderate debt-to-equity ratio of 82.3% which may constrain financial flexibility.
- Flat revenue growth indicating challenges in top-line expansion.
Opportunities
- Expansion into green energy and AI-powered data center infrastructure.
- Growing power demand in India supporting long-term capacity utilization.
- Increasing institutional investor interest enhancing capital access.
- Potential for operational efficiencies through technology and scale.
Threats
- Regulatory risks and policy changes in the Indian power sector.
- Competition from other independent power producers and renewable energy firms.
- Volatility in fuel prices impacting operating costs and margins.
- Macroeconomic factors affecting power demand and investment climate.
Company Description
Adani Power Ltd. is an integral energy producer, primarily focusing on the generation of electricity across India. A member of the Adani Group, one of India's eminent conglomerates, this company plays a pivotal role in catering to the country's substantial energy demands. It operates both thermal and solar power plants, thus contributing significantly to the energy mix, which is crucial for meeting industrial and household electricity needs in a rapidly developing economy. Noted for its efficient and large-scale operations, Adani Power has facilities strategically located in various parts of India, which supports grid reliability and reduces transmission losses. The company’s ventures into renewable energy align with global and national sustainable energy goals. As a key player in India's energy sector, Adani Power Ltd. aids in driving economic growth by ensuring stable power supply and is actively involved in large-scale projects that aim to enhance its capacity and infrastructure to support the nation’s growing energy requirements.