
Adani Power Ltd (ADANIPOWER)
Stock Analysis Report
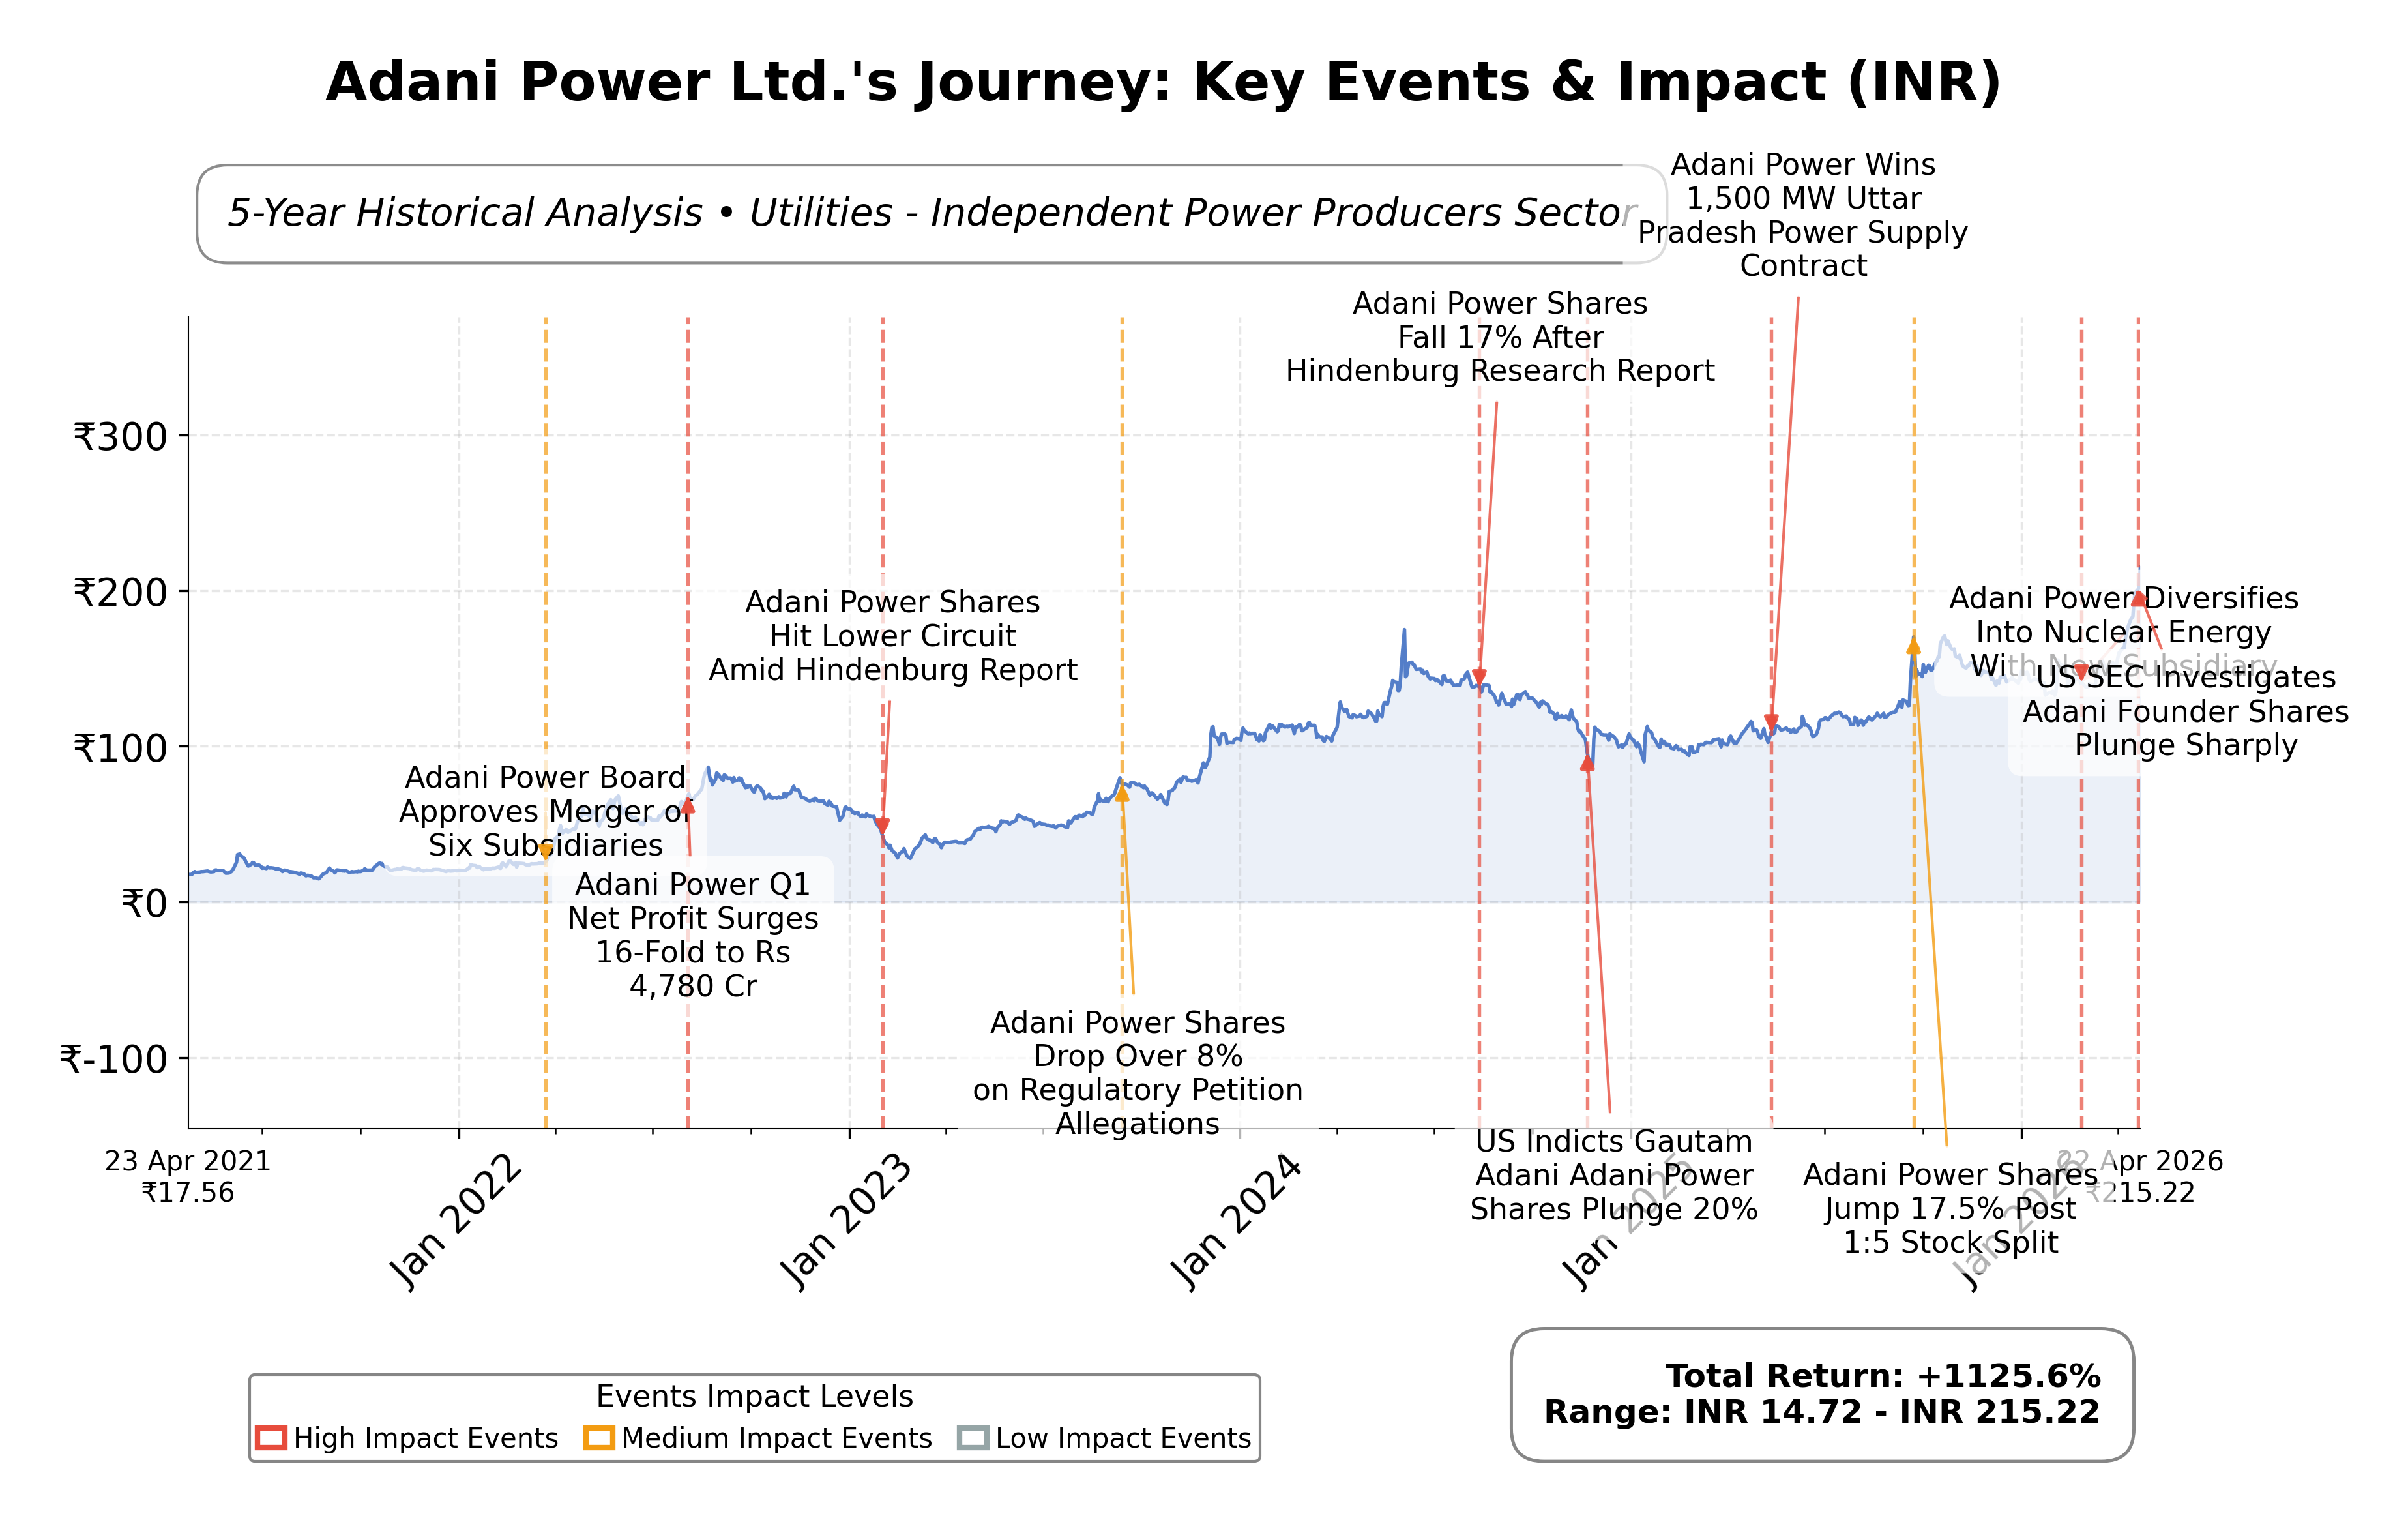
Stock Journey
Key Positives and Key Risks
Pros
- Strong return on equity of 21.61% indicating efficient use of shareholder capital.
- Robust operating cash flow of ₹180.3 billion and free cash flow of ₹124.6 billion supporting liquidity and operations.
- Market capitalization of ₹3.82 trillion reflects significant scale and investor confidence.
Cons
- High trailing P/E ratio of 33.87 and price-to-book ratio of 6.55 suggest elevated valuation.
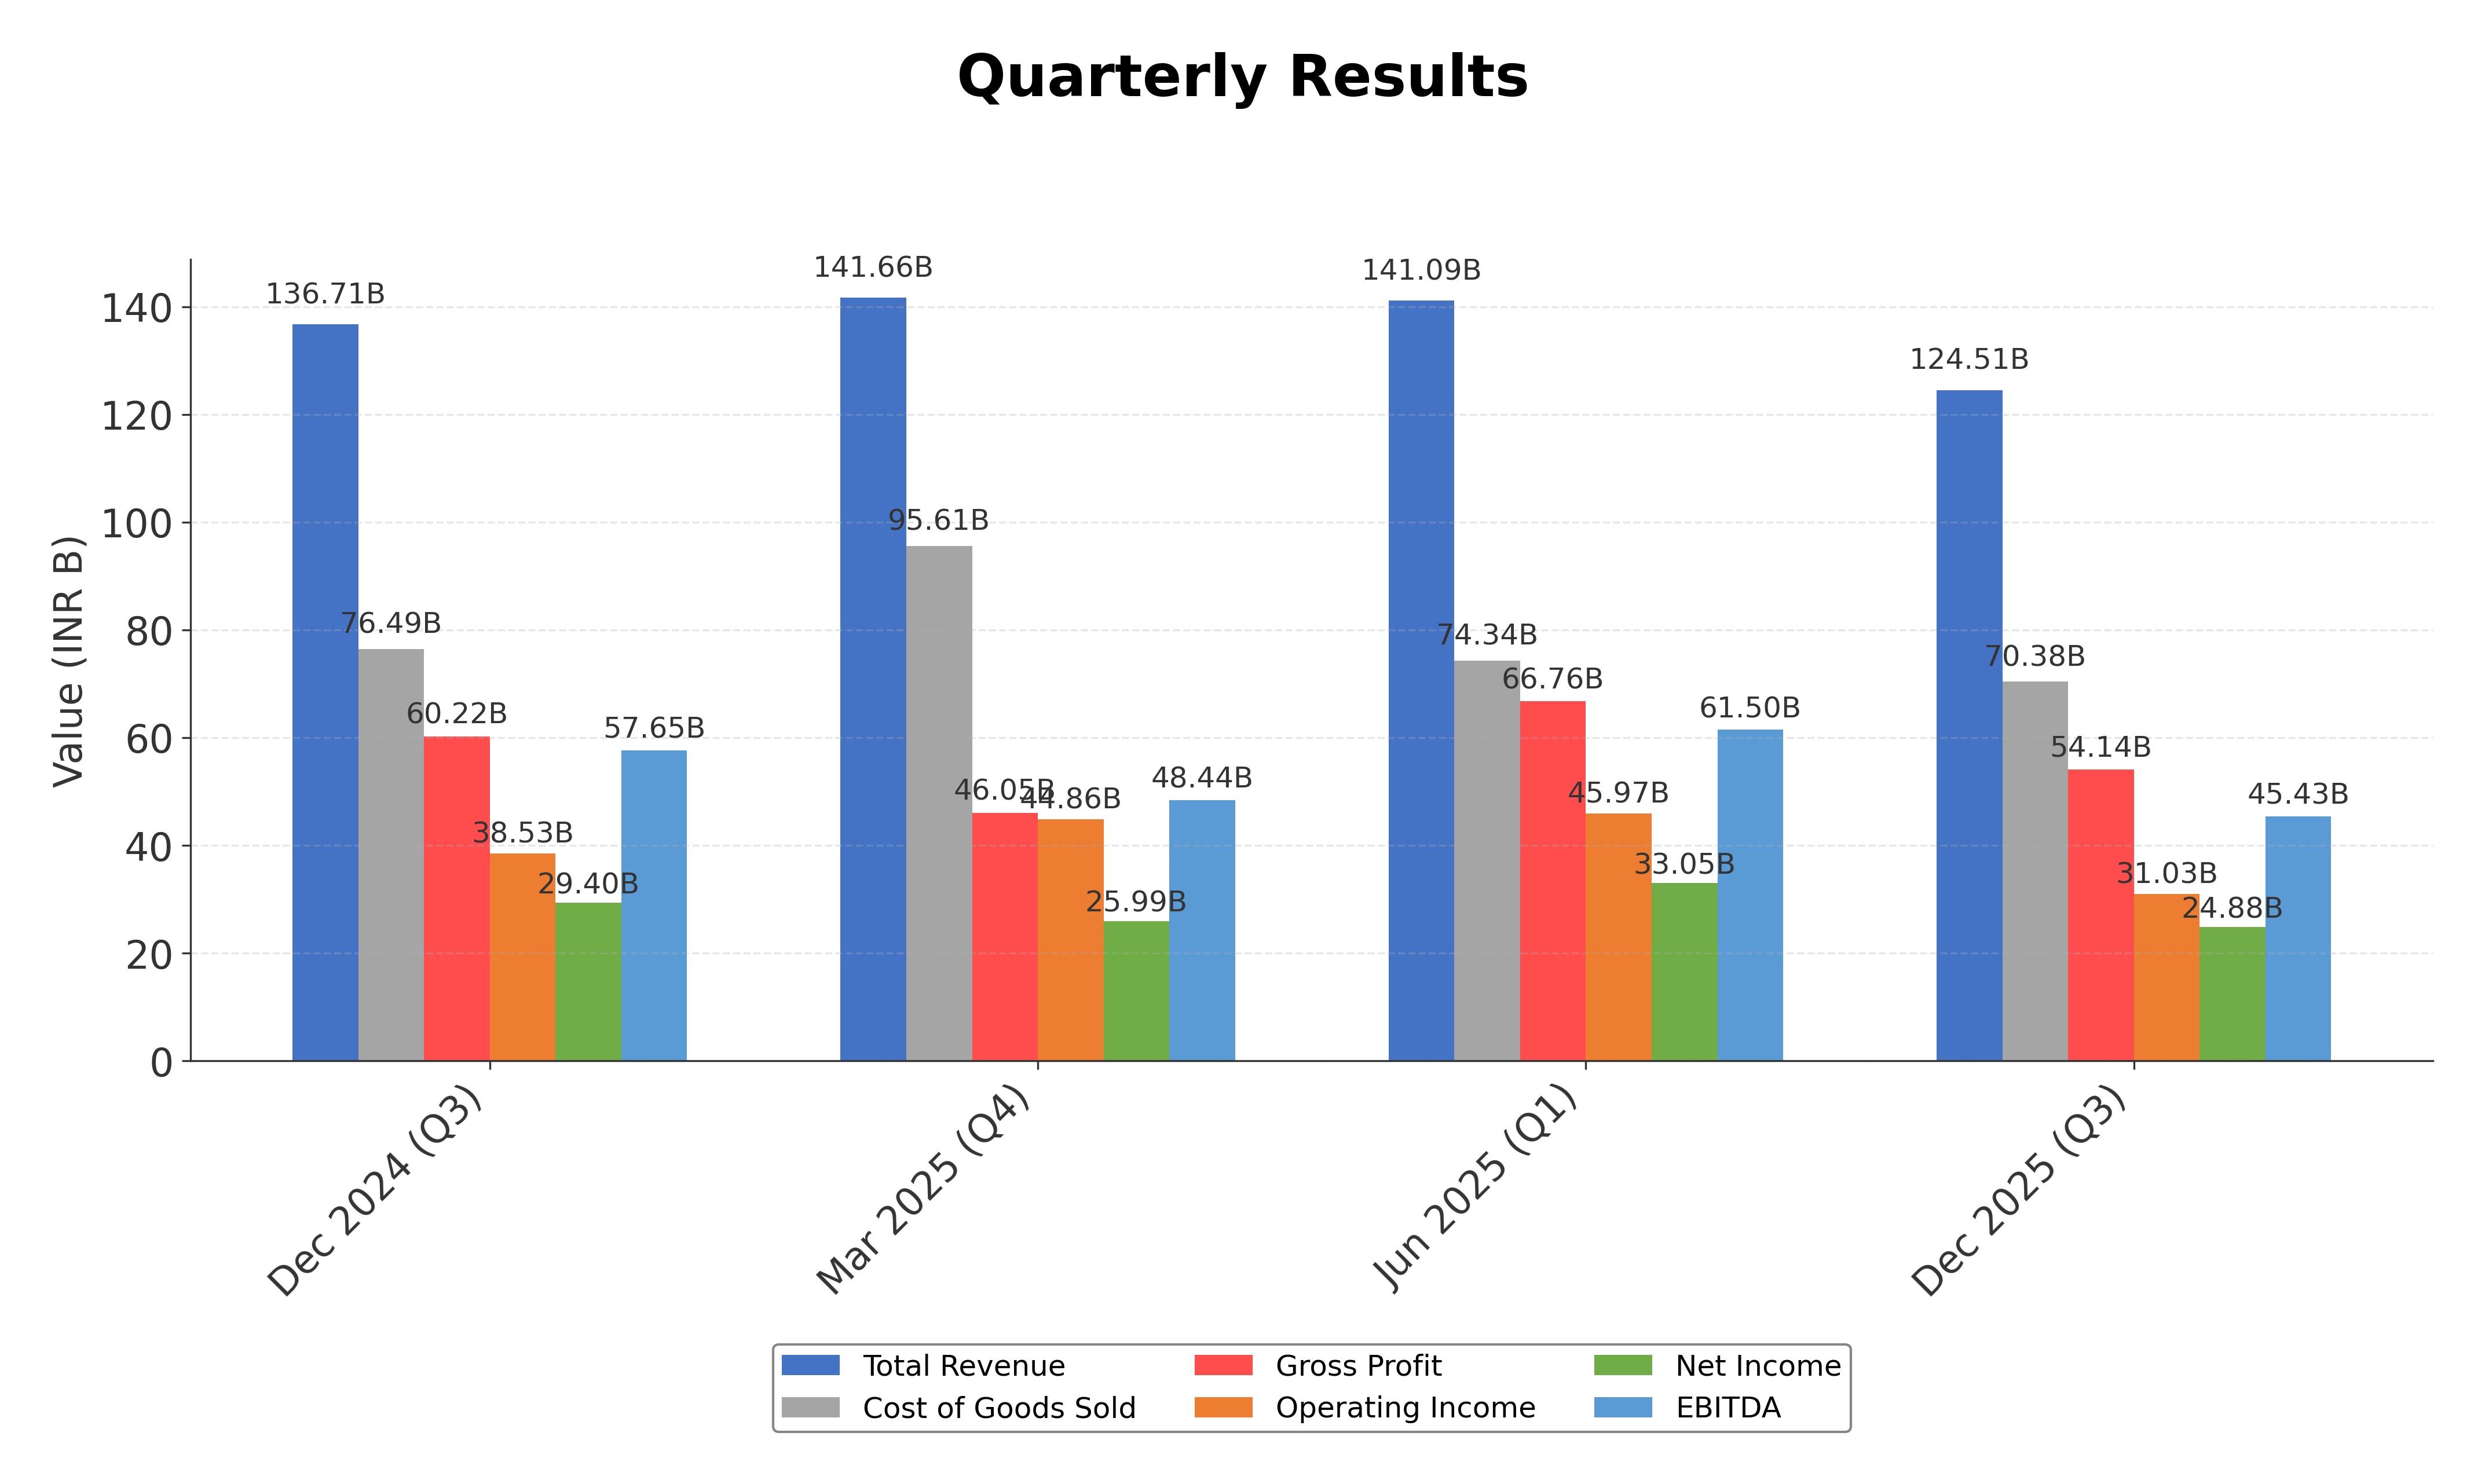
- Quarterly revenue declined by 8.9%, indicating potential near-term growth headwinds.
- Debt-to-equity ratio of 81.25% indicates moderate leverage which may pose financial risk.
Disclosure: This information is for general awareness and does not constitute investment advice
Report Summary
Adani Power Ltd. is a leading independent power producer in India, operating primarily in the utilities sector with a focus on electricity generation through thermal and solar power plants. Listed on the NSE, the company is part of the Adani Group, a major Indian conglomerate, and holds a significant position in the power generation industry. Its operations span multiple geographic locations across India, contributing to the country's energy security and supporting industrial and residential power needs. The company’s strategic emphasis on both conventional and renewable energy sources aligns with national goals for sustainable development.
Financially, Adani Power reported trailing twelve months (TTM) revenue of approximately ₹542.5 billion with a gross margin of 43.48%, operating margin of 24.92%, and a net profit margin of 21.11%, indicating solid profitability. The company’s return on equity (ROE) stands at 21.61%, and return on assets (ROA) at 11.04%, reflecting efficient use of shareholder capital and assets. Operating cash flow for the TTM period was ₹180.3 billion, with a levered free cash flow of ₹124.6 billion, demonstrating strong cash generation capabilities.
Valuation metrics show a trailing price-to-earnings (P/E) ratio of 33.87 and a forward P/E of 29.08, with a price-to-book (P/B) ratio of 6.55 and an enterprise value to EBITDA (EV/EBITDA) multiple of 21.00. The market capitalization is approximately ₹3.82 trillion, with the stock trading near ₹214.26, above its 52-week low of ₹101 and high of ₹200, indicating recent price strength. The stock’s valuation multiples are generally higher than some peers, reflecting market expectations of growth and profitability.
Adani Power’s strengths include robust cash flow generation, a manageable debt-to-equity ratio of 81.25%, and market leadership within India’s power sector. The company has recently achieved significant milestones such as surpassing a ₹4 trillion market cap and becoming the largest listed entity within the Adani Group. Key risks include regulatory changes in the energy sector, competitive pressures from other power producers, and macroeconomic factors affecting energy demand. Recent strategic developments include securing long-term power supply deals and expanding its footprint in nuclear and renewable energy segments.
Technically, the stock has exhibited strong upward momentum, reaching new all-time highs and trading above key moving averages such as the 50-day and 200-day. Momentum indicators suggest continued strength across multiple timeframes, although some overbought signals warrant cautious observation. Overall, the data suggests a market environment that may favor continued interest and accumulation, balanced by the need for vigilance regarding potential near-term consolidations.
Company and Industry Overview
Company Basics
Price Performance
Company Size
Shareholding Pattern
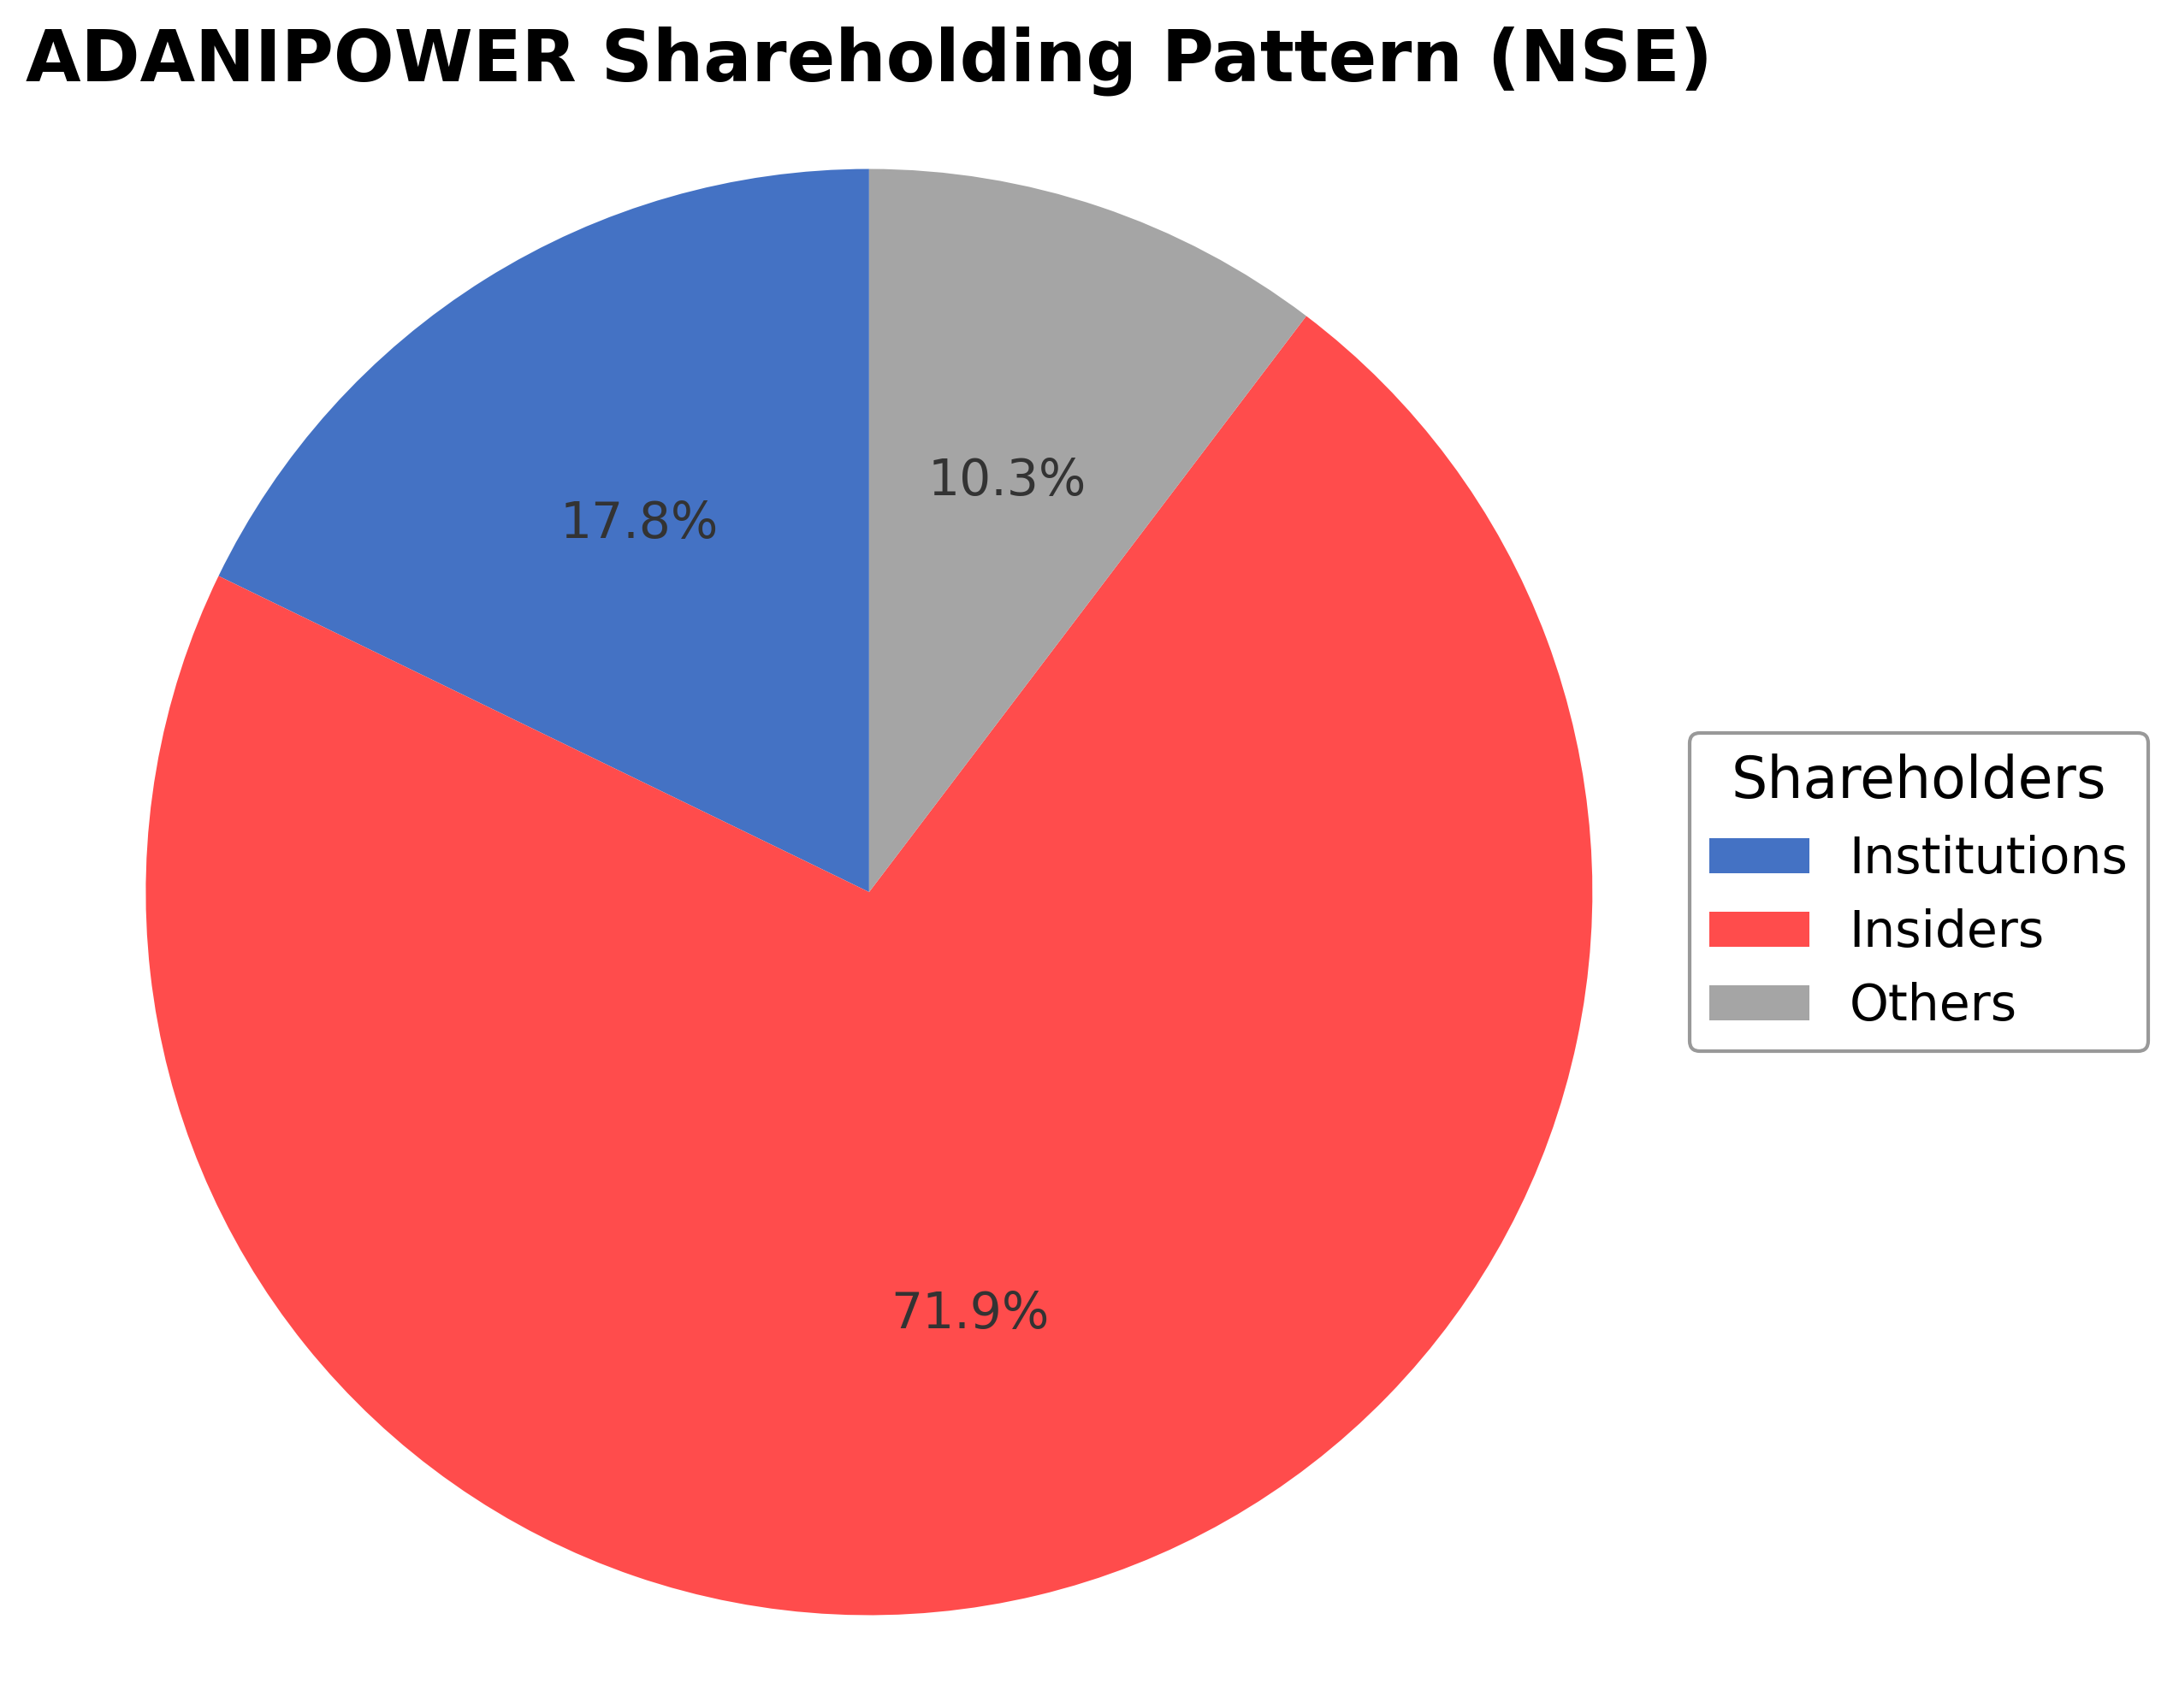
Adani Power Ltd.'s ownership is predominantly held by insiders, including executives and board members, accounting for approximately 71.87% of shares, reflecting strong promoter control. Institutional investors hold about 17.80%, representing mutual funds, pension funds, and asset managers, while public and other shareholders constitute roughly 10.33%. Over the past 12 to 24 months, promoter holdings have remained stable, while institutional investors have shown moderate accumulation, indicating sustained confidence from large financial entities. Major funds have increased positions in line with the company's growth trajectory and market performance. This shareholding pattern suggests a governance structure with concentrated promoter influence complemented by institutional oversight, which may support strategic initiatives and long-term planning within the Indian utilities sector.
Sector and Industry Analysis
The Indian power sector is one of the largest and fastest-growing in the world, driven by rising electricity demand from industrial, commercial, and residential consumers. With an installed capacity exceeding 400 GW as of 2025, thermal power remains the dominant source, accounting for around 70% of generation. Key players include state-owned utilities and large private firms such as Adani Power, Tata Power, and NTPC, which collectively contribute to the sector's expansion and modernization.
Industry dynamics are shaped by a gradual shift towards renewable energy sources, although coal-fired power plants continue to play a critical role due to their scale and reliability. Barriers to entry are high, given the capital-intensive nature of power generation and the need for long-term fuel supply agreements. Companies like Adani Power leverage operational scale, diversified fuel linkages, and strategic acquisitions to maintain competitive advantages and improve plant load factors amid evolving market conditions.
The regulatory environment is increasingly focused on environmental sustainability and tariff rationalization, with government policies promoting renewable energy integration and stricter emissions standards. Tariff fluctuations and regulatory scrutiny pose challenges to thermal power producers, impacting profitability and investment decisions. Ongoing reforms aim to balance energy security with climate commitments, influencing the strategic direction of power companies in India.
Note: Analysis synthesized from industry research, market reports, and regulatory filings. Information is subject to change based on market conditions.
Financial Ratios Dashboard
Illustrative Scenario Analysis
DCF Assumptions:
Method: Two-Stage EPS-Priority Model
Financials
Peer Analysis
| Company Name | Market Cap | P/E Ratio | P/B Ratio | EV/EBITDA | Price to CFO |
|---|---|---|---|---|---|
| Adani Power Ltd. | ₹3.82T | 33.87 | 6.55 | 21.00 | 21.16 |
| Jaiprakash Power Ventures Ltd. | ₹131.59B | 29.09 | 1.96 | 15.16 | 9.35 |
| JSW Energy Ltd. | ₹944.88B | 41.32 | 3.22 | 20.19 | 37.22 |
| Torrent Power Ltd. | ₹788.61B | 24.88 | 4.19 | 15.69 | 21.73 |
| Tata Power Company Limited | ₹1.37T | 36.05 | 3.61 | 15.23 | 13.17 |
| Adani Energy Solutions Ltd. | ₹1.51T | 67.55 | 6.48 | 20.73 | 24.45 |
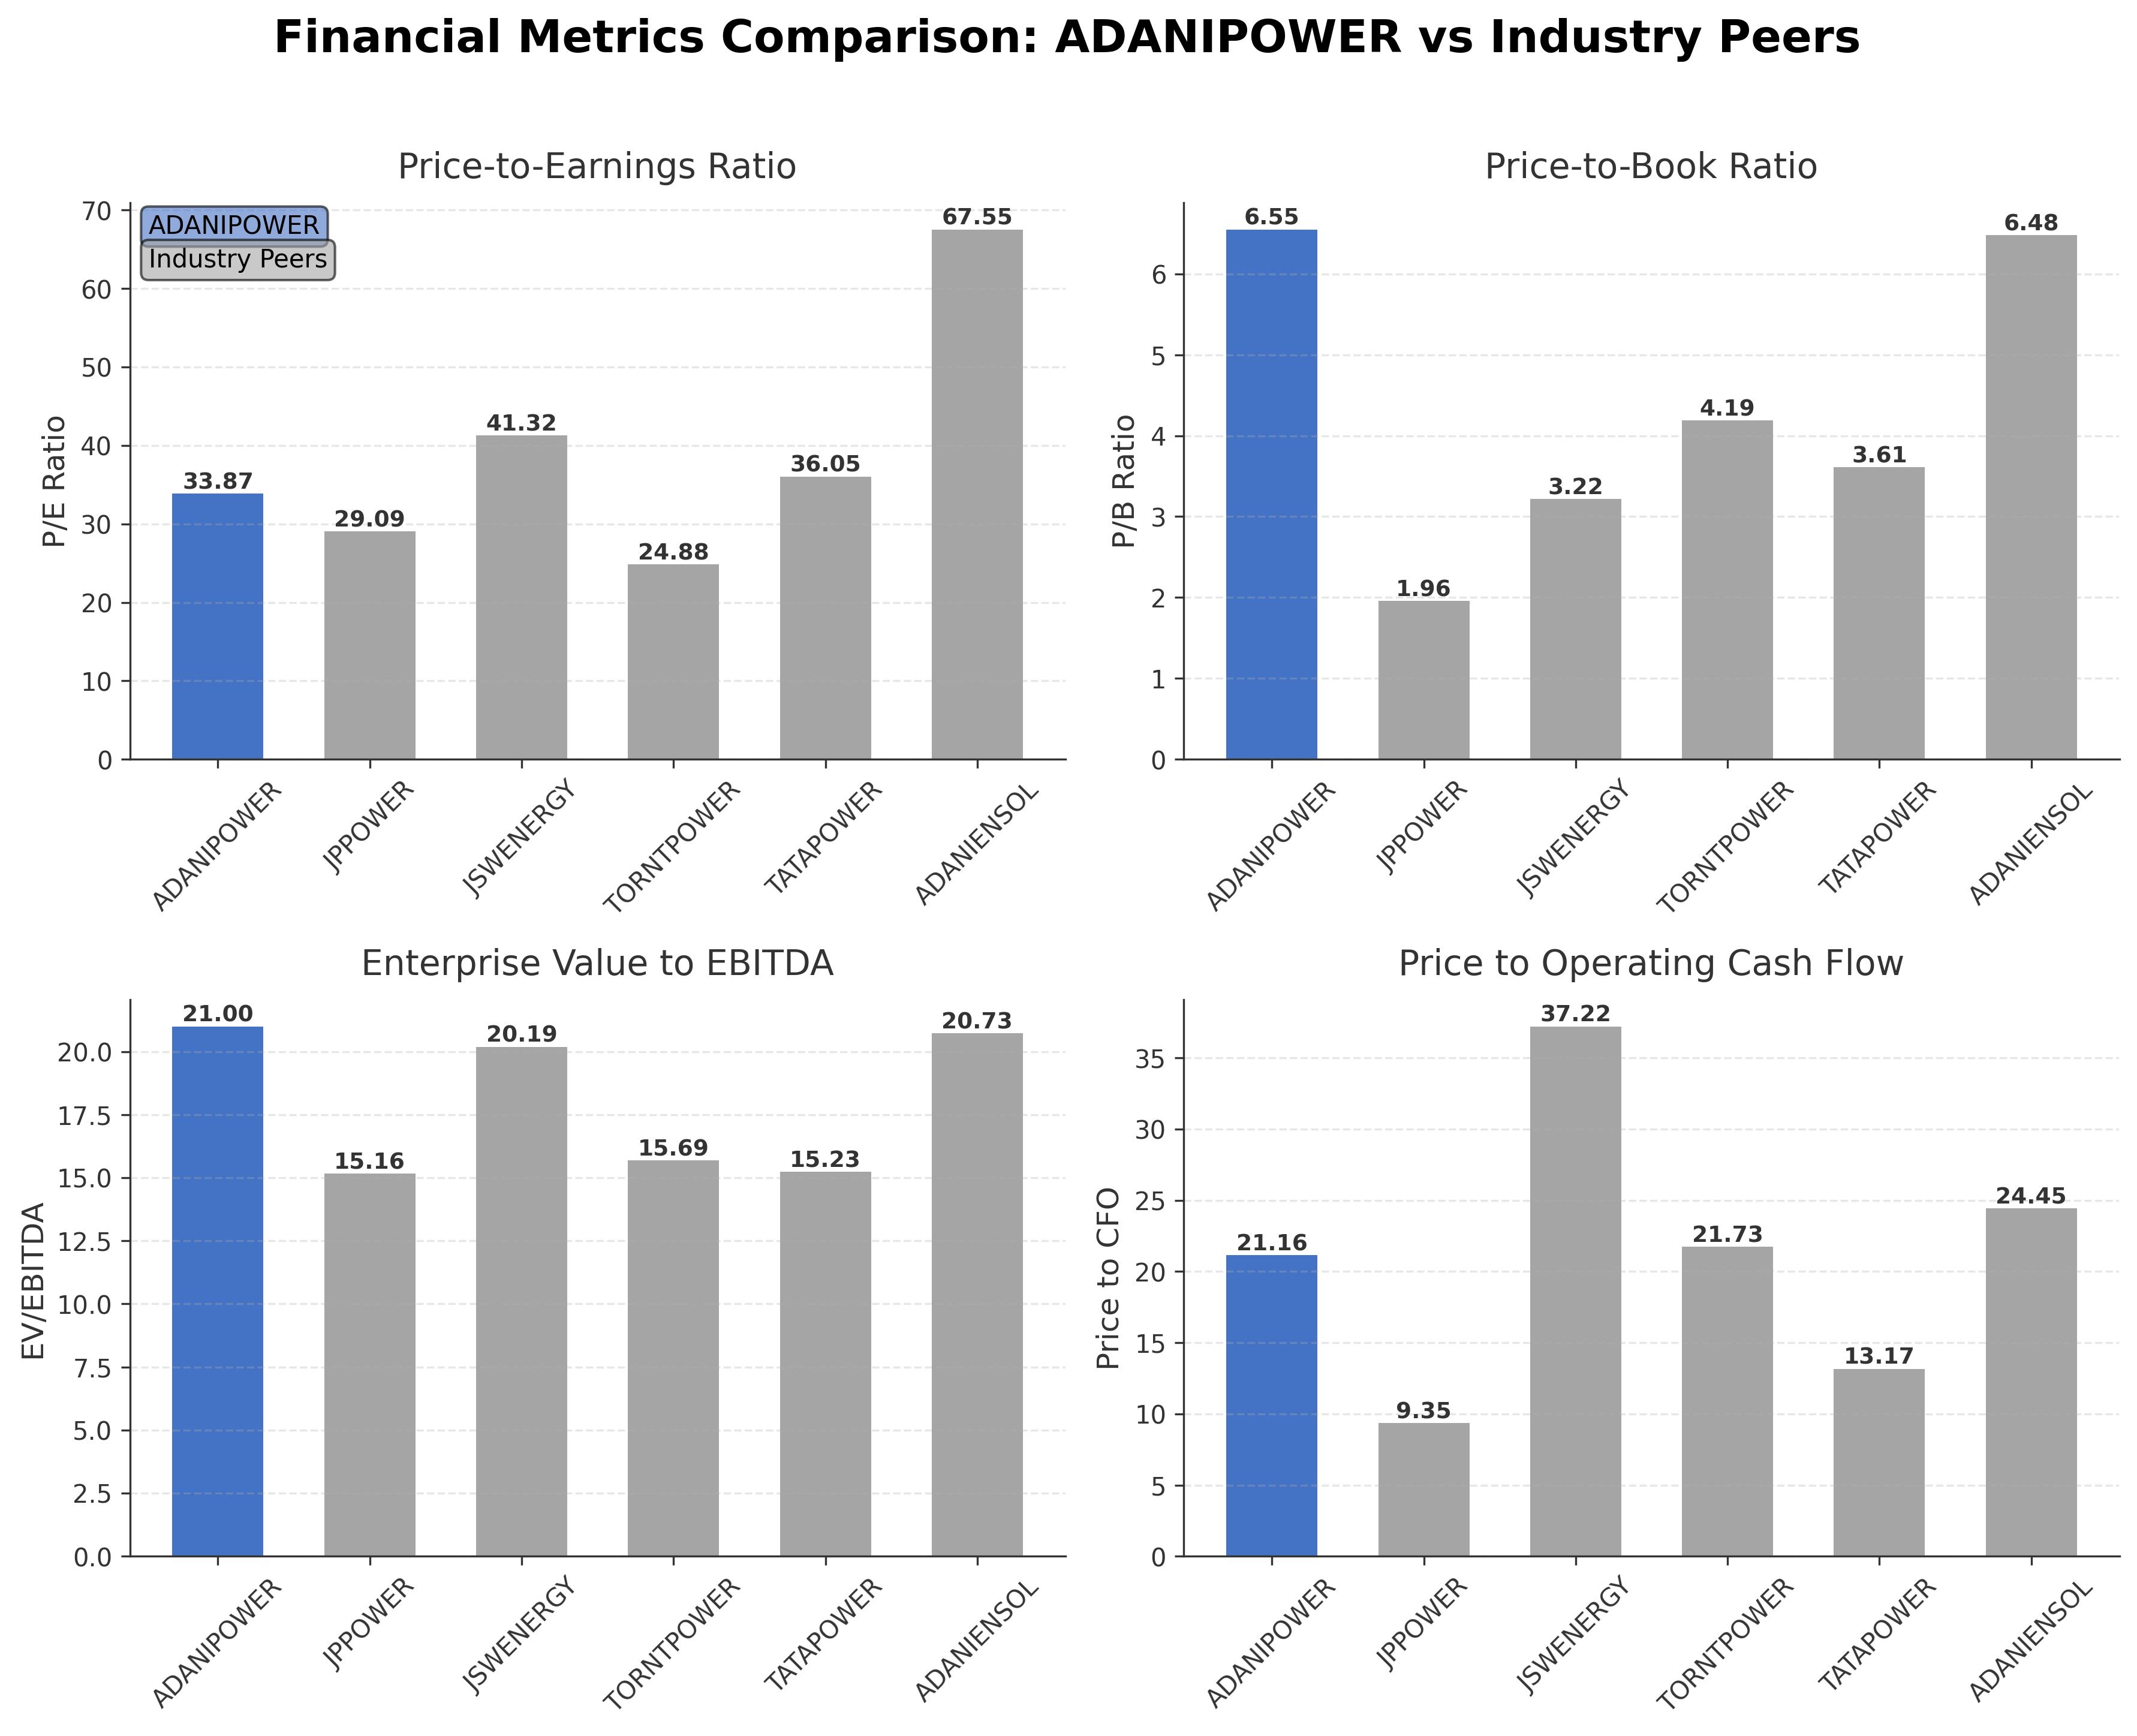
Comparison Analysis: Adani Power Ltd. stands out among its Indian independent power producer peers with a market capitalization of ₹3.82 trillion, significantly larger than competitors. Its trailing P/E ratio of 33.87 is moderate relative to the high valuation of Adani Energy Solutions (67.55) but higher than Torrent Power (24.88) and Jaiprakash Power (29.09). The company’s P/B ratio of 6.55 is among the highest, indicating premium valuation relative to book value. Its EV/EBITDA multiple of 21.00 is slightly above the peer average, reflecting market expectations of strong earnings growth. Return on equity at 21.61% is robust compared to peers, highlighting efficient capital utilization. Overall, Adani Power exhibits leadership in scale and profitability, though at relatively elevated valuation multiples.
Financial Metrics Comparison with Peers
Financial Statements
Comprehensive financial data including income, balance sheet, and cash flow metrics
Income Statement
| fiscal_date | 2025-03-31 | 2024-03-31 | 2023-03-31 | 2022-03-31 | 2021-03-31 |
|---|---|---|---|---|---|
| Sales | 561.32B | 502.84B | 387.17B | 276.55B | 261.51B |
| Cost Of Goods | 324.90B | 302.93B | 271.89B | 168.23B | 166.13B |
| Gross Profit | 236.41B | 199.91B | 115.29B | 108.32B | 95.38B |
| Operating Expense Selling General And Administrative | 3.74B | 3.15B | 2.58B | 1.64B | 1.64B |
| Operating Expense Other Operating Expenses | 9.13B | 8.48B | 5.26B | 2.82B | 2.95B |
| Operating Income | 177.55B | 147.22B | 72.41B | 71.72B | 58.32B |
| Non Operating Interest Income | 14.44B | 89.21B | 36.07B | 35.58B | 10.45B |
| Non Operating Interest Expense | 30.73B | 30.79B | 30.40B | 38.72B | 46.48B |
| Pretax Income | 163.60B | 207.92B | 76.75B | 65.77B | 22.89B |
| Income Tax | 36.10B | -372.80M | -30.52B | 16.66B | 10.19B |
| Net Income | 127.50B | 208.29B | 107.27B | 49.12B | 12.70B |
| Eps Basic | 6.46 | 51.62 | 24.57 | 9.63 | 0.06 |
| Eps Diluted | 6.46 | 51.62 | 24.57 | 9.63 | 0.06 |
| Basic Shares Outstanding | 19.28B | 3.86B | 3.86B | 3.86B | 3.86B |
| Diluted Shares Outstanding | 19.28B | 3.86B | 3.86B | 3.86B | 3.86B |
| Ebit | 194.32B | 238.71B | 107.15B | 104.49B | 69.36B |
| Ebitda | 239.40B | 278.18B | 139.37B | 136.68B | 104.87B |
| Net Income Continuous Operations | 163.60B | 207.92B | 76.75B | 65.77B | 22.89B |
| Minority Interests | 1.89B | N/A | N/A | 0.00 | 0.00 |
| Preferred Stock Dividends | 4.75B | 9.19B | 12.52B | 11.98B | 12.45B |
Source: Financial statements and regulatory filings
Balance Sheet
| fiscal_date | 2025-03-31 | 2024-03-31 | 2023-03-31 | 2022-03-31 | 2021-03-31 |
|---|---|---|---|---|---|
| Cash And Cash Equivalents | 3.20B | 11.36B | 3.49B | 7.82B | 1.13B |
| Accounts Receivable | 130.22B | 116.77B | 115.29B | 95.61B | 118.39B |
| Total Assets | 1129.18B | 923.25B | 858.21B | 819.81B | 788.06B |
| Total Liabilities | 552.44B | 491.80B | 559.46B | 632.78B | 656.93B |
| Long Term Debt | 286.02B | 265.54B | 336.22B | 378.11B | 399.68B |
| Shareholders Equity | 576.74B | 431.45B | 298.76B | 187.03B | 131.13B |
Source: Financial statements and regulatory filings
Cash Flow Statement
| fiscal_date | 2025-03-31 | 2024-03-31 | 2023-03-31 | 2022-03-31 | 2021-03-31 |
|---|---|---|---|---|---|
| Operating Activities Net Income | 163.60B | 207.92B | 76.75B | 65.77B | 22.89B |
| Operating Activities Other Non Cash Items | 12.32B | -60.17B | -6.07B | 3.29B | 34.49B |
| Operating Activities Accounts Receivable | -3.42B | -17.38B | -29.95B | 9.81B | 1.89B |
| Operating Activities Other Assets Liabilities | 7.81B | -33.27B | 20.68B | -3.08B | -3.46B |
| Operating Activities Operating Cash Flow | 180.32B | 97.09B | 61.40B | 75.79B | 55.81B |
| Investing Activities Capital Expenditures | -115.44B | 5.60M | 8.30M | 12.40M | 99.60M |
| Investing Activities Net Acquisitions | -63.96B | 5.34B | 2.62B | -10.00M | 0.00 |
| Investing Activities Purchase Of Investments | -6.26B | N/A | -4.58B | -1.62B | -4.29B |
| Investing Activities Sale Of Investments | 0.00 | 4.06B | 0.00 | 815.40M | 21.49B |
| Investing Activities Other Investing Activity | 5.12B | -45.45B | 1.51B | -2.15B | -3.85B |
| Investing Activities Investing Cash Flow | -180.54B | -36.04B | -440.60M | -2.95B | 13.45B |
| Financing Activities Long Term Debt Issuance | 37.13B | 226.72B | 212.05B | 133.32B | 225.58B |
| Financing Activities Long Term Debt Payments | -28.52B | -305.98B | -269.48B | -178.96B | -251.33B |
| Financing Activities Short Term Debt Issuance | 27.43B | 18.97B | -12.00B | -18.32B | 7.04B |
| Financing Activities Common Stock Issuance | 2.50B | N/A | N/A | N/A | N/A |
| Financing Activities Common Stock Repurchase | -5.00B | N/A | N/A | N/A | N/A |
| Financing Activities Other Financing Charges | -50.98B | -74.03B | -946.80M | 101.70M | 196.40M |
| Financing Activities Financing Cash Flow | -17.45B | -134.33B | -70.38B | -63.85B | -18.50B |
| End Cash Position | 3.20B | 11.36B | 3.49B | 7.82B | 1.13B |
| Free Cash Flow | 99.42B | 115.68B | 51.87B | 67.98B | 33.97B |
Source: Financial statements and regulatory filings
Technical Analysis
Key Insights
- The current trend direction for Adani Power Ltd. is strongly bullish, with the stock price recently reaching new all-time highs and demonstrating sustained upward momentum.
- Key support levels are identified near ₹200 and ₹153, while resistance is currently being tested around the ₹214 mark, coinciding with recent highs.
- The stock is trading above its major moving averages, including the 10-day, 50-day (₹153.14), and 200-day (₹142.82) moving averages, indicating a strong positive trend.
- Momentum indicators show the Relative Strength Index (RSI) in overbought territory, MACD remains positive with a bullish crossover, and Stochastic oscillators confirm strong upward momentum.
- Analysis across daily, weekly, and monthly timeframes consistently shows strength, with higher highs and higher lows confirming the prevailing uptrend.
- Potential market scenarios include continuation of the rally supported by strong volume, though short-term consolidation or pullbacks may occur due to overbought conditions.
Trending News
Summary: Adani Power Share Price: Find the latest news on Adani Power Stock Price. Get all the information on Adani Power with historic price charts for NSE / BSE. Experts & Broker view also get the Adani Power Ltd. buy/sell tips detailed news, announcements, Forecasts, Analysts, Valuation, Earning ...
Sentiment: neutral
2. Headline: Adani Power Ltd Sees Exceptional Volume Surge Amid Strong Price Rally
Summary: Adani Power Ltd (ADANIPOWER) witnessed a remarkable surge in trading volume on 22 Apr 2026, emerging as one of the most actively traded stocks in the power sector. The stock hit a new 52-week high of ₹209.7, supported by robust buying interest and sustained gains over the past fortnight, ...
Sentiment: positive
3. Headline: Adani Power Ltd Hits All-Time High of Rs 209.75 as Momentum Builds Across Timeframes
Summary: Adani Power Ltd has reached a significant milestone by touching an all-time high price of Rs.209.75 on 22 April 2026, marking a remarkable phase in the company’s stock performance within the power sector.
Sentiment: positive
4. Headline: Adani Power Share Price Jumps 5% to Rs. 214, Market Cap Crosses Rs. 4 Trillion
Summary: Adani Power share price hits Rs. 214, rises 5% intraday, market cap crosses Rs. 4 trillion with strong demand outlook and long-term deals.
Sentiment: positive
5. Headline: Tata Power vs Adani Power: As temperatures soar, which stock will shine? - The Economic Times
Summary: Shares of Tata Power and Adani Power surged as heatwave alerts from the India Meteorological Department raised expectations of higher electricity demand, with analysts weighing their risk-reward appeal.
Sentiment: positive
Recent Updates
News Summary
As of 22 April 2026. Adani Power Ltd. has experienced a significant increase in its market capitalization, surpassing ₹4 trillion following a 5% intraday rise in its share price to ₹214. This milestone reflects strong investor confidence supported by a positive demand outlook and the securing of long-term power supply agreements. The company has also overtaken Adani Ports to become the largest listed entity within the Adani Group, with a year-to-date share price growth of 38.56%. This performance underscores a shift in investor focus towards the power and energy sectors within the conglomerate. These developments highlight the company's growing prominence in India's energy market and its expanding valuation.
News Sentiment
The overall sentiment from recent updates is predominantly positive, driven by strong share price appreciation, significant market capitalization milestones, and favorable investor interest. The rise in market cap beyond ₹4 trillion and the stock's status as the largest Adani Group company reflect robust market confidence. Positive demand outlooks and long-term contract wins further support this sentiment. There are no notable negative developments reported in the recent news, indicating a constructive environment for the company.
Source List
- https://analyticsinsight.net/stocks/adani-power-share-price-jumps-5-to-rs-214-market-cap-crosses-rs-4-trillion
- https://www.livemint.com/market/stock-market-news/adani-power-trumps-adani-ports-to-become-the-largest-adani-group-stock-11776744924595.html
Analytical Overview
Analysis Summary
Adani Power’s valuation metrics, including a trailing P/E of 33.87 and forward P/E of 29.08, are elevated compared to some industry peers but align with the Indian utilities sector average of 33.87, reflecting market expectations of sustained growth. The company’s revenue has shown a slight decline of 8.9% in the most recent quarter, while cash flow trends remain strong with operating cash flow of ₹180.3 billion and free cash flow of ₹124.6 billion, indicating solid liquidity. Financial health is supported by a current ratio of 1.60 and a debt-to-equity ratio of 81.25%, suggesting manageable leverage levels relative to cash reserves. Sector-specific opportunities include increasing power demand driven by economic growth and government initiatives promoting renewable energy, while challenges involve regulatory risks and competition. Considering India’s regulatory environment and growing energy consumption, Adani Power is positioned to benefit from favorable market dynamics and infrastructure investments.
Overall Business and Market Assessment
Supporting Factors: strong cash flow generation, a leading market position within India’s power sector, and a robust return on equity of 21.61%
Risk Factors: No data
SWOT Analysis
Strengths
- Strong market position as a leading independent power producer in India.
- Robust profitability with a net profit margin of 21.11%.
- Efficient capital utilization reflected by a return on equity of 21.61%.
- Strong cash flow generation with operating cash flow of ₹180.3 billion.
Weaknesses
- High price-to-book ratio of 6.55 indicating premium valuation.
- Quarterly revenue decline of 8.9% signaling short-term growth challenges.
- Debt-to-equity ratio of 81.25% reflects moderate leverage.
- No dividend payout, which may limit income-focused investor appeal.
Opportunities
- Growing electricity demand in India driven by economic expansion.
- Expansion into renewable energy and nuclear power segments.
- Favorable government policies supporting power infrastructure development.
- Potential for long-term power supply contracts enhancing revenue stability.
Threats
- Regulatory risks related to energy sector policies and tariffs.
- Intense competition from other power producers in India.
- Macroeconomic factors impacting energy consumption and pricing.
- Volatility in fuel costs affecting operating margins.
Company Description
Adani Power Ltd. is an integral energy producer, primarily focusing on the generation of electricity across India. A member of the Adani Group, one of India's eminent conglomerates, this company plays a pivotal role in catering to the country's substantial energy demands. It operates both thermal and solar power plants, thus contributing significantly to the energy mix, which is crucial for meeting industrial and household electricity needs in a rapidly developing economy. Noted for its efficient and large-scale operations, Adani Power has facilities strategically located in various parts of India, which supports grid reliability and reduces transmission losses. The company’s ventures into renewable energy align with global and national sustainable energy goals. As a key player in India's energy sector, Adani Power Ltd. aids in driving economic growth by ensuring stable power supply and is actively involved in large-scale projects that aim to enhance its capacity and infrastructure to support the nation’s growing energy requirements.