
Acme Solar Holdings Ltd (ACMESOLAR)
Stock Analysis Report
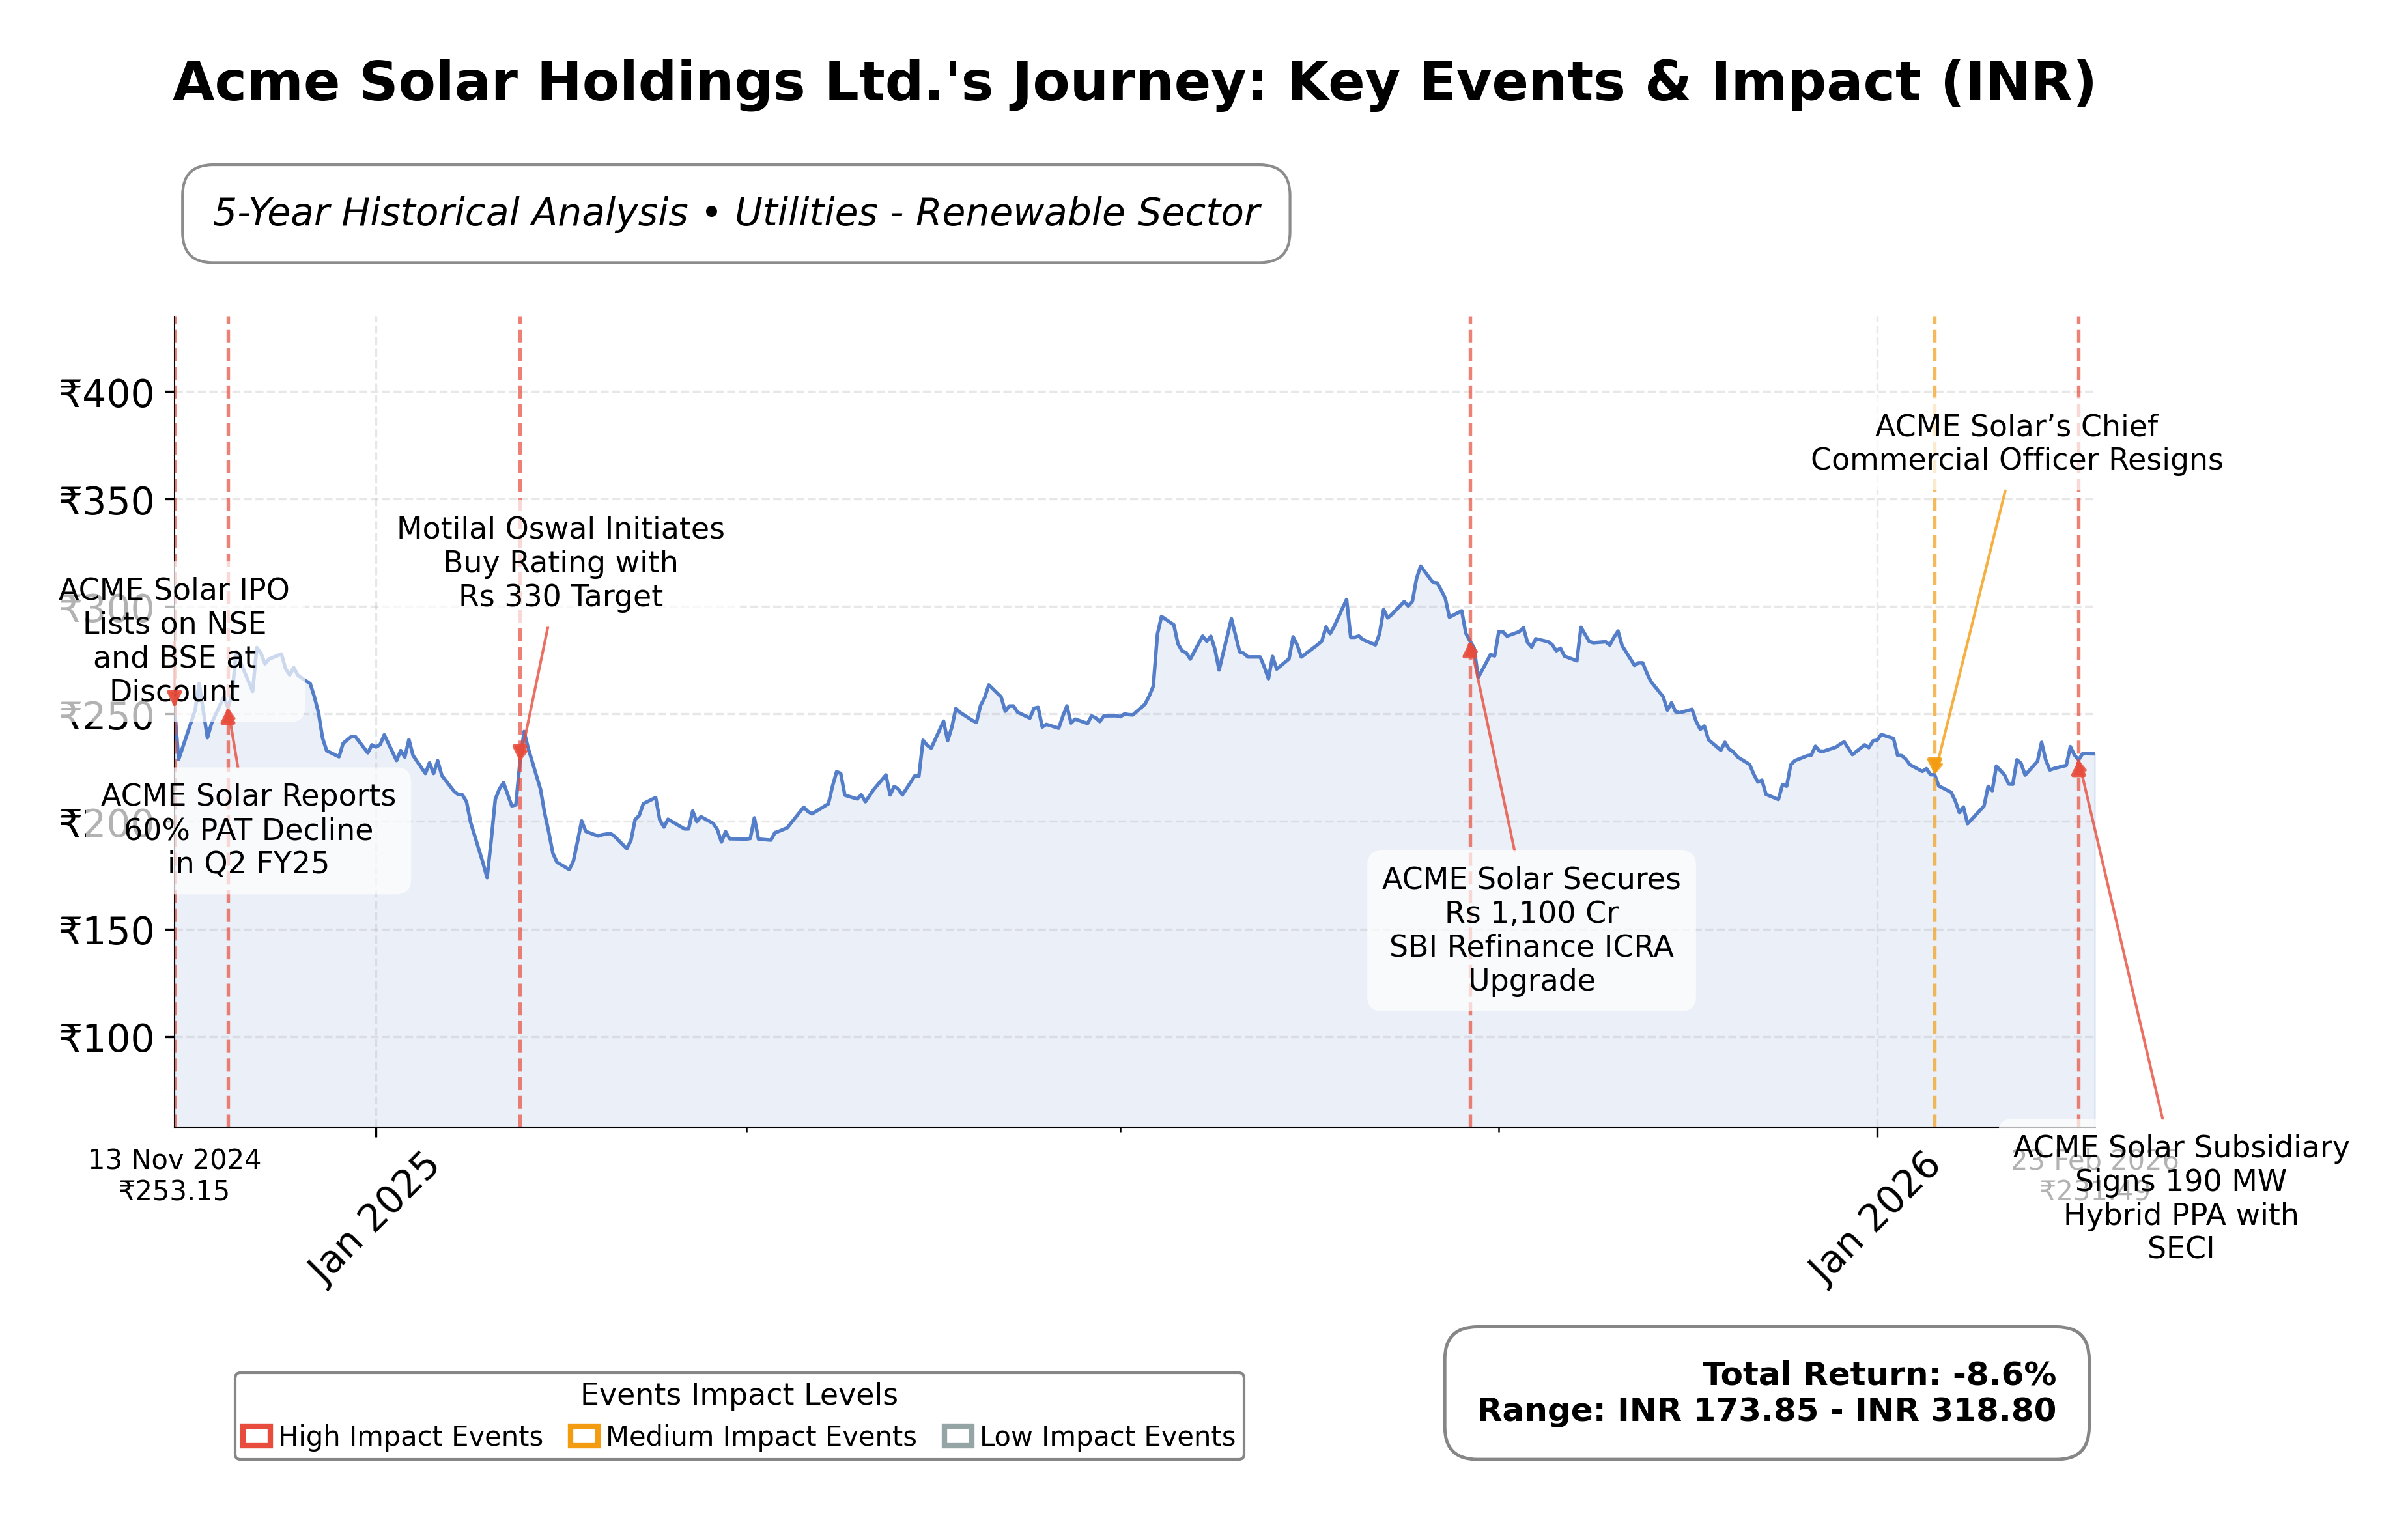
Stock Journey
Key Positives and Key Risks
Pros
- Revenue growth of 42.3% quarter-over-quarter demonstrates strong expansion in business operations.
- Operating margin of 65.28% indicates high operational efficiency and profitability.
- Long-term PPAs, including a 25-year agreement with SECI, provide revenue stability and visibility.
Cons
- Debt-to-equity ratio of 271.78 reflects high financial leverage, increasing risk exposure.
- Return on equity at 5.59% is moderate, suggesting limited shareholder returns relative to peers.
- Market price shows a downside risk of approximately 29.88% from its 52-week high, indicating potential valuation pressures.
Disclosure: This information is for general awareness and does not constitute investment advice
Report Summary
Acme Solar Holdings Ltd. operates primarily in the renewable energy sector within India, focusing on the development, construction, and maintenance of solar power projects. Positioned as a significant player in the Utilities - Renewable industry, the company contributes to sustainable energy generation through solar and hybrid power initiatives, supporting government and corporate clean energy goals.
Financially, Acme Solar exhibits a market capitalization of approximately â¹140.34 billion with a trailing P/E ratio of 28.90 and a forward P/E of 22.47, indicating valuation metrics aligned with industry averages. The company reported a revenue of â¹19.62 billion (TTM) with a profit margin of 24.61% and an operating margin of 65.28%. Its return on equity stands at 5.59%, supported by a strong current ratio of 2.87, though it carries a high debt-to-equity ratio of 271.78. Cash flow metrics show operating cash flow of â¹12.31 billion and free cash flow of â¹2.52 billion (TTM).
Recent strategic initiatives include signing a 25-year power purchase agreement (PPA) with the Solar Energy Corporation of India (SECI) for a 190 MW wind-solar hybrid project, expanding its PPA-backed capacity to 5,820 MW. Technical indicators reveal the stock trading below its 200-day moving average but above the 50-day average, suggesting mixed momentum. Strengths include a robust operating margin and strong liquidity, while risks stem from elevated leverage and moderate return on assets. Institutional shareholding remains modest at 8.38%, with insiders holding less than 1%, reflecting a relatively dispersed ownership structure.
In comparison to regional peers such as Adani Green Energy, NHPC Ltd., and SJVN Ltd., Acme Solar maintains a smaller market capitalization but exhibits more moderate valuation multiples, including a lower P/E and EV/EBITDA ratio. While peers like Adani Green show higher P/E ratios and price-to-book multiples, Acme Solarâs valuation metrics suggest a more conservative market positioning. Return on equity across these companies is broadly comparable, indicating similar profitability levels within the sector.
Acme Solar Holdings Ltd. stands as a key participant in India's renewable energy transition, marked by recent contract wins and capacity expansions. The company navigates challenges related to capital structure and competitive pressures while leveraging long-term PPAs to secure revenue streams. The evolving regulatory and market environment presents both opportunities and risks, with the companyâs strategic decisions poised to influence its growth trajectory. Observers evaluating the stock may find merit in monitoring its operational execution and financial leverage as pivotal factors shaping future performance.
Company and Industry Overview
Company Basics
Price Performance
Company Size
Shareholding Pattern
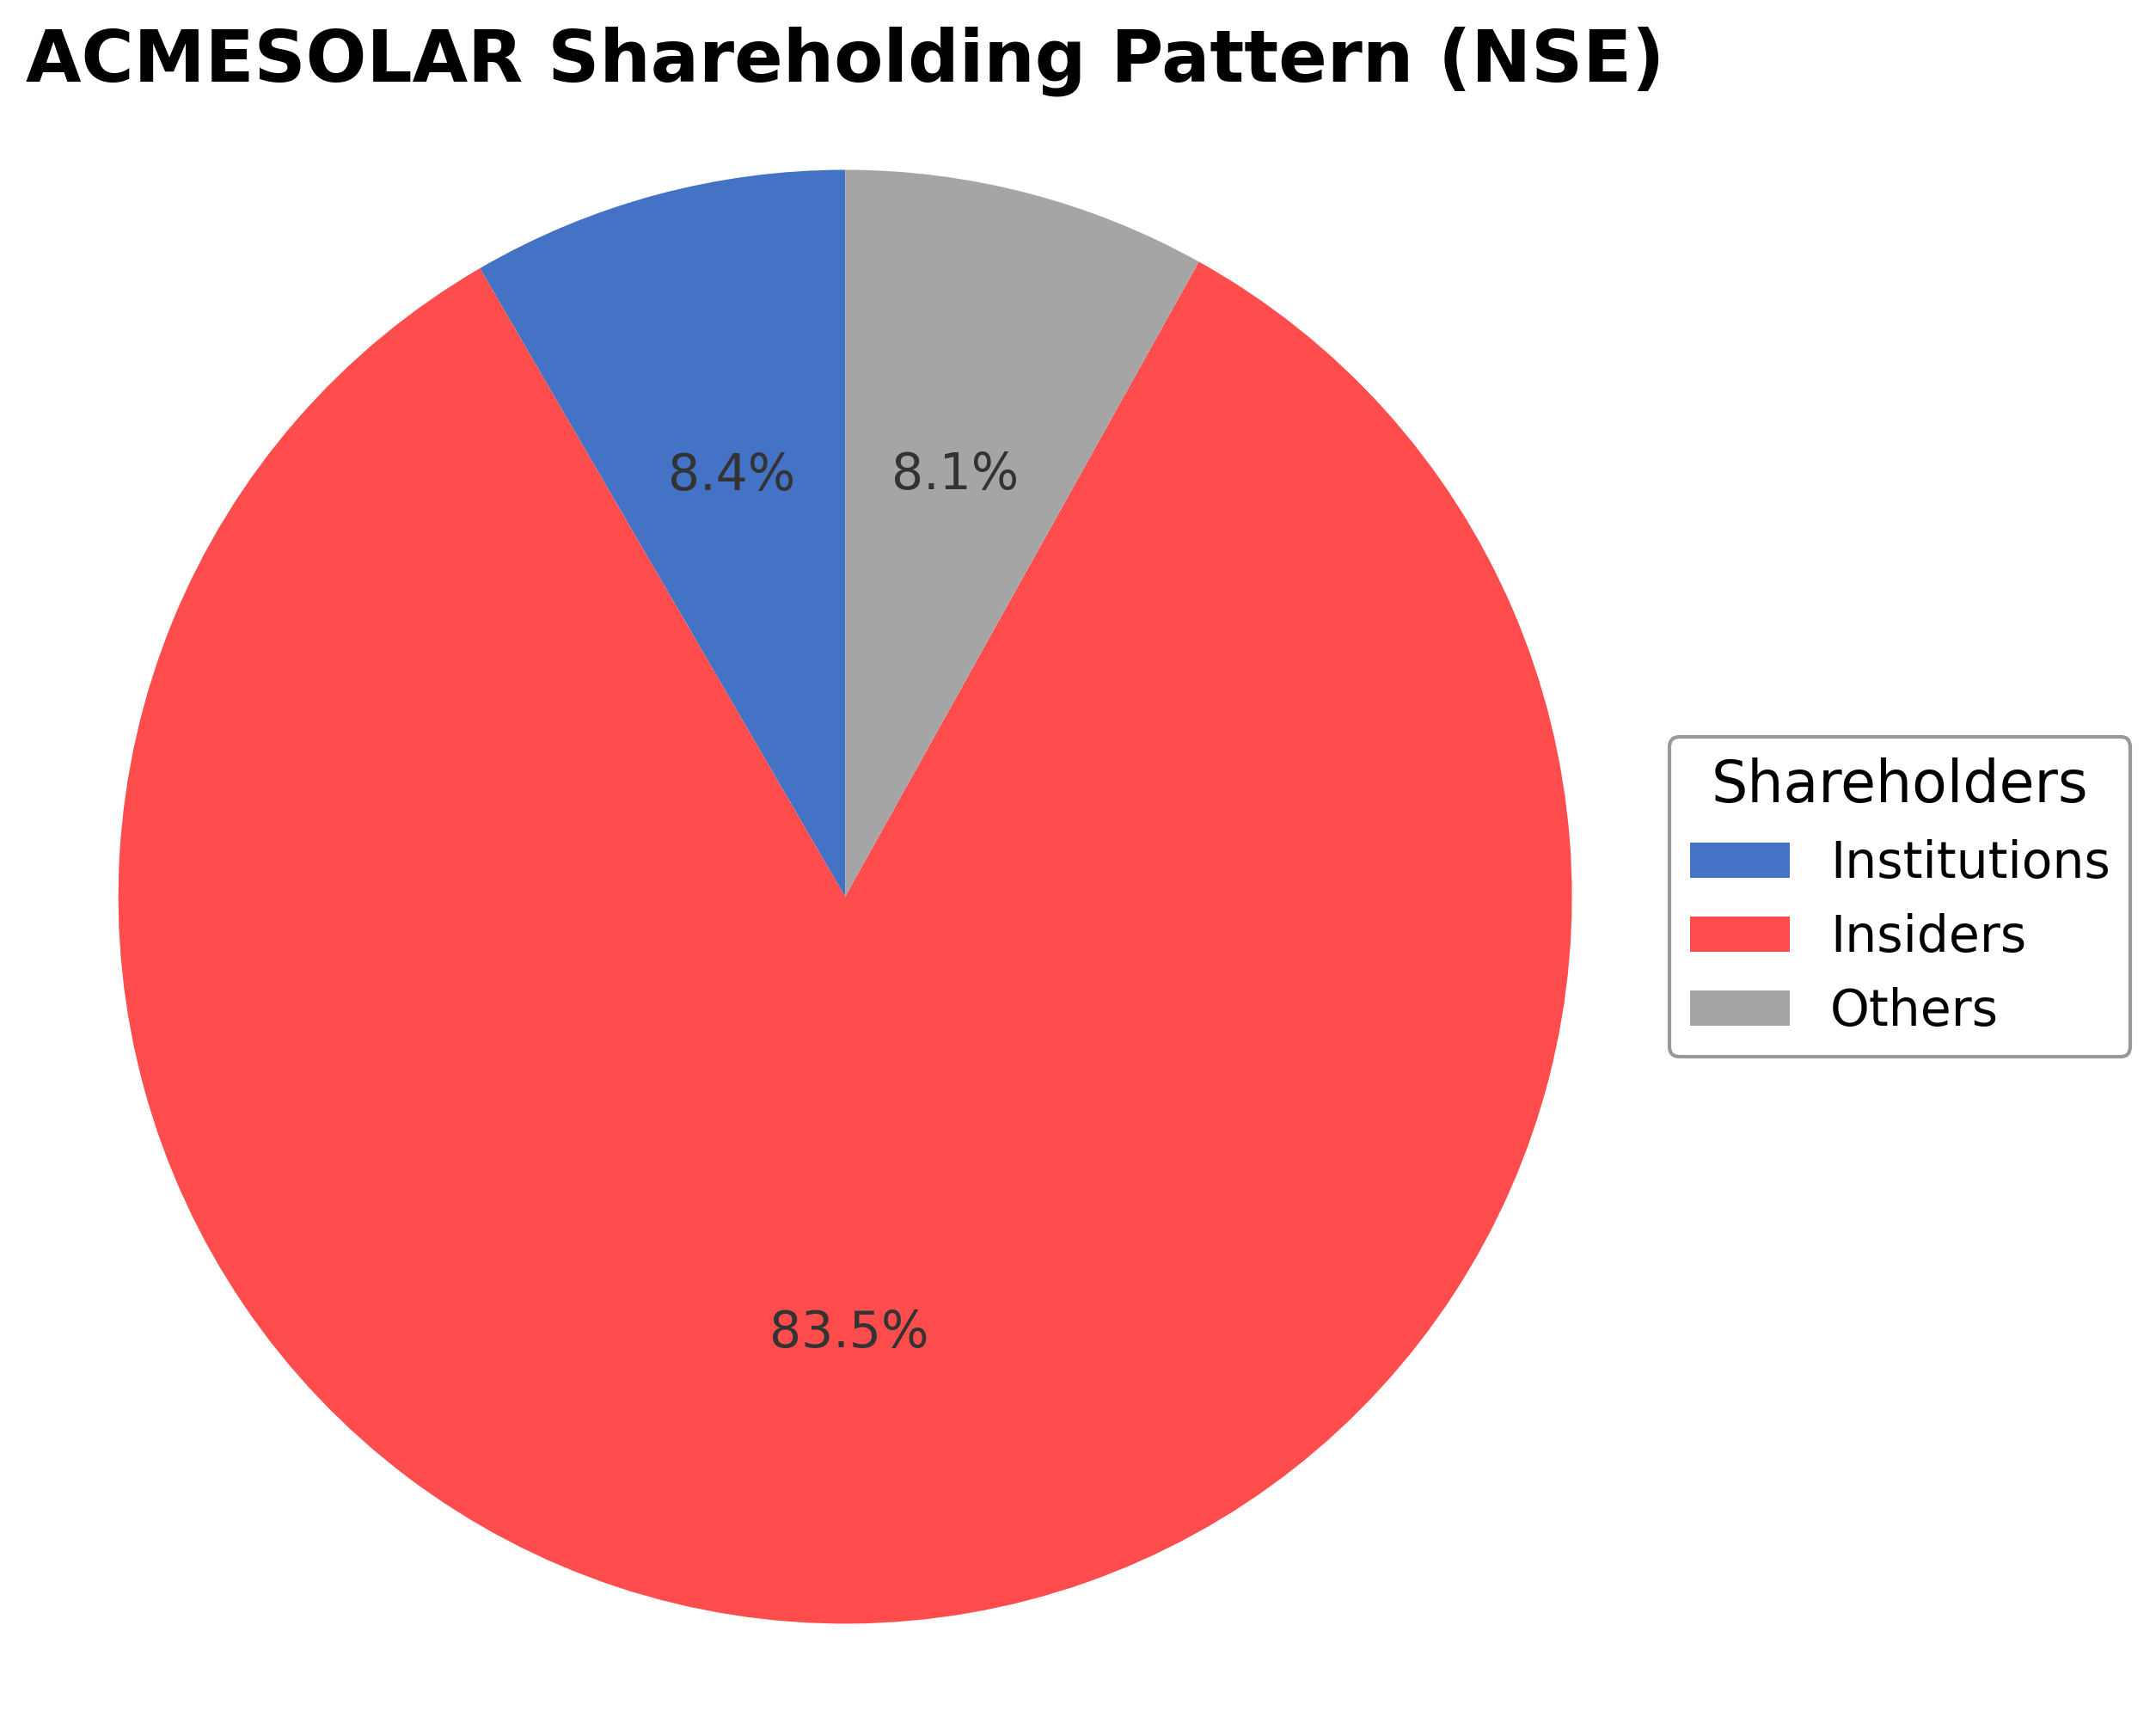
Acme Solar Holdings Ltd.'s ownership structure comprises approximately 0.84% insiders, including executives and board members, and 8.38% institutional investors such as mutual funds and asset managers, with the remaining 90.78% held by public shareholders including retail investors and employee stock plans. Over the past 12-24 months, institutional ownership has shown modest accumulation, reflecting cautious market sentiment. Major institutional investors have maintained stable positions without significant shifts. This dispersed ownership pattern suggests a broad shareholder base with limited insider control, potentially influencing governance dynamics and strategic decision-making within the renewable utilities sector in India.
Sector and Industry Analysis
Sector and Industry Analysis: Solar Energy Sector & Renewable Power Industry
1. Sector Overview The solar energy sector is a critical segment within the broader renewable energy industry, which has experienced robust growth driven by global decarbonization efforts and increasing demand for sustainable power sources. As of the early 2020s, the global solar market size was estimated in the hundreds of billions of USD, with compound annual growth rates (CAGR) often exceeding 15-20% depending on regional dynamics. Key players include vertically integrated firms such as First Solar, SunPower, and Canadian Solar, alongside diversified energy conglomerates expanding their renewable portfolios. The sector’s growth trajectory is underpinned by declining photovoltaic (PV) system costs, improving efficiency, and expanding installation capacity worldwide, particularly in markets like China, the United States, India, and the European Union.
2. Industry Trends Technological innovation remains a pivotal driver, with advances in PV cell efficiency, bifacial modules, and energy storage integration reshaping cost structures and performance benchmarks. Additionally, digitalization and smart grid technologies are enhancing solar asset management and grid compatibility. Consumer behavior is shifting towards decentralized energy generation, with increased adoption of residential and commercial rooftop solar systems. Emerging opportunities include solar-plus-storage solutions, floating solar installations, and integration with electric vehicle (EV) charging infrastructure. Corporate Power Purchase Agreements (PPAs) and green hydrogen production are also expanding demand channels, reflecting a broader energy transition.
3. Regulatory Landscape The solar sector operates within a complex regulatory environment characterized by supportive policies such as feed-in tariffs, tax credits (e.g., Investment Tax Credit in the U.S.), renewable portfolio standards, and carbon pricing mechanisms. Compliance requirements include environmental impact assessments, grid interconnection standards, and safety certifications. Policy volatility remains a risk factor, as subsidy reductions or trade tariffs on solar components can impact project economics. International climate commitments, such as the Paris Agreement, continue to drive regulatory frameworks favoring renewable deployment, while local permitting and land use regulations influence project timelines and costs.
4. Competitive Dynamics The solar industry exhibits a moderately consolidated market structure with a mix of large multinational manufacturers and numerous specialized firms focusing on installation, project development, and operations. Barriers to entry include high capital intensity, technology expertise, supply chain integration, and regulatory compliance. Competitive positioning hinges on cost leadership, technological innovation, scale economies, and geographic diversification. Vertical integration—from polysilicon production to module manufacturing and project development—provides strategic advantages. Additionally, firms that can secure long-term PPAs or government contracts tend to achieve more stable cash flows, enhancing their competitive resilience in a rapidly evolving market landscape.
Note: Analysis synthesized from industry research, market reports, and regulatory filings. Information is subject to change based on market conditions.
Illustrative Scenario Analysis
DCF Assumptions:
Method: Two-Stage EPS-Priority Model
Financials
Peer Analysis
| Company Name | Market Cap | P/E Ratio | P/B Ratio | EV/EBITDA | Price to CFO |
|---|---|---|---|---|---|
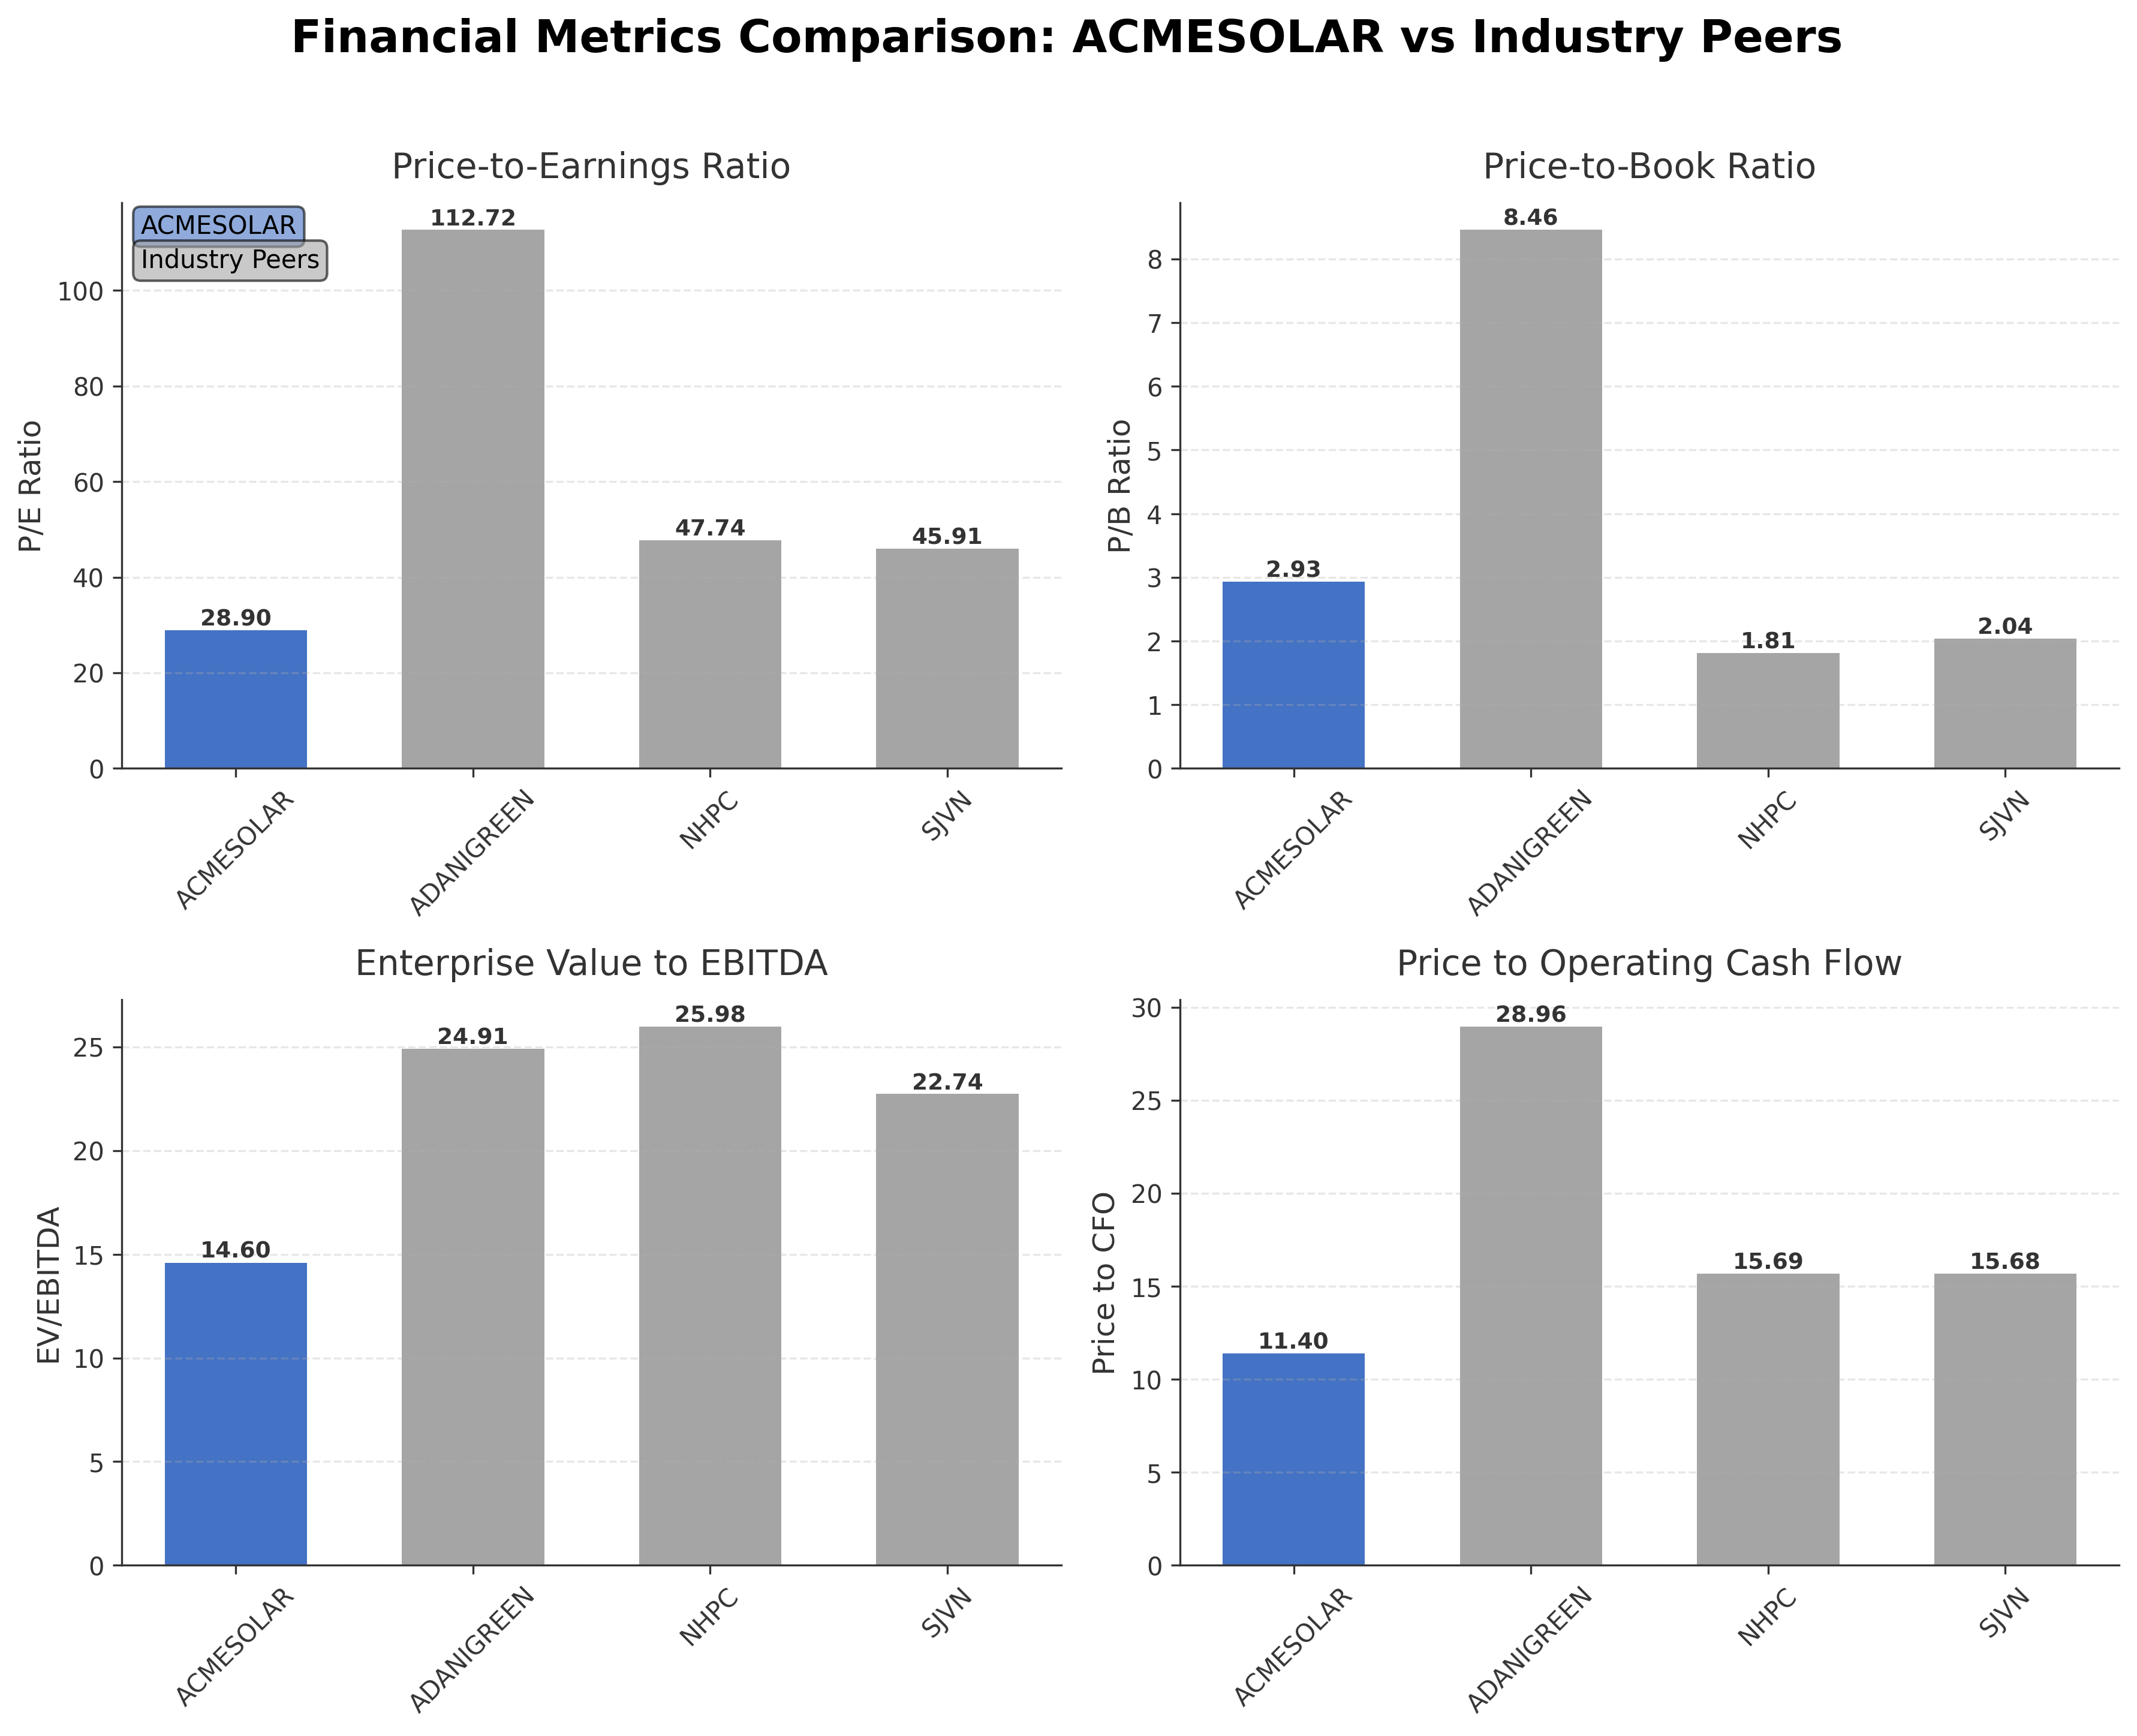
| Acme Solar Holdings Ltd. | ₹140.34B | 28.90 | 2.93 | 14.60 | 11.40 |
| Adani Green Energy Limited | ₹1.59T | 112.72 | 8.46 | 24.91 | 28.96 |
| NHPC Ltd. | ₹748.05B | 47.74 | 1.81 | 25.98 | 15.69 |
| SJVN Ltd. | ₹295.91B | 45.91 | 2.04 | 22.74 | 15.68 |
Comparison Analysis: Acme Solar Holdings Ltd. exhibits lower valuation multiples compared to larger regional peers such as Adani Green Energy and NHPC Ltd., with a P/E ratio of 28.90 versus 112.72 and 47.74 respectively. Its price-to-book ratio of 2.93 is moderate, positioned between NHPC's 1.81 and Adani Green's 8.46. The EV/EBITDA multiple of 14.60 is also comparatively lower, indicating a more conservative valuation. Return on equity is broadly in line with peers, around 6%, suggesting similar profitability levels. The company's price to cash flow ratio of 11.40 is below peer averages, reflecting relatively efficient cash generation. Overall, Acme Solar shows a balanced valuation profile within the Indian renewable utilities sector.
Financial Metrics Comparison with Peers
Financial Statements
Comprehensive financial data including income, balance sheet, and cash flow metrics
Income Statement
| fiscal_date | 2025-03-31 | 2024-03-31 | 2023-03-31 | 2022-03-31 |
|---|---|---|---|---|
| Sales | 14.05B | 13.19B | 12.94B | 14.87B |
| Cost Of Goods | 510.75M | 461.00M | 567.62M | 1.56B |
| Gross Profit | 13.54B | 10.22B | 12.38B | 13.31B |
| Operating Expense Selling General And Administrative | 270.38M | 303.37M | 256.02M | 408.33M |
| Operating Expense Other Operating Expenses | 210.47M | 1.71B | 43.01M | 98.86M |
| Operating Income | 9.50B | 7.81B | 6.89B | 6.96B |
| Non Operating Interest Income | 1.34B | 1.04B | 536.15M | 513.08M |
| Non Operating Interest Expense | 7.51B | 7.67B | 8.03B | 9.23B |
| Pretax Income | 3.38B | 9.09B | -154.01M | 1.02B |
| Income Tax | 872.15M | 2.12B | -122.27M | 404.16M |
| Net Income | 2.51B | 6.98B | -31.74M | 620.10M |
| Eps Basic | 4.55 | 11.53 | -0.05 | 1.03 |
| Eps Diluted | 4.53 | 11.53 | -0.05 | 1.03 |
| Basic Shares Outstanding | 554.22M | 605.12M | 605.12M | 605.12M |
| Diluted Shares Outstanding | 554.22M | 605.12M | 605.12M | 605.12M |
| Ebit | 10.89B | 16.77B | 7.88B | 10.25B |
| Ebitda | 13.96B | 12.36B | 12.33B | 12.40B |
| Net Income Continuous Operations | 3.38B | 9.09B | -154.01M | 1.02B |
| Minority Interests | 12.87M | 170.00K | 330.00K | 240.00K |
| Preferred Stock Dividends | 0.00 | 0.00 | 0.00 | 0.00 |
Data provided by Twelve Data
Balance Sheet
| fiscal_date | 2025-03-31 | 2024-03-31 | 2023-03-31 | 2022-03-31 |
|---|---|---|---|---|
| Cash And Cash Equivalents | 12.52B | 2.55B | 4.03B | 4.23B |
| Accounts Receivable | 3.81B | 4.21B | 6.99B | 9.31B |
| Total Assets | 184.04B | 134.00B | 121.87B | 108.87B |
| Total Liabilities | 138.94B | 108.09B | 102.56B | 88.78B |
| Long Term Debt | 103.62B | 79.85B | 84.25B | 72.71B |
| Shareholders Equity | 45.09B | 25.91B | 19.30B | 20.09B |
Data provided by Twelve Data
Cash Flow Statement
| fiscal_date | 2025-03-31 | 2024-03-31 | 2023-03-31 | 2022-03-31 |
|---|---|---|---|---|
| Operating Activities Net Income | 3.38B | 9.09B | -154.01M | 1.02B |
| Operating Activities Stock Based Compensation | 240.86M | 0.00 | N/A | N/A |
| Operating Activities Other Non Cash Items | 6.12B | 5.96B | 7.29B | 9.30B |
| Operating Activities Accounts Receivable | 400.66M | 2.36B | 2.32B | -3.99B |
| Operating Activities Other Assets Liabilities | 2.16B | 919.45M | 1.20B | 55.73M |
| Operating Activities Operating Cash Flow | 12.31B | 18.34B | 10.65B | 6.40B |
| Investing Activities Capital Expenditures | -32.62B | -28.02B | -7.69B | -14.51B |
| Investing Activities Net Acquisitions | -50.00K | 11.70B | -929.68M | 0.00 |
| Investing Activities Purchase Of Investments | -9.51B | -4.92B | -5.54B | 0.00 |
| Investing Activities Sale Of Investments | 1.55B | 1.36B | 1.11B | 11.87B |
| Investing Activities Investing Cash Flow | -40.59B | -19.88B | -12.88B | -2.63B |
| Financing Activities Long Term Debt Issuance | 65.24B | 13.25B | 19.26B | 38.97B |
| Financing Activities Long Term Debt Payments | -45.14B | -4.21B | -8.00B | -35.98B |
| Financing Activities Short Term Debt Issuance | 1.29B | 175.96M | -1.43B | 1.64B |
| Financing Activities Common Stock Issuance | 22.93B | 0.00 | N/A | N/A |
| Financing Activities Financing Cash Flow | 44.32B | 9.21B | 9.83B | 5.25B |
| End Cash Position | 12.84B | 3.09B | 5.47B | 4.78B |
| Free Cash Flow | -17.23B | -13.89B | 4.95B | -30.64B |
| Investing Activities Other Investing Activity | N/A | -20.00K | 168.69M | N/A |
| Financing Activities Other Financing Charges | N/A | 200.00K | N/A | 619.61M |
Data provided by Twelve Data
Technical Analysis
Key Insights
- The current trend shows mixed momentum with the stock price trading below the 200-day moving average (₹257.40) but above the 50-day moving average (₹225.48), indicating potential short-term support amid longer-term resistance.
- Key support levels are identified near ₹172.63 (52-week low) and ₹225, while resistance is observed around ₹257 and the 52-week high of ₹324.30.
- The price remains above the 10-day moving average, suggesting recent upward price action, but the gap to the 200-day average indicates caution in trend strength.
- Momentum indicators such as RSI and MACD currently reflect neutral to moderate momentum without extreme overbought or oversold conditions.
- Multi-timeframe analysis reveals consolidation on daily and weekly charts, with monthly charts showing a longer-term sideways trend.
- Potential market scenarios include a test of resistance near the 200-day moving average or a retest of support levels, depending on broader market conditions and sector developments.
Trending News
Summary: According to the red herring prospectus (RHP), Clean Max Enviro’s listed peers include ACME Solar Holdings Ltd, which trades at a price-to-earnings (P/E) multiple of 49.46, NTPC Green Energy Ltd at 132.94, Adani Green Energy Limited at 119.14, and ReNew Energy Global PLC, valued at a P/E ...
Sentiment: neutral
2. Headline: ACME signs a PPA deal with SECI for a 190 MW wind-solar hybrid project
Summary: On Wednesday, February 19, ACME Solar Holdings entered into a 25-year power purchase agreement with the Solar Energy Corporation of India (SECI) for a 190 MW wind-solar hybrid project. The deal lifts ACME’s total PPA-backed capacity to 5,820 MW.{alcircleadd} Executed through its subsidiary ACME Urja One Private Ltd...
Sentiment: positive
3. Headline: ACME Solar seals 190 MW hybrid power deal with SECI - The HinduBusinessLine
Summary: ACME Solar Holdings on Wednesday signed a 25-year power purchase agreement with Solar Energy Corporation of India (SECI) for a 190 MW wind-solar hybrid project, pushing its total PPA-signed capacity to 5,820 MW. The agreement, executed through its subsidiary ACME Urja One Private Ltd, covers ...
Sentiment: positive
4. Headline: ACME Solar Shares Gain 2% on Signing a 25 Year Agreement with SECI - Equitypandit
Summary: Shares of ACME Solar Holdings Limited gained 2% after it announced that its wholly-owned subsidiary signed a 25-year agreement with SECI Ltd.
Sentiment: positive
5. Headline: ACME Solar Holdings and 4 Other Stocks Receive Work Orders Worth Up to ₹72 Cr By Trade Brains
Summary: ACME Solar Holdings and 4 Other Stocks Receive Work Orders Worth Up to ₹72 Cr
Sentiment: positive
6. Headline: CERC Allows ACME Solar Holdings to Withdraw Petition on BESS Metering Scheme - Electrical Mirror
Summary: CERC Allows ACME Solar Holdings to Withdraw Petition on BESS Metering Scheme ... Tresub Media pvt. ltd. Gaur City Mall 14th Floor (Office No.
Sentiment: neutral
7. Headline: ACME Solar Secures 190 MW Hybrid Power Project with SECI, ETEnergyworld
Summary: ACME Solar Holdings Ltd, through its subsidiary, has signed a 25-year Power Purchase Agreement for a 190 MW hybrid wind-solar project, featuring a Battery Energy Storage System and a tariff of ₹4.72 per unit. Scheduled for operation by 2028, it is expected to support peak power supply and ...
Sentiment: positive
8. Headline: ACME Solar to develop 190-MW hybrid project in 25-year deal with SECI | Asian Power
Summary: ACME Solar Holdings Limited has signed a 25-year power purchase agreement with SECI Limited for a 190-MW ISTS-connected wind–solar hybrid project.
Sentiment: positive
9. Headline: Acme Solar Holdings Ltd awarded LoA for 220 MW solar with battery energy storage system project | MarketScreener
Summary: ACME Solar Holdings Ltd: Acme Solar Holdings Ltd - awarded LoA for 220 MW solar with battery energy storage system project Acme Solar Holdings Ltd - project with tariff of 2.764 rupees per...
Sentiment: positive
Summary: ACME Solar Share Price: Find the latest news on ACME Solar Stock Price. Get all the information on ACME Solar with historic price charts for NSE / BSE. Experts & Broker view also get the ACME Solar Ltd. buy/sell tips detailed news, announcements, Forecasts, Analysts, Valuation, Earning forecasts, ...
Sentiment: neutral
Powered by Brave
Recent Updates
News Summary
Recent news highlights Acme Solar Holdings Ltd.'s continued expansion in the renewable energy sector, marked by the signing of a 25-year power purchase agreement with SECI for a 190 MW hybrid wind-solar project at a tariff of ₹4.72 per unit. This agreement enhances the company's contracted capacity and supports long-term revenue stability. Additional updates include the award of a Letter of Award (LoA) for a 220 MW solar project with battery energy storage, reflecting ongoing project development. Market sentiment remains neutral to positive, with some reports noting a 'Sell' rating from MarketsMojo, indicating mixed perceptions. Overall, the news cycle underscores Acme Solar's strategic focus on hybrid projects and long-term contracts amid evolving market dynamics.
News Sentiment
Sentiment across recent updates is predominantly neutral to positive, with multiple announcements of project awards and PPAs reinforcing confidence in the company's operational growth. The presence of a 'Sell' rating introduces a note of caution, reflecting some market concerns. Positive sentiment is driven by contract wins and capacity expansions, while neutral sentiment arises from routine market coverage and regulatory developments. This mixed sentiment suggests balanced market views with attention to execution risks and financial metrics.
Analytical Overview
Analysis Summary
Valuation Metrics: Acme Solar's trailing P/E of 28.90 and forward P/E of 22.47 are broadly in line with the industry average P/E of 28.90, suggesting valuation levels consistent with sector norms.
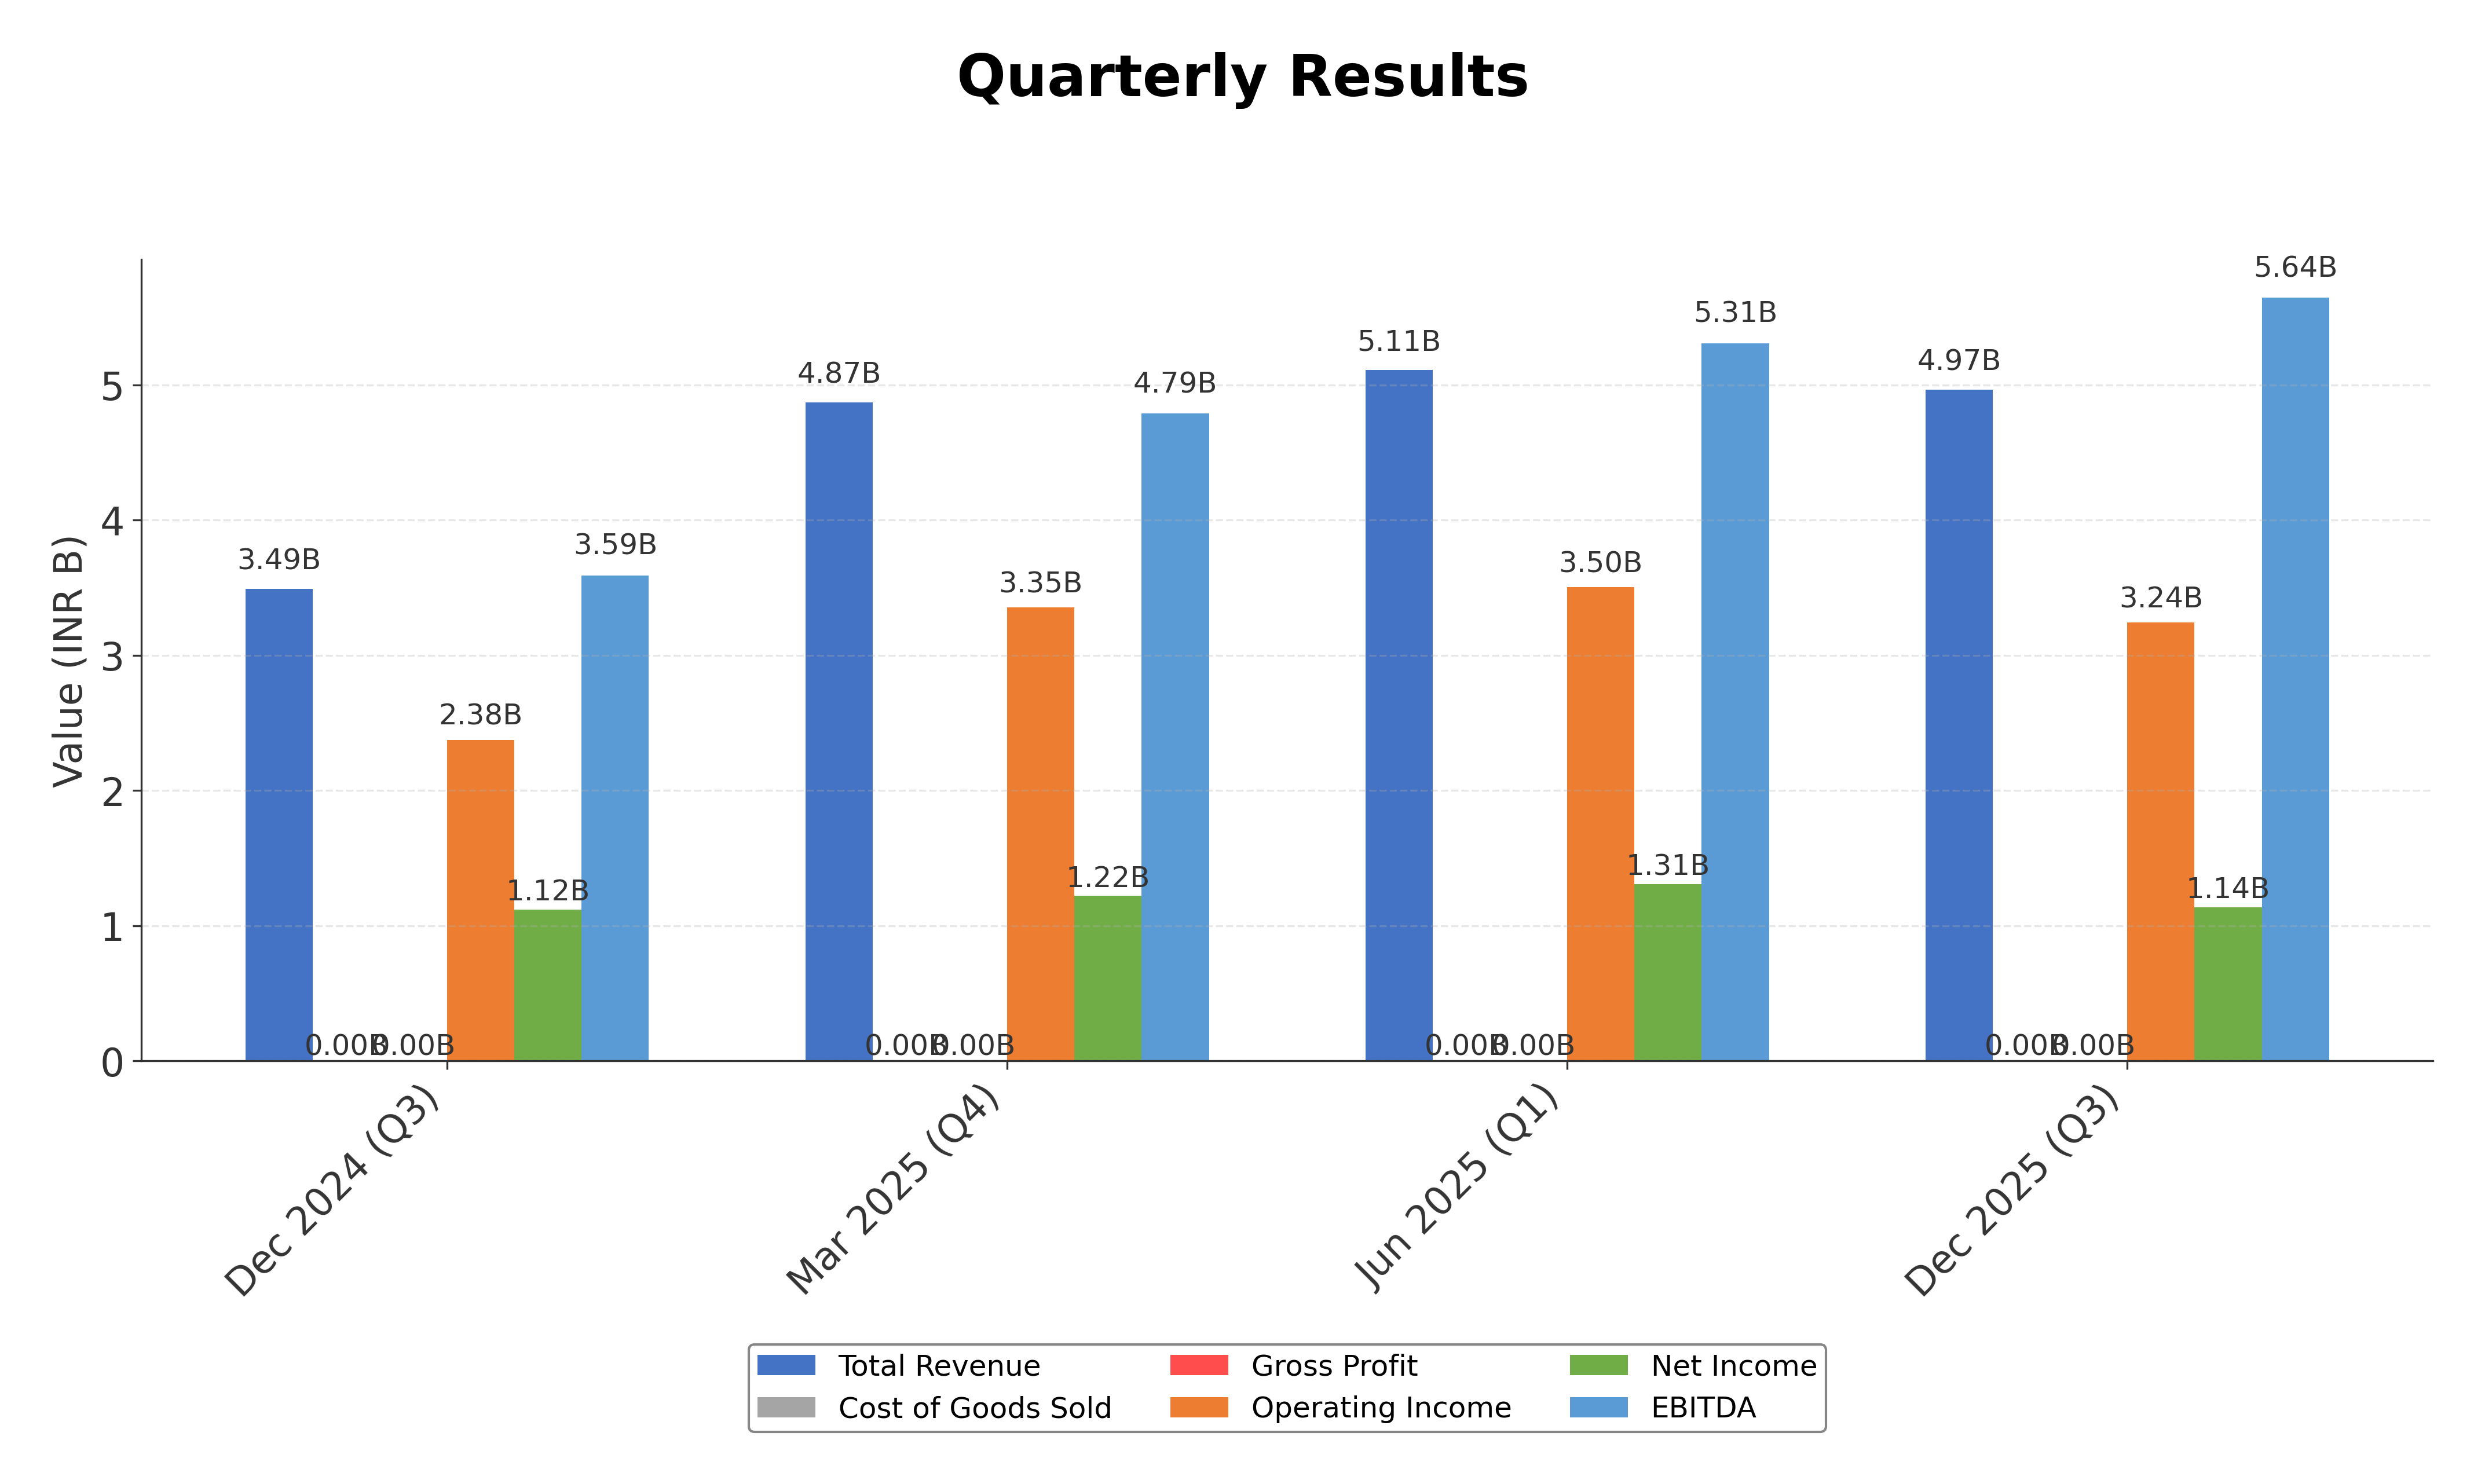
Growth Trajectory: The company demonstrates strong revenue growth of 42.3% quarter-over-quarter and positive earnings growth, supported by expanding PPA-backed capacity and project awards.
Financial Health: Despite a robust current ratio of 2.87 indicating liquidity strength, the company carries a high debt-to-equity ratio of 271.78, which may pose leverage risks; operating cash flow remains solid at ₹12.31 billion.
Sector Specific Factors: The renewable energy sector in India benefits from supportive regulatory policies and increasing demand for clean energy, though challenges include capital intensity and tariff pressures.
Market Positioning: Acme Solar holds a competitive position within the Indian renewable utilities sector, leveraging long-term PPAs and hybrid project developments to enhance revenue visibility.
Investment Conclusion
Supporting Factors: Strong revenue growth of 42.3% and expanding PPA-backed capacity support growth prospects.
Risk Factors: High debt-to-equity ratio of 271.78 raises concerns about financial leverage and interest obligations.
SWOT Analysis
Strengths
- Strong operating margin of 65.28% indicating operational efficiency.
- Robust revenue growth of 42.3% quarter-over-quarter.
- Long-term power purchase agreements securing steady revenue streams.
- Solid liquidity position with a current ratio of 2.87.
Weaknesses
- High debt-to-equity ratio of 271.78 indicating significant leverage.
- Moderate return on equity at 5.59% limiting shareholder returns.
- Relatively low insider ownership at 0.84%, potentially affecting governance influence.
- Limited dividend yield of 0.086% reducing income appeal.
Opportunities
- Expansion in hybrid wind-solar projects increasing capacity and diversification.
- Supportive regulatory environment for renewable energy in India.
- Growing demand for clean energy driven by government and corporate initiatives.
- Potential for technological advancements in battery energy storage systems.
Threats
- Market volatility and tariff pressures impacting project profitability.
- High financial leverage increasing vulnerability to interest rate changes.
- Competitive pressures from larger renewable energy firms with greater scale.
- Regulatory changes or delays affecting project approvals and execution.
Company Description
Acme Solar Holdings Ltd. is a prominent player in the renewable energy sector, focusing on the development, construction, and maintenance of solar power projects. The primary function of Acme Solar is to harness solar energy to generate electricity, contributing to sustainable development and decreasing reliance on fossil fuels. By operating in the solar energy industry, it significantly impacts the energy, environmental, and infrastructure sectors. Acme Solar supports government and corporate initiatives to reduce carbon footprints and promote clean energy solutions. The company's projects can be found across various geographic locations, underlining its commitment to expanding its solar footprint. Acme Solar also engages in long-term power purchase agreements with government bodies and private entities, ensuring a steady revenue stream while supporting global and local energy needs. As a leader in renewable energy, Acme Solar Holdings Ltd. plays a critical role in the transition towards a greener, more sustainable future, positioning itself as an essential entity in the fight against climate change.