
Aarti Pharmalabs Ltd (AARTIPHARM)
Stock Analysis Report
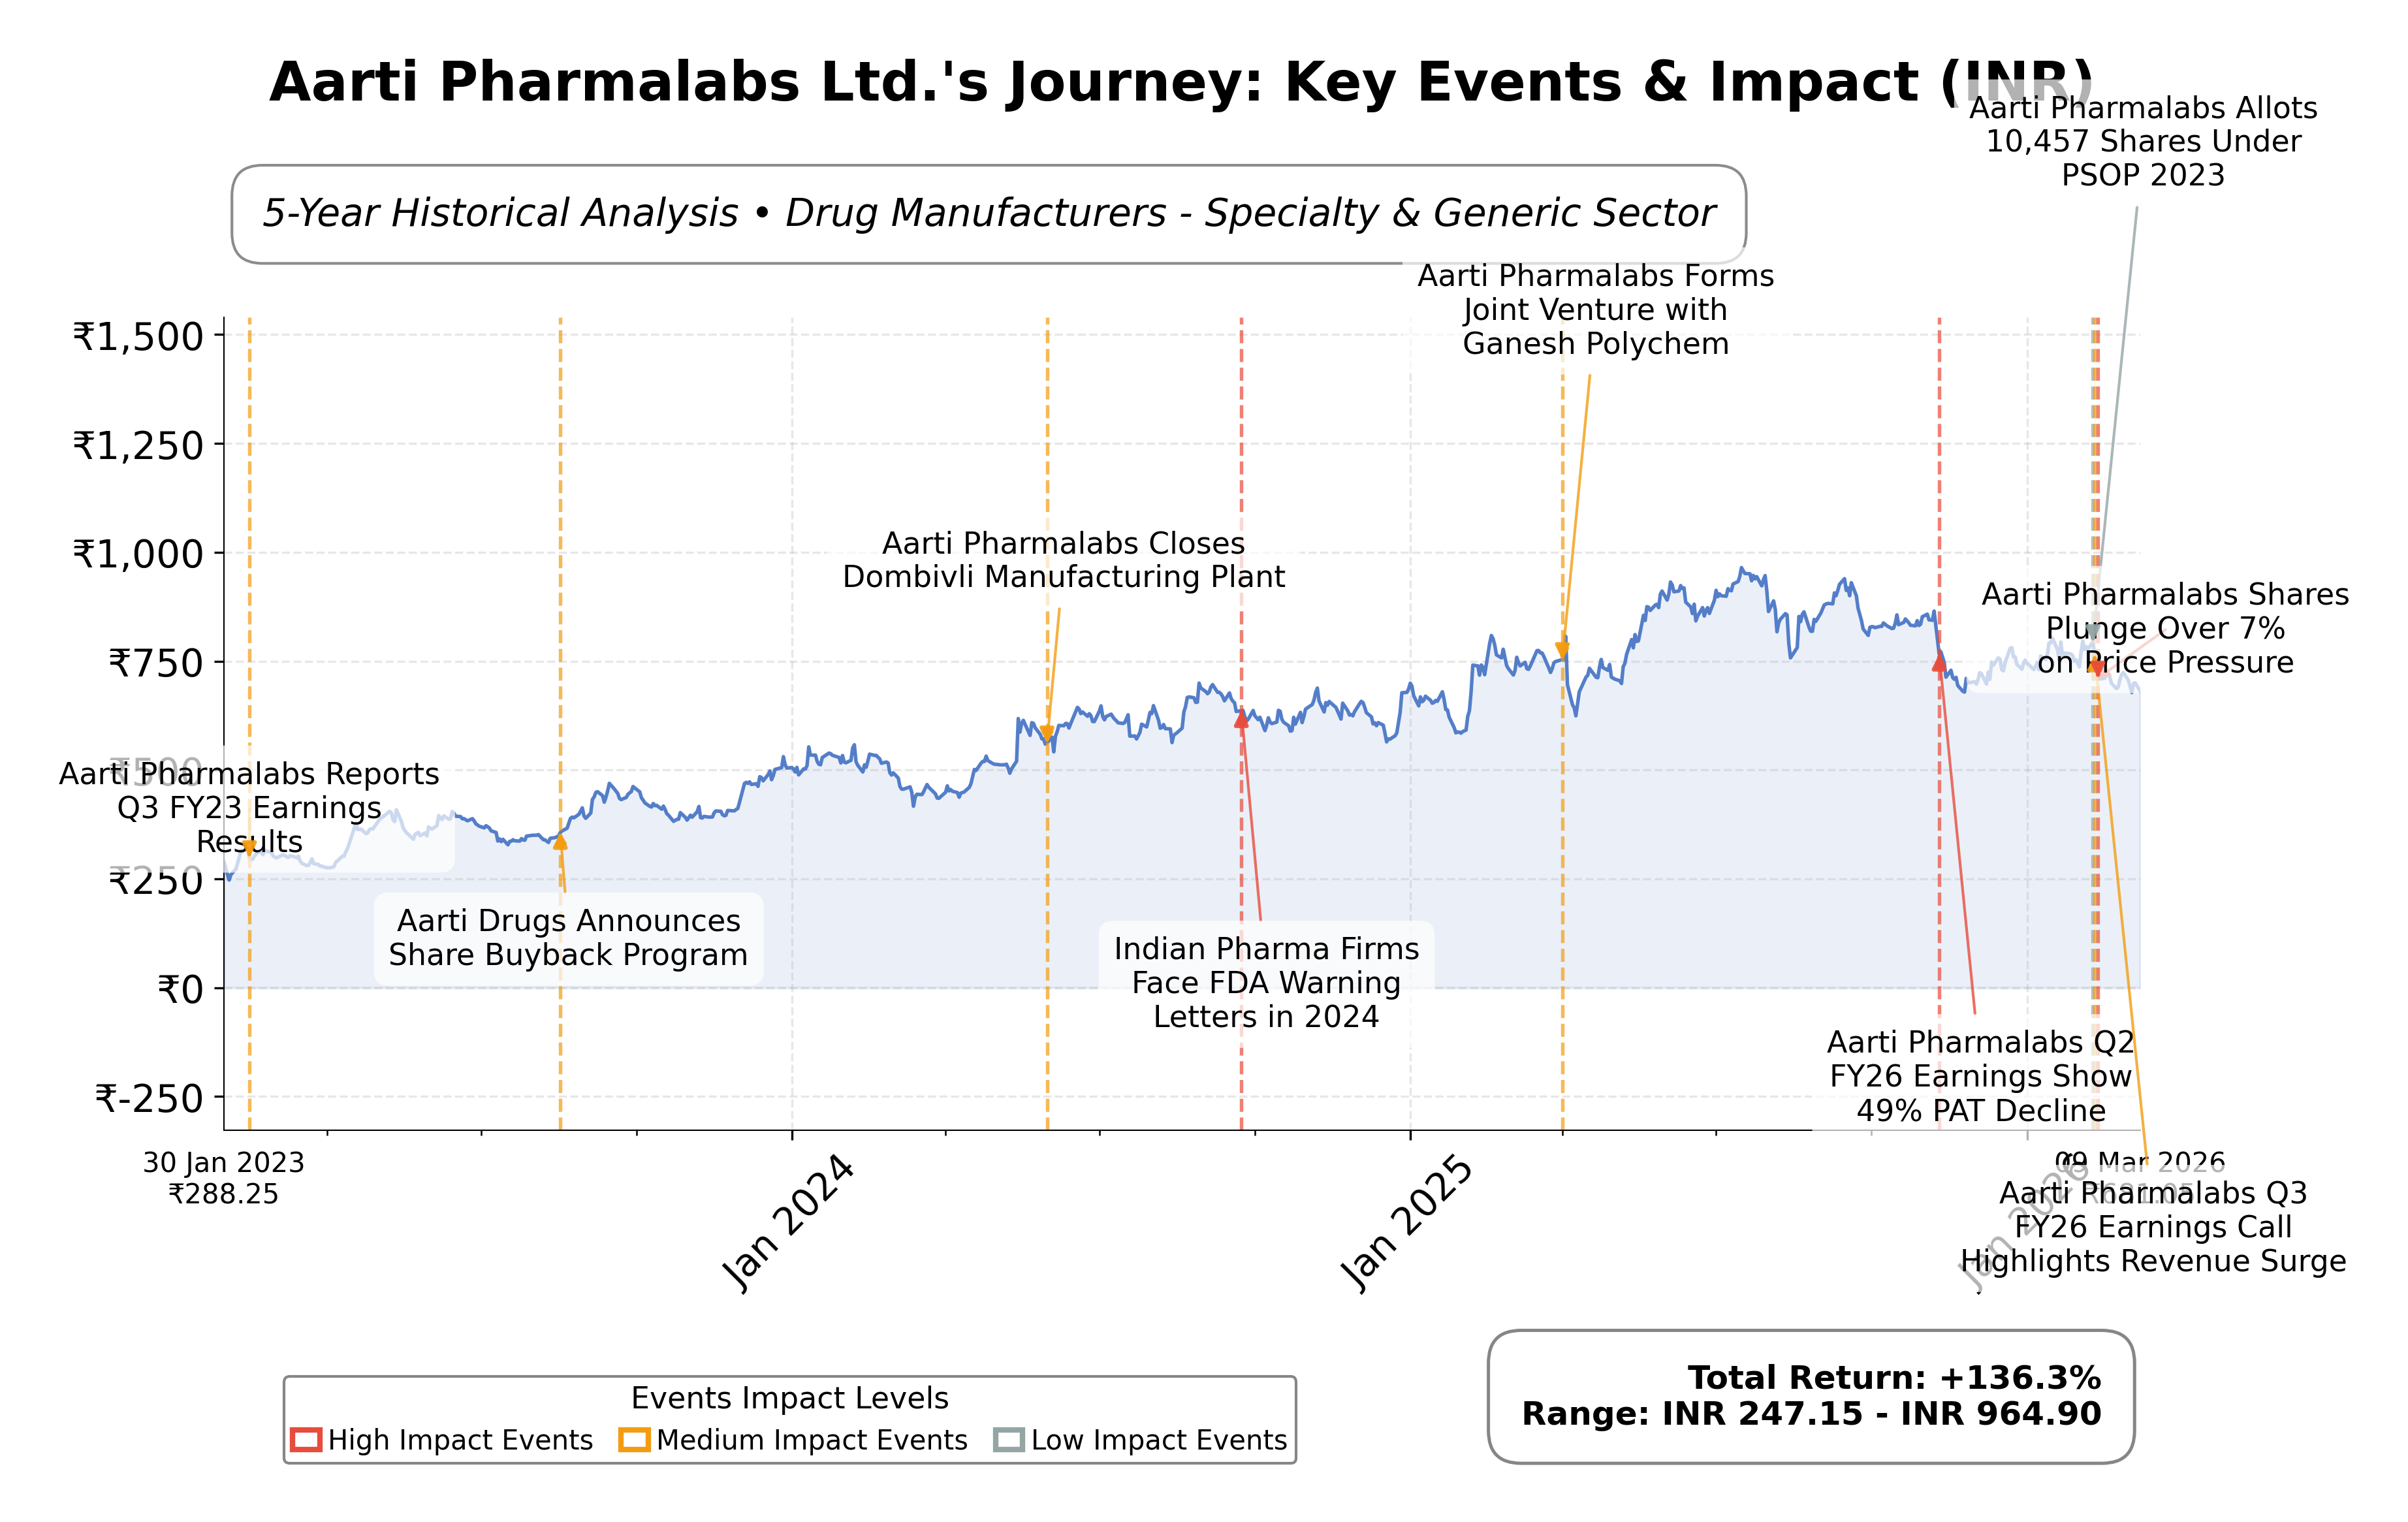
Stock Journey
Key Positives and Key Risks
Pros
- Gross margin of 60.06% indicates strong operational efficiency supporting profitability.
- Return on equity of 13.69% reflects competitive profitability relative to industry peers.
- Operating cash flow of ₹3.51 billion demonstrates solid cash generation capacity.
Cons
- Quarterly revenue growth declined by 19.6%, signaling near-term growth challenges.
- Debt-to-equity ratio of 33.0 suggests elevated financial leverage and potential risk.
- Bearish technical indicators and recent downgrade to Strong Sell highlight market caution.
Disclosure: This information is for general awareness and does not constitute investment advice
Report Summary
Aarti Pharmalabs Ltd. operates as an integrated pharmaceutical company specializing in the development and production of active pharmaceutical ingredients (APIs). Positioned within the Drug Manufacturers - Specialty & Generic industry, the company supports the pharmaceutical sector by supplying critical ingredients essential for the formulation of generic and branded medicines. Its operations contribute significantly to the healthcare supply chain, leveraging advanced technology and compliance with stringent regulatory standards to maintain a trusted global presence.
Financially, Aarti Pharmalabs reports a market capitalization of approximately â¹62.35 billion and an enterprise value near â¹67.93 billion. The trailing price-to-earnings (P/E) ratio stands at 28.94, aligning with the industry average, while the price-to-book ratio is 3.02. The company posted a trailing twelve months (TTM) revenue of â¹18.01 billion with a gross margin of 60.06% and a profit margin of 11.87%. Return on equity (ROE) is reported at 13.69%, and operating cash flow totals â¹3.51 billion, reflecting moderate profitability and operational efficiency. The stock price currently trades at â¹686.70, within a 52-week range of â¹574.45 to â¹971, indicating a downside risk of 29.31% from the 52-week high.
From a technical perspective, the stock exhibits bearish momentum with recent price action showing a gap down and trading below the 50-day and 200-day moving averages. Key support and resistance levels are evident near â¹575 and â¹815 respectively. Leadership and strategic initiatives include ongoing recruitment drives to support manufacturing and quality control functions, reflecting operational scaling efforts. Notable risks include recent earnings volatility with quarterly revenue and earnings declines year-over-year, alongside a relatively high debt-to-equity ratio of 33.0, which may impact financial flexibility.
In comparison to its Indian pharmaceutical peers such as Dr. Reddy's Laboratories, Natco Pharma, Abbott India, Aurobindo Pharma, and Granules India, Aarti Pharmalabs maintains a smaller market capitalization and higher valuation multiples on P/E and EV/EBITDA metrics. While its ROE of 13.69% is competitive, peers like Natco Pharma and Abbott India demonstrate stronger profitability and lower valuation ratios, suggesting varied operational efficiencies and market perceptions within the sector.
Aarti Pharmalabs stands as a key player navigating the competitive pharmaceutical ingredient manufacturing landscape in India. Recent achievements include revenue growth and dividend declarations, while challenges such as margin compression and technical bearish signals persist. The company faces pivotal moments related to operational scaling, financial management, and market positioning. The stakes involve balancing growth initiatives against profitability pressures and market sentiment. Given the current data, a measured approach emphasizing observation of financial trends and technical developments may be appropriate for those assessing the stockâs trajectory.
Company and Industry Overview
Company Basics
Price Performance
Company Size
Shareholding Pattern
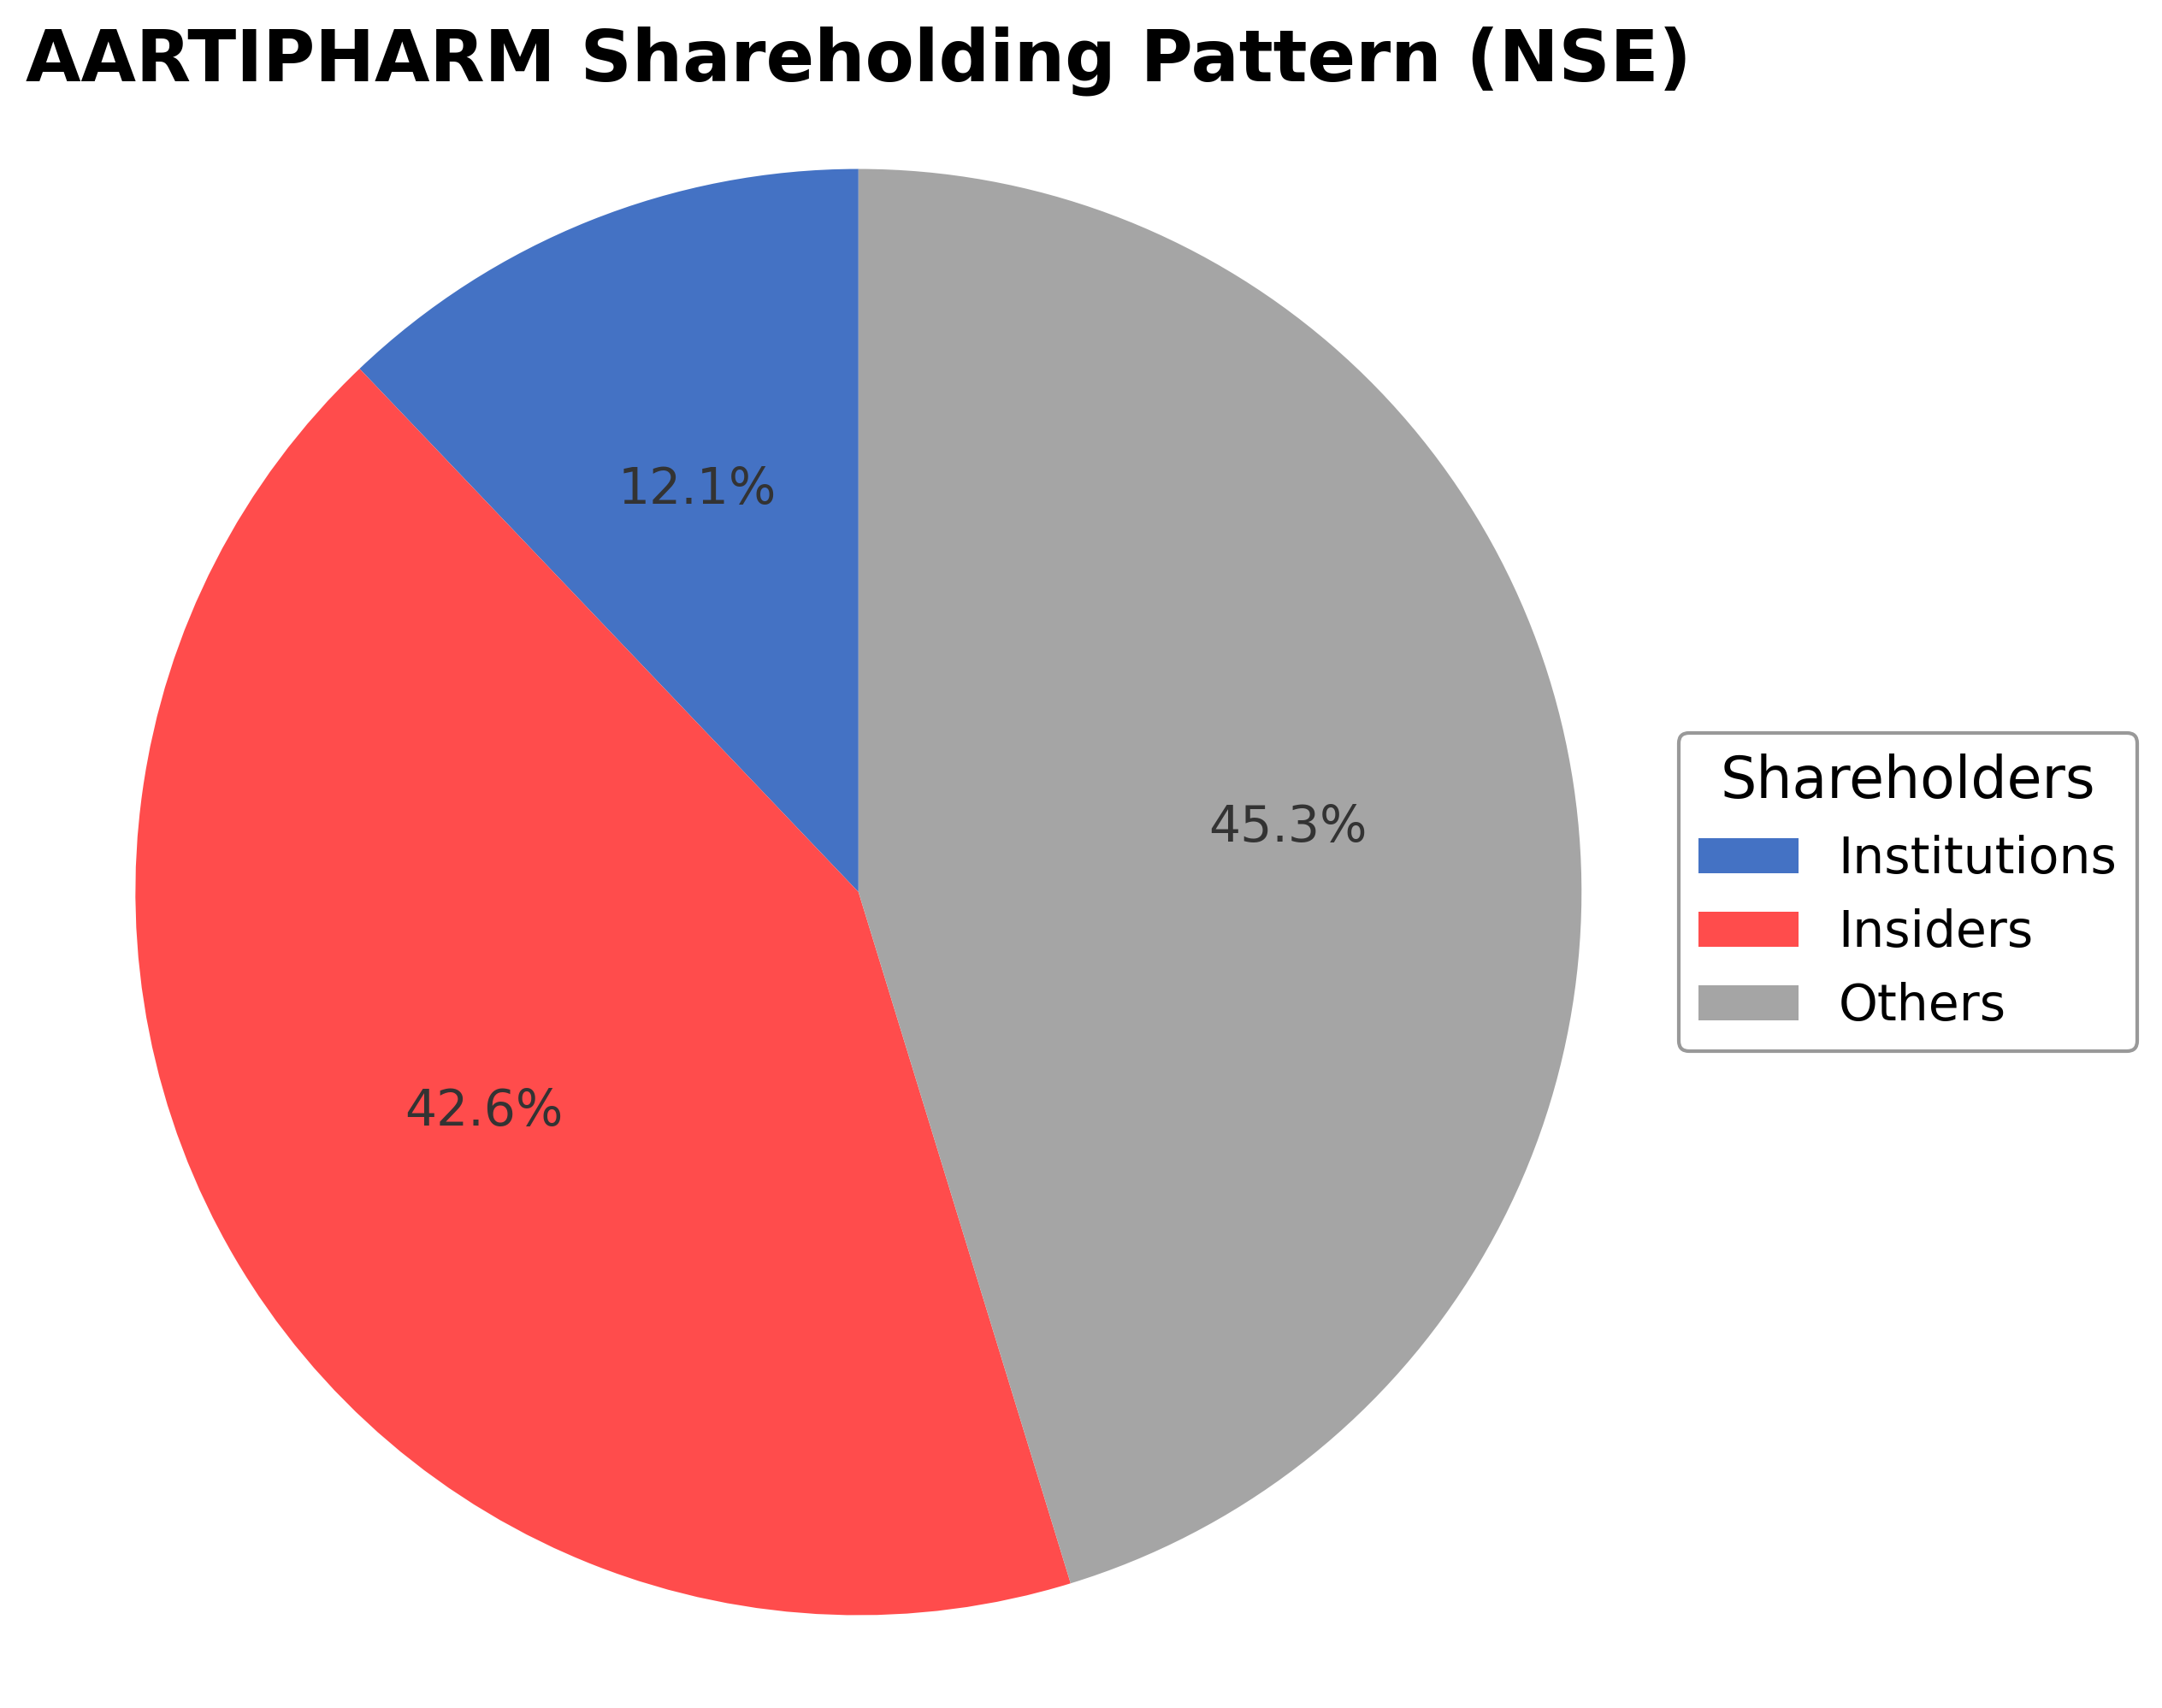
The shareholding structure of Aarti Pharmalabs Ltd. comprises approximately 42.62% held by insiders including executives and board members, 12.12% by institutional investors such as mutual funds and asset managers, and the remaining 45.26% by public shareholders including retail investors and employee stock plans. Over the past 12 to 24 months, institutional ownership has shown moderate activity with some accumulation by key funds, reflecting cautious market sentiment. The significant promoter holding underscores strong governance influence, while institutional participation suggests measured confidence in the company's strategic direction. This ownership distribution may impact future corporate decisions and reflects a balanced market perception within the pharmaceutical manufacturing sector.
Sector and Industry Analysis
Aarti Pharmalabs Ltd. (AARTIPHARM) operates within the broader pharmaceutical sector, a critical and expansive segment of the global healthcare industry. The pharmaceutical sector is characterized by substantial market size, driven by increasing global demand for innovative and generic medicines, rising prevalence of chronic diseases, and expanding healthcare infrastructure, particularly in emerging markets like India. Globally, the pharmaceutical market is projected to grow at a CAGR of approximately 6-8% over the next five years, supported by demographic shifts such as aging populations and increased healthcare access. Key players in this sector range from multinational pharmaceutical giants to specialized contract manufacturing organizations (CMOs) and active pharmaceutical ingredient (API) producers, with Indian companies like Aarti Pharmalabs gaining prominence due to cost advantages and regulatory compliance.
Within the pharmaceutical sector, the specialty chemicals and API manufacturing industry—where Aarti Pharmalabs is positioned—has witnessed significant evolution. Industry trends include a shift towards complex and high-potency APIs, increased outsourcing by global pharmaceutical companies to reduce costs and improve efficiency, and adoption of advanced manufacturing technologies such as continuous processing and green chemistry. Consumer behavior is indirectly influential, with end-market demand for affordable and high-quality medicines driving API manufacturers to enhance product portfolios and ensure supply chain robustness. Emerging opportunities lie in biosimilars, niche APIs for oncology and cardiovascular treatments, and expansion into regulated markets like the US and Europe, which require stringent quality standards.
The regulatory landscape for pharmaceutical and API manufacturers is stringent and multifaceted, encompassing compliance with Good Manufacturing Practices (GMP), environmental regulations, and intellectual property laws. Regulatory authorities such as the US FDA, EMA, and India’s CDSCO impose rigorous inspections and certifications, which act as both compliance requirements and competitive differentiators. Recent policy initiatives in India, including the Production Linked Incentive (PLI) scheme for pharmaceuticals, aim to boost domestic manufacturing capabilities and reduce import dependence. Environmental regulations are increasingly impactful, requiring companies to adopt sustainable manufacturing processes and manage hazardous waste effectively, which can raise operational costs but also create barriers to entry.
Competitive dynamics in the pharmaceutical API and specialty chemicals industry are shaped by moderate to high entry barriers, including capital-intensive manufacturing facilities, regulatory approvals, and the need for technical expertise. The market structure is moderately consolidated, with a mix of large integrated players and smaller niche manufacturers. Companies like Aarti Pharmalabs leverage scale, backward integration, and regulatory certifications to maintain competitive positioning. Price competition is intense, especially in commoditized APIs, but differentiation through product quality, customer relationships, and compliance track record is critical. Supply chain resilience and the ability to innovate in process chemistry also serve as key competitive advantages in this dynamic industry environment.
Note: Analysis synthesized from industry research, market reports, and regulatory filings. Information is subject to change based on market conditions.
Illustrative Scenario Analysis
DCF Assumptions:
Method: Two-Stage EPS-Priority Model
Financials
Peer Analysis
| Company Name | Market Cap | P/E Ratio | P/B Ratio | EV/EBITDA | Price to CFO |
|---|---|---|---|---|---|
| Aarti Pharmalabs Ltd. | ₹62.35B | 28.94 | 3.02 | 16.90 | 17.75 |
| Dr. Reddy's Laboratories Ltd. | ₹1.09T | 19.34 | 2.92 | 12.67 | 17.20 |
| Natco Pharma Ltd. | ₹182.74B | 11.51 | 2.07 | 8.40 | 9.49 |
| Abbott India Ltd. | ₹580.64B | 38.17 | 14.48 | 31.07 | 43.45 |
| Aurobindo Pharma Ltd. | ₹715.49B | 20.51 | 2.04 | 10.54 | 17.25 |
| Granules India Ltd. | ₹140.06B | 25.68 | 3.52 | 14.79 | 18.52 |
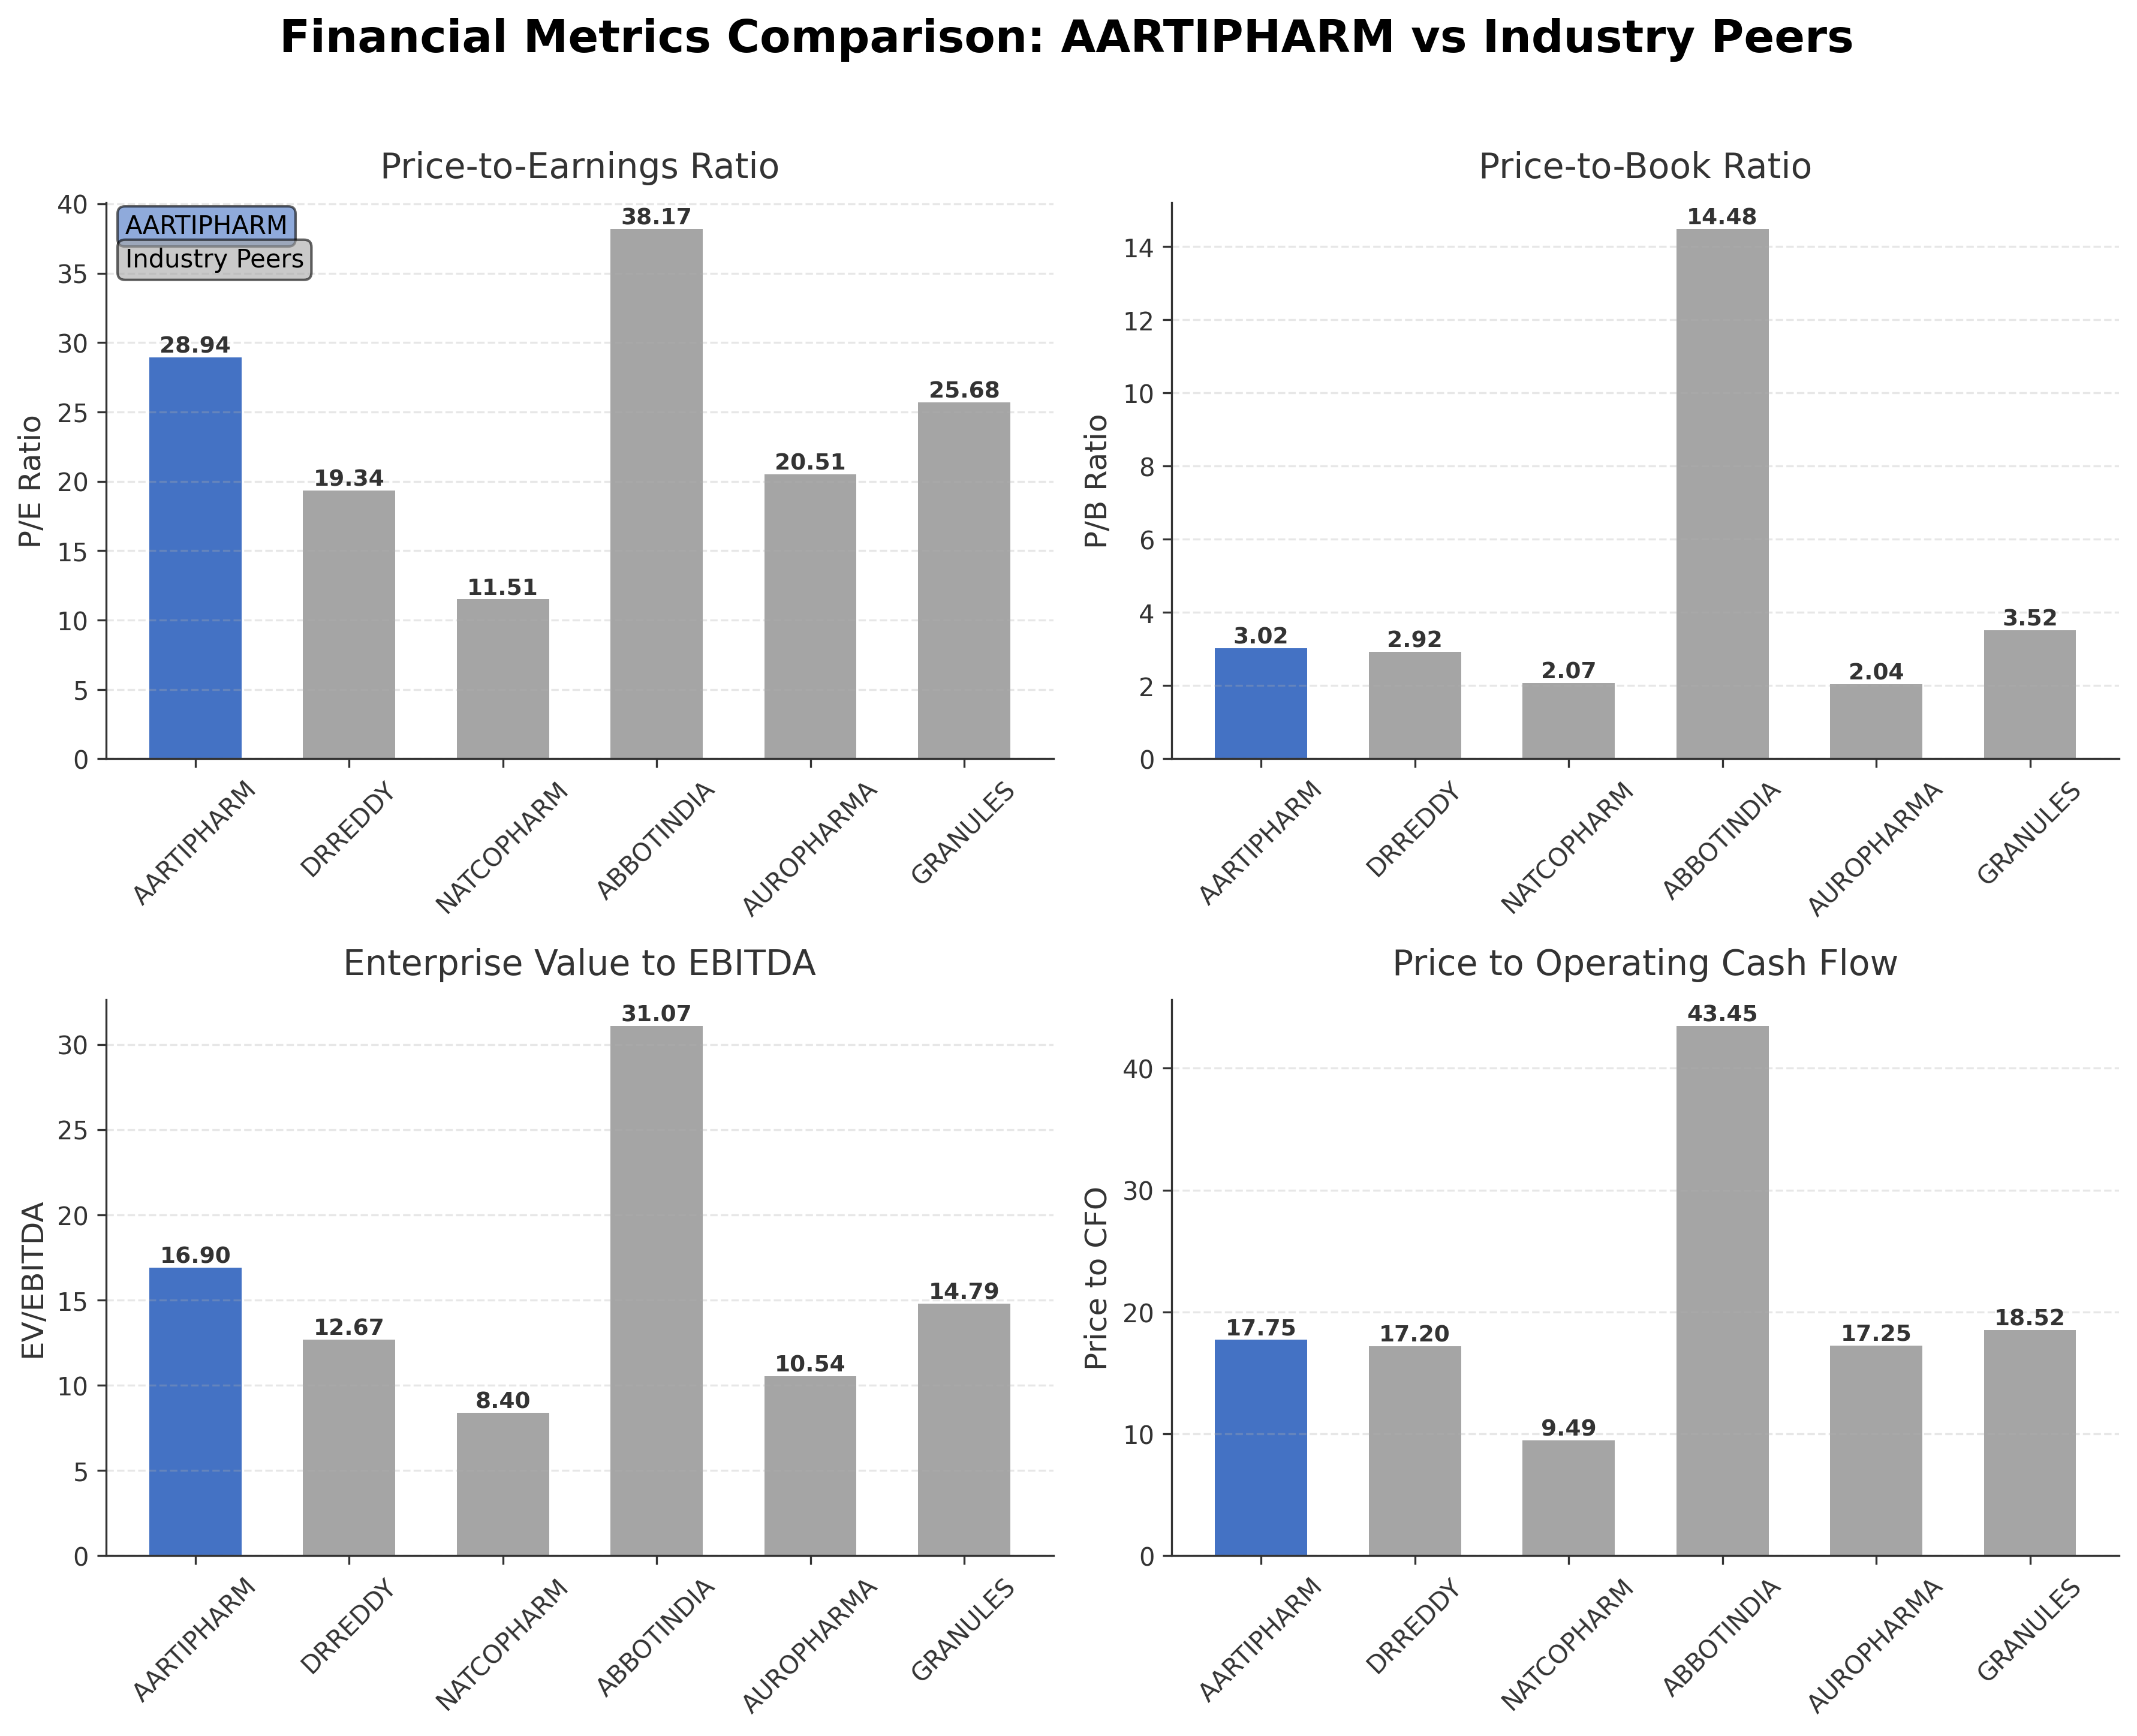
Comparison Analysis: Aarti Pharmalabs Ltd. exhibits a moderate market capitalization relative to its Indian pharmaceutical peers, with a P/E ratio of 28.94 that is higher than several competitors such as Natco Pharma (11.51) and Aurobindo Pharma (20.51), but lower than Abbott India (38.17). Its price-to-book ratio of 3.02 is comparable to Granules India (3.52) but notably lower than Abbott India’s elevated 14.48. The EV/EBITDA multiple of 16.90 suggests a relatively higher valuation compared to peers like Natco Pharma (8.40) and Aurobindo Pharma (10.54). Return on equity at 13.69% is competitive but trails behind Natco Pharma and Abbott India, indicating room for improvement in profitability. Overall, Aarti Pharmalabs holds a middle ground in valuation and performance metrics within its regional industry peer group.
Financial Metrics Comparison with Peers
Financial Statements
Comprehensive financial data including income, balance sheet, and cash flow metrics
Income Statement
| fiscal_date | 2025-03-31 | 2024-03-31 | 2023-03-31 | 2022-03-31 | 2021-03-31 |
|---|---|---|---|---|---|
| Sales | 20.86B | 18.16B | 19.36B | 11.92B | 0.00 |
| Cost Of Goods | 12.18B | 11.15B | 12.54B | 8.80B | 0.00 |
| Gross Profit | 8.68B | 7.01B | 6.82B | 3.12B | 0.00 |
| Operating Expense Research And Development | 328.32M | 83.70M | 139.60M | N/A | N/A |
| Operating Expense Selling General And Administrative | 947.22M | 803.59M | 881.93M | 276.45M | 46.00K |
| Operating Expense Other Operating Expenses | 942.53M | 833.91M | 813.80M | 644.35K | 3.96K |
| Operating Income | 3.77B | 3.13B | 2.80B | 1.65B | -46.00K |
| Non Operating Interest Income | 70.96M | 30.42M | 9.37M | 57.00K | 0.00 |
| Non Operating Interest Expense | 268.96M | 172.15M | 210.52M | 3.40M | 0.00 |
| Pretax Income | 3.61B | 3.00B | 2.61B | 1.55B | -46.00K |
| Income Tax | 882.85M | 835.90M | 672.81M | 331.29M | 0.00 |
| Net Income | 2.72B | 2.17B | 1.93B | 1.22B | -46.00K |
| Eps Basic | 30.06 | 23.93 | 21.35 | 13.49 | -0.00 |
| Eps Diluted | 30.04 | 23.93 | 21.35 | 13.49 | -0.00 |
| Basic Shares Outstanding | 90.63M | 90.63M | 90.63M | 90.63M | 90.63M |
| Diluted Shares Outstanding | 90.63M | 90.63M | 90.63M | 90.63M | 90.63M |
| Ebit | 3.88B | 3.18B | 2.82B | 1.56B | -46.00K |
| Ebitda | 4.73B | 3.90B | 3.44B | 1.98B | -46.00K |
| Net Income Continuous Operations | 3.61B | 3.00B | 2.61B | 1.55B | -46.00K |
| Preferred Stock Dividends | 0.00 | 0.00 | 0.00 | 0.00 | 0.00 |
| Minority Interests | N/A | N/A | 0.00 | N/A | N/A |
Data provided by Twelve Data
Balance Sheet
| fiscal_date | 2025-03-31 | 2024-03-31 | 2023-03-31 | 2022-03-31 | 2021-12-31 |
|---|---|---|---|---|---|
| Cash And Cash Equivalents | 67.34M | 236.35M | 121.21M | 832.73M | 1.13B |
| Accounts Receivable | 5.75B | 5.19B | 4.50B | 3.77B | 35.52M |
| Total Assets | 29.06B | 25.82B | 22.44B | 20.40B | N/A |
| Total Liabilities | 9.16B | 8.25B | 6.86B | 6.53B | 164.23M |
| Long Term Debt | 1.23B | 166.98M | 7.15M | 20.87M | 17.98M |
| Shareholders Equity | 19.90B | 17.57B | 15.58B | 13.86B | 827.07M |
Data provided by Twelve Data
Cash Flow Statement
| fiscal_date | 2025-03-31 | 2024-03-31 | 2023-03-31 | 2022-03-31 | 2021-03-31 |
|---|---|---|---|---|---|
| Operating Activities Net Income | 3.61B | 3.00B | 2.61B | 1.55B | -46.00K |
| Operating Activities Other Non Cash Items | 198.00M | 141.73M | 201.14M | 128.08M | N/A |
| Operating Activities Accounts Receivable | -844.33M | -1.26B | -351.72M | -1.03B | 46.00K |
| Operating Activities Other Assets Liabilities | 552.79M | -396.64M | -1.27B | -560.18M | 45.96K |
| Operating Activities Operating Cash Flow | 3.51B | 1.49B | 1.19B | 96.62M | 45.96K |
| Investing Activities Capital Expenditures | -4.02B | -1.56B | -1.02B | -1.41B | 0.00 |
| Investing Activities Net Intangibles | -418.41M | -431.81M | -175.29M | N/A | N/A |
| Investing Activities Sale Of Investments | 228.34M | 5.51M | N/A | 401.00K | 0.00 |
| Investing Activities Other Investing Activity | 1.00K | 5.40M | -1.00K | 300.00K | N/A |
| Investing Activities Investing Cash Flow | -3.79B | -1.74B | -1.41B | -1.41B | 0.00 |
| Financing Activities Long Term Debt Issuance | 1.00B | N/A | N/A | N/A | N/A |
| Financing Activities Short Term Debt Issuance | 278.61M | 499.94M | -1.24B | 2.72B | 0.00 |
| Financing Activities Common Stock Issuance | 43.00K | N/A | N/A | N/A | N/A |
| Financing Activities Common Dividends | -317.19M | -181.25M | -181.25M | N/A | N/A |
| Financing Activities Financing Cash Flow | 961.46M | 318.68M | -1.42B | 2.72B | 0.00 |
| End Cash Position | 67.34M | 236.35M | 121.21M | 832.73M | 2.50M |
| Free Cash Flow | -1.12B | 175.69M | 1.30B | -1.85B | 0.00 |
| Investing Activities Purchase Of Investments | N/A | -194.04M | -391.23M | -1.13M | 0.00 |
| Financing Activities Other Financing Charges | N/A | -1.00K | 100.00K | N/A | N/A |
Data provided by Twelve Data
Technical Analysis
Key Insights
- The current trend direction for Aarti Pharmalabs Ltd. indicates bearish momentum with recent price action showing a gap down and a transition from mildly bearish to more pronounced bearish signals.
- Key support levels are identified near ₹575, while resistance is observed around ₹815, corresponding closely to the 200-day moving average.
- The stock is trading below its 50-day moving average of ₹744.15 and 200-day moving average of ₹815.01, indicating downward pressure.
- Momentum indicators such as RSI, MACD, and Stochastic suggest weakening momentum with bearish readings across multiple timeframes.
- Analysis across daily, weekly, and monthly charts consistently reflects a bearish technical setup, with short-term price declines and limited recovery signals.
- Potential market scenarios include continued downward pressure if support levels fail to hold, or consolidation if the stock stabilizes near current levels.
Trending News
1. Headline: Aarti Pharmalabs Walk-In Interview 2026 |Production, Process Engineering, QC, PD Lab, EHS, & QA Departments
Summary: Aarti Pharmalabs! Walk-in drive on 15th March 2026 at Ankleshwar for Production, QC, QA, and EHS roles. Same-day job offer letters provided.
Sentiment: neutral
Summary: Aarti Pharmalabs is conducting a walk-in drive to hire experienced professionals for multiple departments at their Atali manufacturing location. Candidates with experience in CDMO, API, intermediate and multi-product manufacturing industries are encouraged to attend the interview.
Sentiment: neutral
3. Headline: Aarti Pharmalabs Ltd Technical Momentum Shifts Amid Bearish Signals
Summary: Aarti Pharmalabs Ltd has experienced a notable shift in its technical momentum, with key indicators signalling a transition from mildly bearish to a more pronounced bearish trend. Despite a recent weekly price gain, the stock’s overall technical profile and market performance suggest caution ...
Sentiment: positive
4. Headline: Aarti Pharmalabs Ltd Downgraded to Strong Sell Amid Weak Financials and Bearish Technicals
Summary: Aarti Pharmalabs Ltd has been downgraded from a Sell to a Strong Sell rating as of 2 March 2026, reflecting deteriorating fundamentals and bearish technical indicators. The downgrade follows a comprehensive reassessment across four key parameters: Quality, Valuation, Financial Trend, and ...
Sentiment: negative
5. Headline: Aarti Pharmalabs Ltd Opens with Significant Gap Down Amid Market Concerns
Summary: Aarti Pharmalabs Ltd commenced trading today with a pronounced gap down, opening at a price 7.31% lower than its previous close, reflecting heightened market apprehension. The stock’s weak start follows a series of mixed technical signals and a downgrade in its Mojo Grade, contributing to ...
Sentiment: negative
6. Headline: Aarti Pharmalabs Ltd is Rated Sell
Summary: Aarti Pharmalabs Ltd is rated 'Sell' by MarketsMOJO, with this rating last updated on 12 January 2026. However, the analysis and financial metrics discussed below reflect the stock's current position as of 26 February 2026, providing investors with an up-to-date view of the company’s ...
Sentiment: neutral
Summary: Shares of Aarti Pharmalabs Ltd., Apollo Hospitals Enterprise Ltd., IIFL Capital Services Ltd., Kirloskar Ferrous Industries Ltd.will be of interest on Monday, as the day marks the last session for investors to buy shares to qualify for receiving the dividend before the stock goes ex/record-date.
Sentiment: neutral
8. Headline: Aarti Pharmalabs Ltd Hits Intraday Low Amidst Price Pressure on 12 Feb 2026
Summary: Aarti Pharmalabs Ltd experienced a significant intraday decline on 12 Feb 2026, touching a low of Rs 694.5, reflecting a sharp price pressure of -7.78% during the trading session. The stock underperformed its sector and broader market indices, continuing a downward trend over the past three days.
Sentiment: negative
9. Headline: Aarti Pharmalabs Ltd (BOM:543748) Q3 2026 Earnings Call Highlights: Revenue Surge Amidst Margin ...
Summary: Despite a significant revenue increase, Aarti Pharmalabs Ltd faces profitability challenges and project delays, yet remains optimistic about future growth.
Sentiment: positive
10. Headline: Aarti Pharmalabs Declares Dividend Amidst Mixed Results and Margin Squeeze
Summary: Aarti Pharmalabs announced a mixed financial performance for Q3 FY26, with standalone revenue leaping 261% YoY to ₹255.28 Cr, but net profit margins compressing to 17.17% from 43.72%. Consolidated revenue grew 19.86% YoY to ₹205.57 Cr. The company declared an interim dividend of ₹1.50 ...
Sentiment: positive
Powered by Brave
Recent Updates
News Summary
Recent news surrounding Aarti Pharmalabs Ltd. highlights a period of market caution and operational activity. The company experienced a notable gap down in trading, reflecting investor concerns amid bearish technical signals and a downgrade to a Strong Sell rating by MarketsMojo. Concurrently, Aarti Pharmalabs is actively recruiting to support production and quality functions, indicating efforts to scale operations. Dividend declarations and earnings call highlights reveal mixed financial results with revenue growth tempered by margin pressures. These developments suggest a complex environment where operational expansion coexists with financial and market challenges, impacting the company’s positioning and outlook within the pharmaceutical sector.
News Sentiment
The overall sentiment from recent news is mixed to negative, with bearish technical assessments and rating downgrades offset by positive operational initiatives such as recruitment drives and dividend announcements. Market reactions reflect caution, while company actions demonstrate a focus on sustaining growth and addressing profitability concerns. Sentiment trends indicate vigilance in monitoring financial performance and market dynamics.
Analytical Overview
Analysis Summary
Valuation Metrics: Aarti Pharmalabs' trailing P/E ratio of 28.94 aligns closely with the industry average of 28.94, suggesting valuation is in line with sector norms, though the negative PEG ratio indicates recent earnings growth challenges.
Growth Trajectory: Revenue growth shows a decline of 19.6% quarterly, and earnings growth is down 35.2% year-over-year, signaling near-term growth headwinds despite solid gross margins and operating cash flow generation.
Financial Health: The company maintains a current ratio of 1.64, indicating adequate liquidity, but a relatively high debt-to-equity ratio of 33.0 suggests leverage that could constrain financial flexibility under adverse conditions.
Sector Specific Factors: The pharmaceutical sector in India faces regulatory scrutiny and competitive pressures, with opportunities in generic drug manufacturing balanced against margin pressures and supply chain risks.
Market Positioning: Aarti Pharmalabs leverages technological capabilities and a significant promoter stake to maintain competitive positioning, though growth and profitability metrics suggest cautious monitoring of operational execution.
Investment Conclusion
Supporting Factors: Strong gross margin of 60.06% and positive operating cash flow of ₹3.51 billion support operational efficiency.
Risk Factors: Declining quarterly revenue and earnings growth highlight near-term performance challenges.
SWOT Analysis
Strengths
- The company maintains a strong gross margin of 60.06%.
- Robust operating cash flow of ₹3.51 billion supports liquidity.
- Significant promoter ownership at 42.62% ensures governance stability.
- Competitive return on equity at 13.69% reflects profitability.
Weaknesses
- Quarterly revenue growth declined by 19.6%, indicating near-term headwinds.
- High debt-to-equity ratio of 33.0 increases financial risk.
- Negative PEG ratio suggests earnings growth challenges.
- Stock trades below key moving averages, reflecting bearish momentum.
Opportunities
- Expansion through recruitment drives may enhance operational capacity.
- Growing demand for specialty and generic pharmaceutical ingredients in India.
- Potential to improve margins through operational efficiencies.
- Dividend payments may attract income-focused stakeholders.
Threats
- Regulatory pressures in the pharmaceutical sector could impact operations.
- Market sentiment is cautious due to recent technical downgrades.
- Competitive pressures from larger pharmaceutical peers.
- Volatility in raw material costs may affect profitability.
Company Description
Aarti Pharmalabs Ltd. is an integrated pharmaceutical company engaged in the development and production of active pharmaceutical ingredients. The primary function of the company is to support the pharmaceutical industry by providing high-quality ingredients that are critical for the formulation of a wide range of medicines. Aarti Pharmalabs Ltd. plays a significant role in the healthcare and pharmaceutical sectors by supplying essential ingredients that aid in the manufacture of generic and branded medications. Its operations are vital for ensuring a reliable supply chain in the production of drugs that address various medical conditions, thereby contributing to public health and safety. The company employs state-of-the-art technology and adheres to stringent regulatory standards, reinforcing its position as a trusted partner for pharmaceutical companies around the globe. As such, Aarti Pharmalabs Ltd. is a significant participant in the global pharmaceutical supply chain, consistently innovating to meet the evolving needs of the industry.