
Aarti Industries Ltd (AARTIIND)
Stock Analysis Report
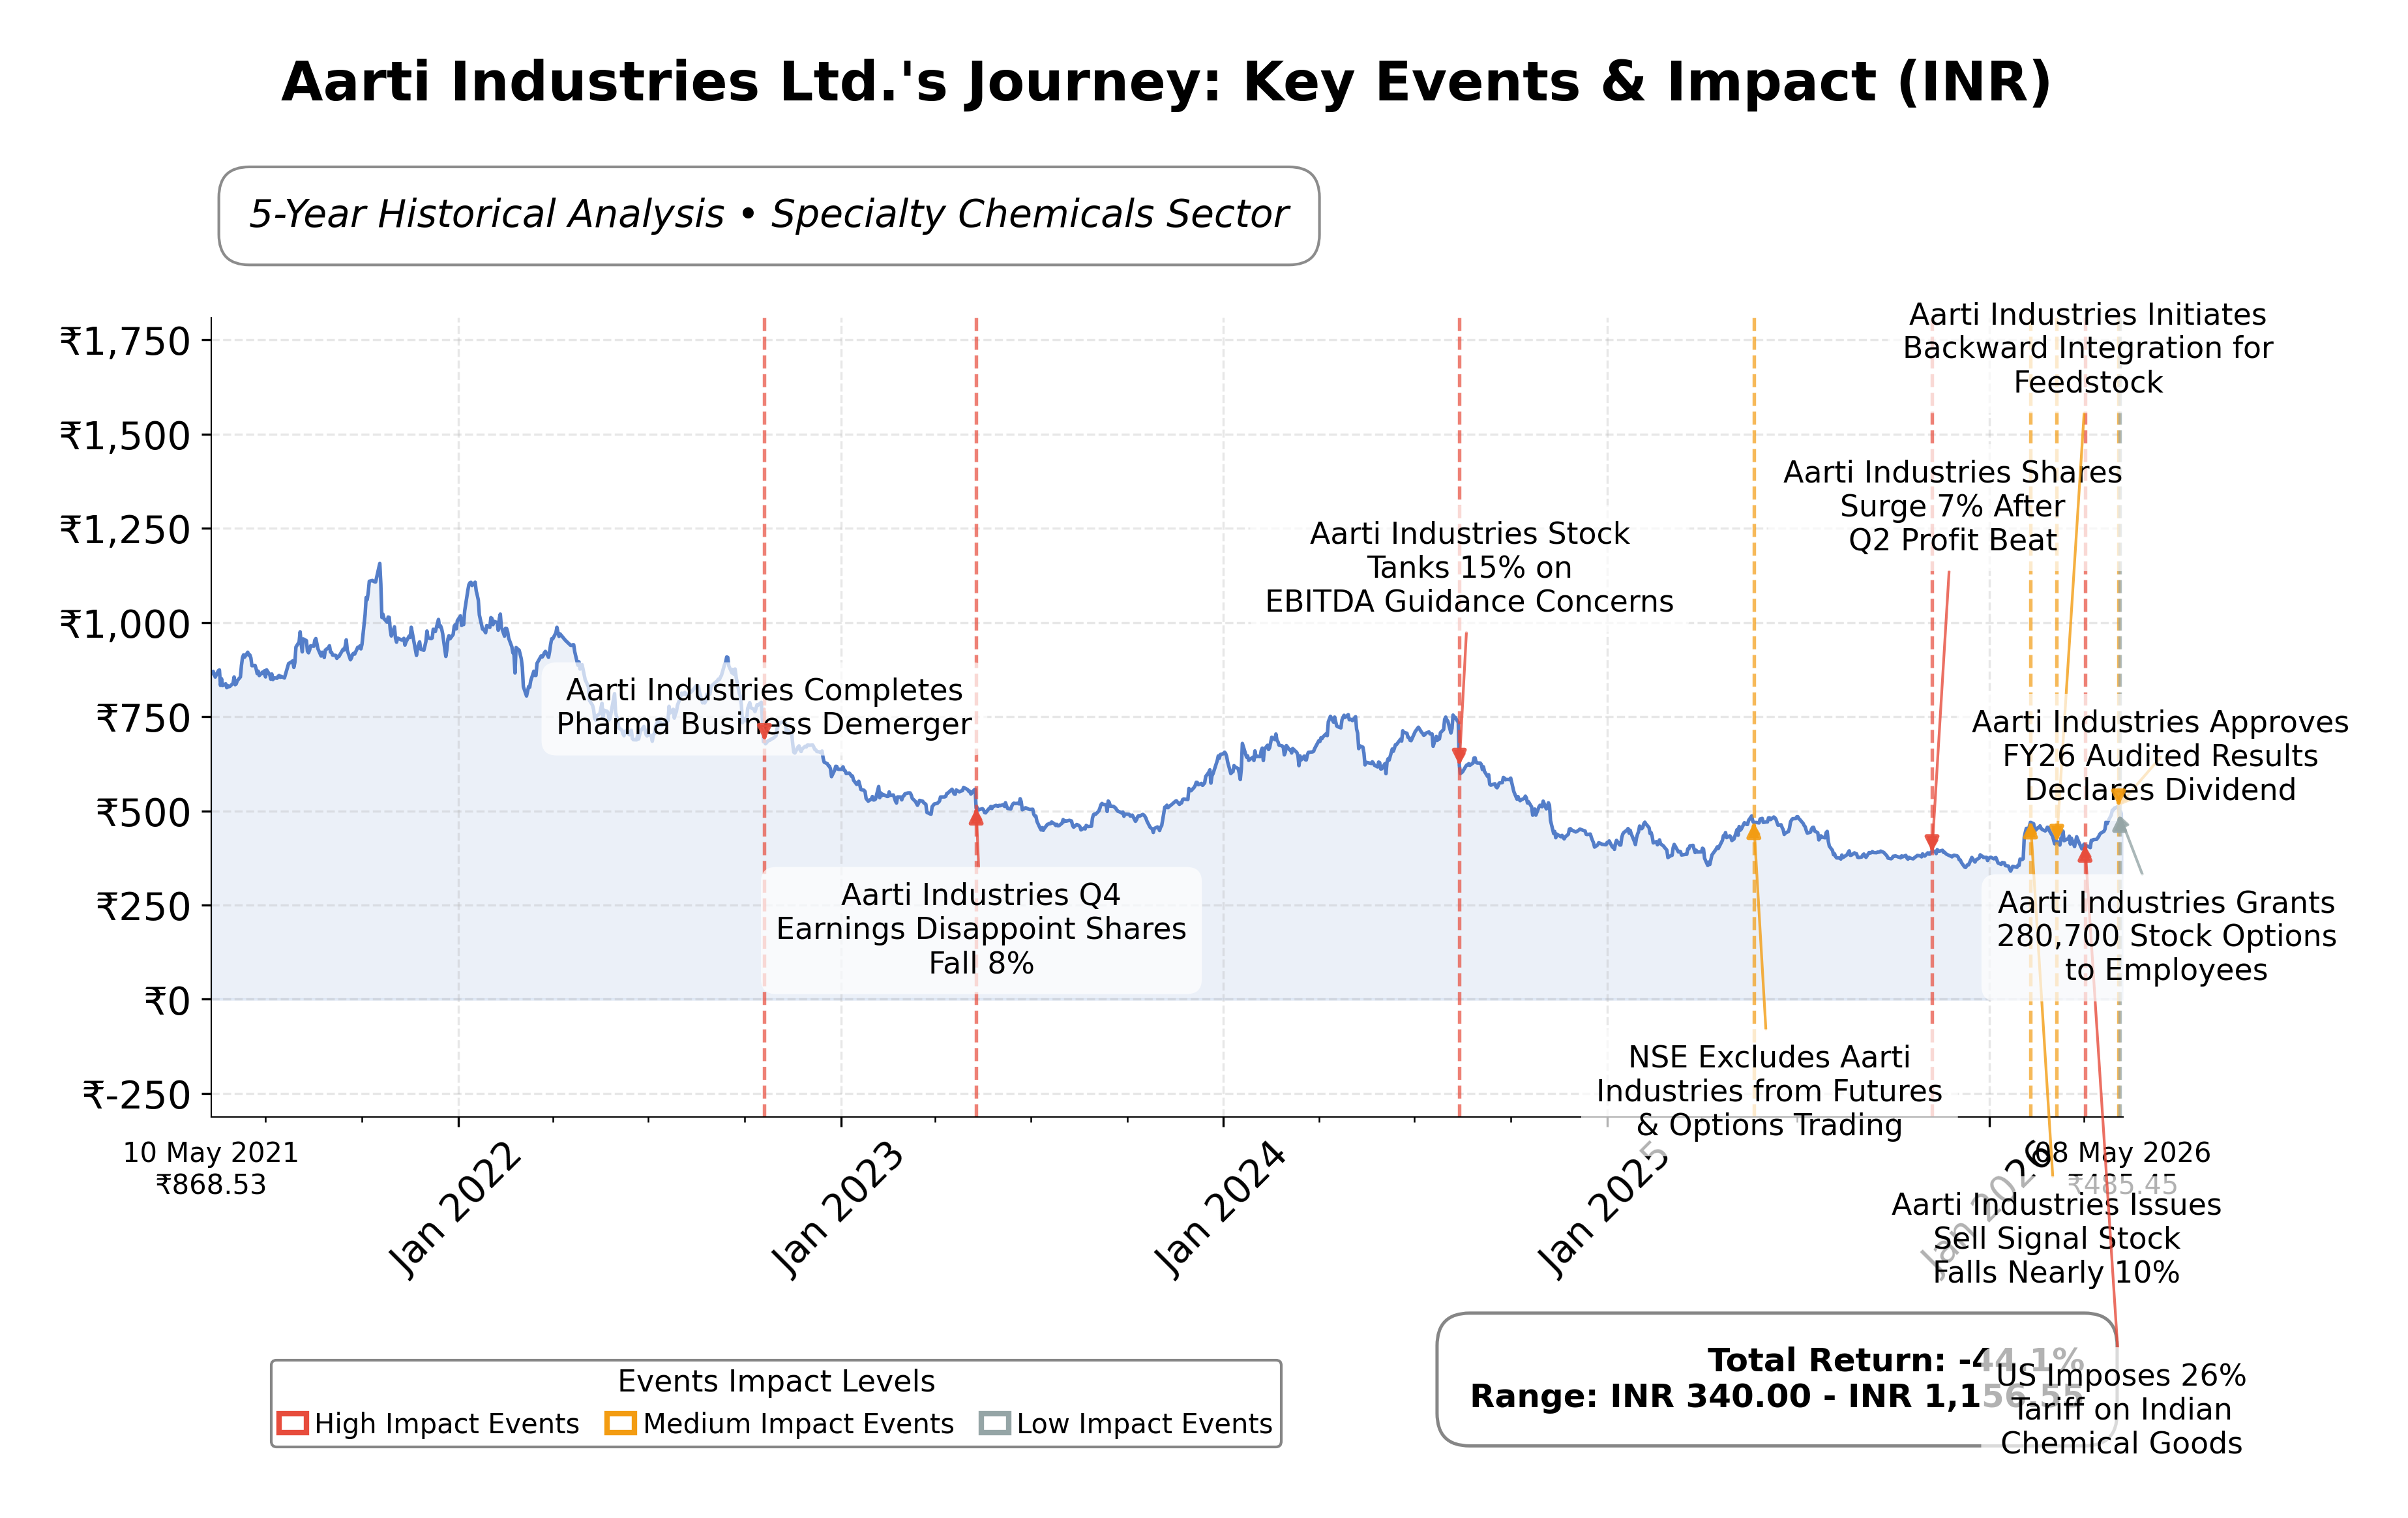
Stock Journey
Key Positives and Key Risks
Pros
- Revenue growth of 26% quarterly and 12% annually demonstrates strong top-line expansion.
- Operating cash flow of ₹2.91 billion and free cash flow of ₹3.31 billion indicate solid cash generation.
- Strategic contract wins and global positioning enhance competitive advantage.
Cons
- High trailing P/E ratio of 48.75 and forward P/E of 32.27 suggest premium valuation.
- Current ratio of 0.83 indicates potential short-term liquidity challenges.
- Profit margin of 4.71% and ROE of 5.9% reflect moderate profitability relative to peers.
Disclosure: This information is for general awareness and does not constitute investment advice
Report Summary
Aarti Industries Ltd. is a prominent Indian manufacturer specializing in specialty chemicals and pharmaceuticals, operating primarily on the NSE exchange within the Basic Materials sector. The company serves diverse industries including agrochemicals, polymers, pigments, and healthcare, leveraging advanced technology and extensive R&D capabilities. Headquartered in Mumbai, it holds a significant position in the chemical supply chain, providing critical intermediates for various industrial applications domestically and internationally.
Financially, Aarti Industries reported trailing twelve months (TTM) revenue of approximately ₹80.29 billion with a gross margin of 33.95%, operating margin of 8.84%, and net profit margin of 4.71%. The company’s return on equity (ROE) stands at 5.90%, return on assets (ROA) at 2.98%, and return on invested capital (ROIC) is reflected through an enterprise-to-EBITDA ratio of 20.63, indicating moderate profitability and operational efficiency amid industry dynamics. Quarterly revenue growth was robust at 26%, and earnings per share (EPS) diluted stood at ₹10.4.
Valuation metrics show a trailing price-to-earnings (P/E) ratio of 48.75 and a forward P/E of 32.27, with a price-to-book (P/B) ratio of 3.23 and an enterprise value to EBITDA (EV/EBITDA) of 20.63. The market capitalization is approximately ₹184.26 billion, with the stock trading at ₹486, positioned closer to its 52-week high of ₹512.40 and well above the 52-week low of ₹338.05. These multiples suggest a premium valuation relative to some peers, reflecting growth expectations priced into the stock.
The company’s strengths include strong cash flow generation with operating cash flow of ₹2.91 billion and levered free cash flow of ₹3.31 billion, a manageable debt-to-equity ratio of 69.56%, and a strategic market position in specialty chemicals. Risks involve margin pressures from rising costs, geopolitical uncertainties, and competitive challenges in the chemical industry. Recent strategic actions include securing key contracts and maintaining operational resilience amid volatile macroeconomic conditions, as highlighted in recent quarterly results.
Technically, the stock is trading above its 50-day and 200-day moving averages, indicating a positive trend with momentum indicators showing strength across multiple timeframes. Recent news points to operational improvements and margin expansion despite revenue fluctuations. Overall, the data suggests a nuanced environment where accumulation or cautious monitoring may be appropriate based on evolving market and company fundamentals.
Company and Industry Overview
Company Basics
Price Performance
Company Size
Shareholding Pattern
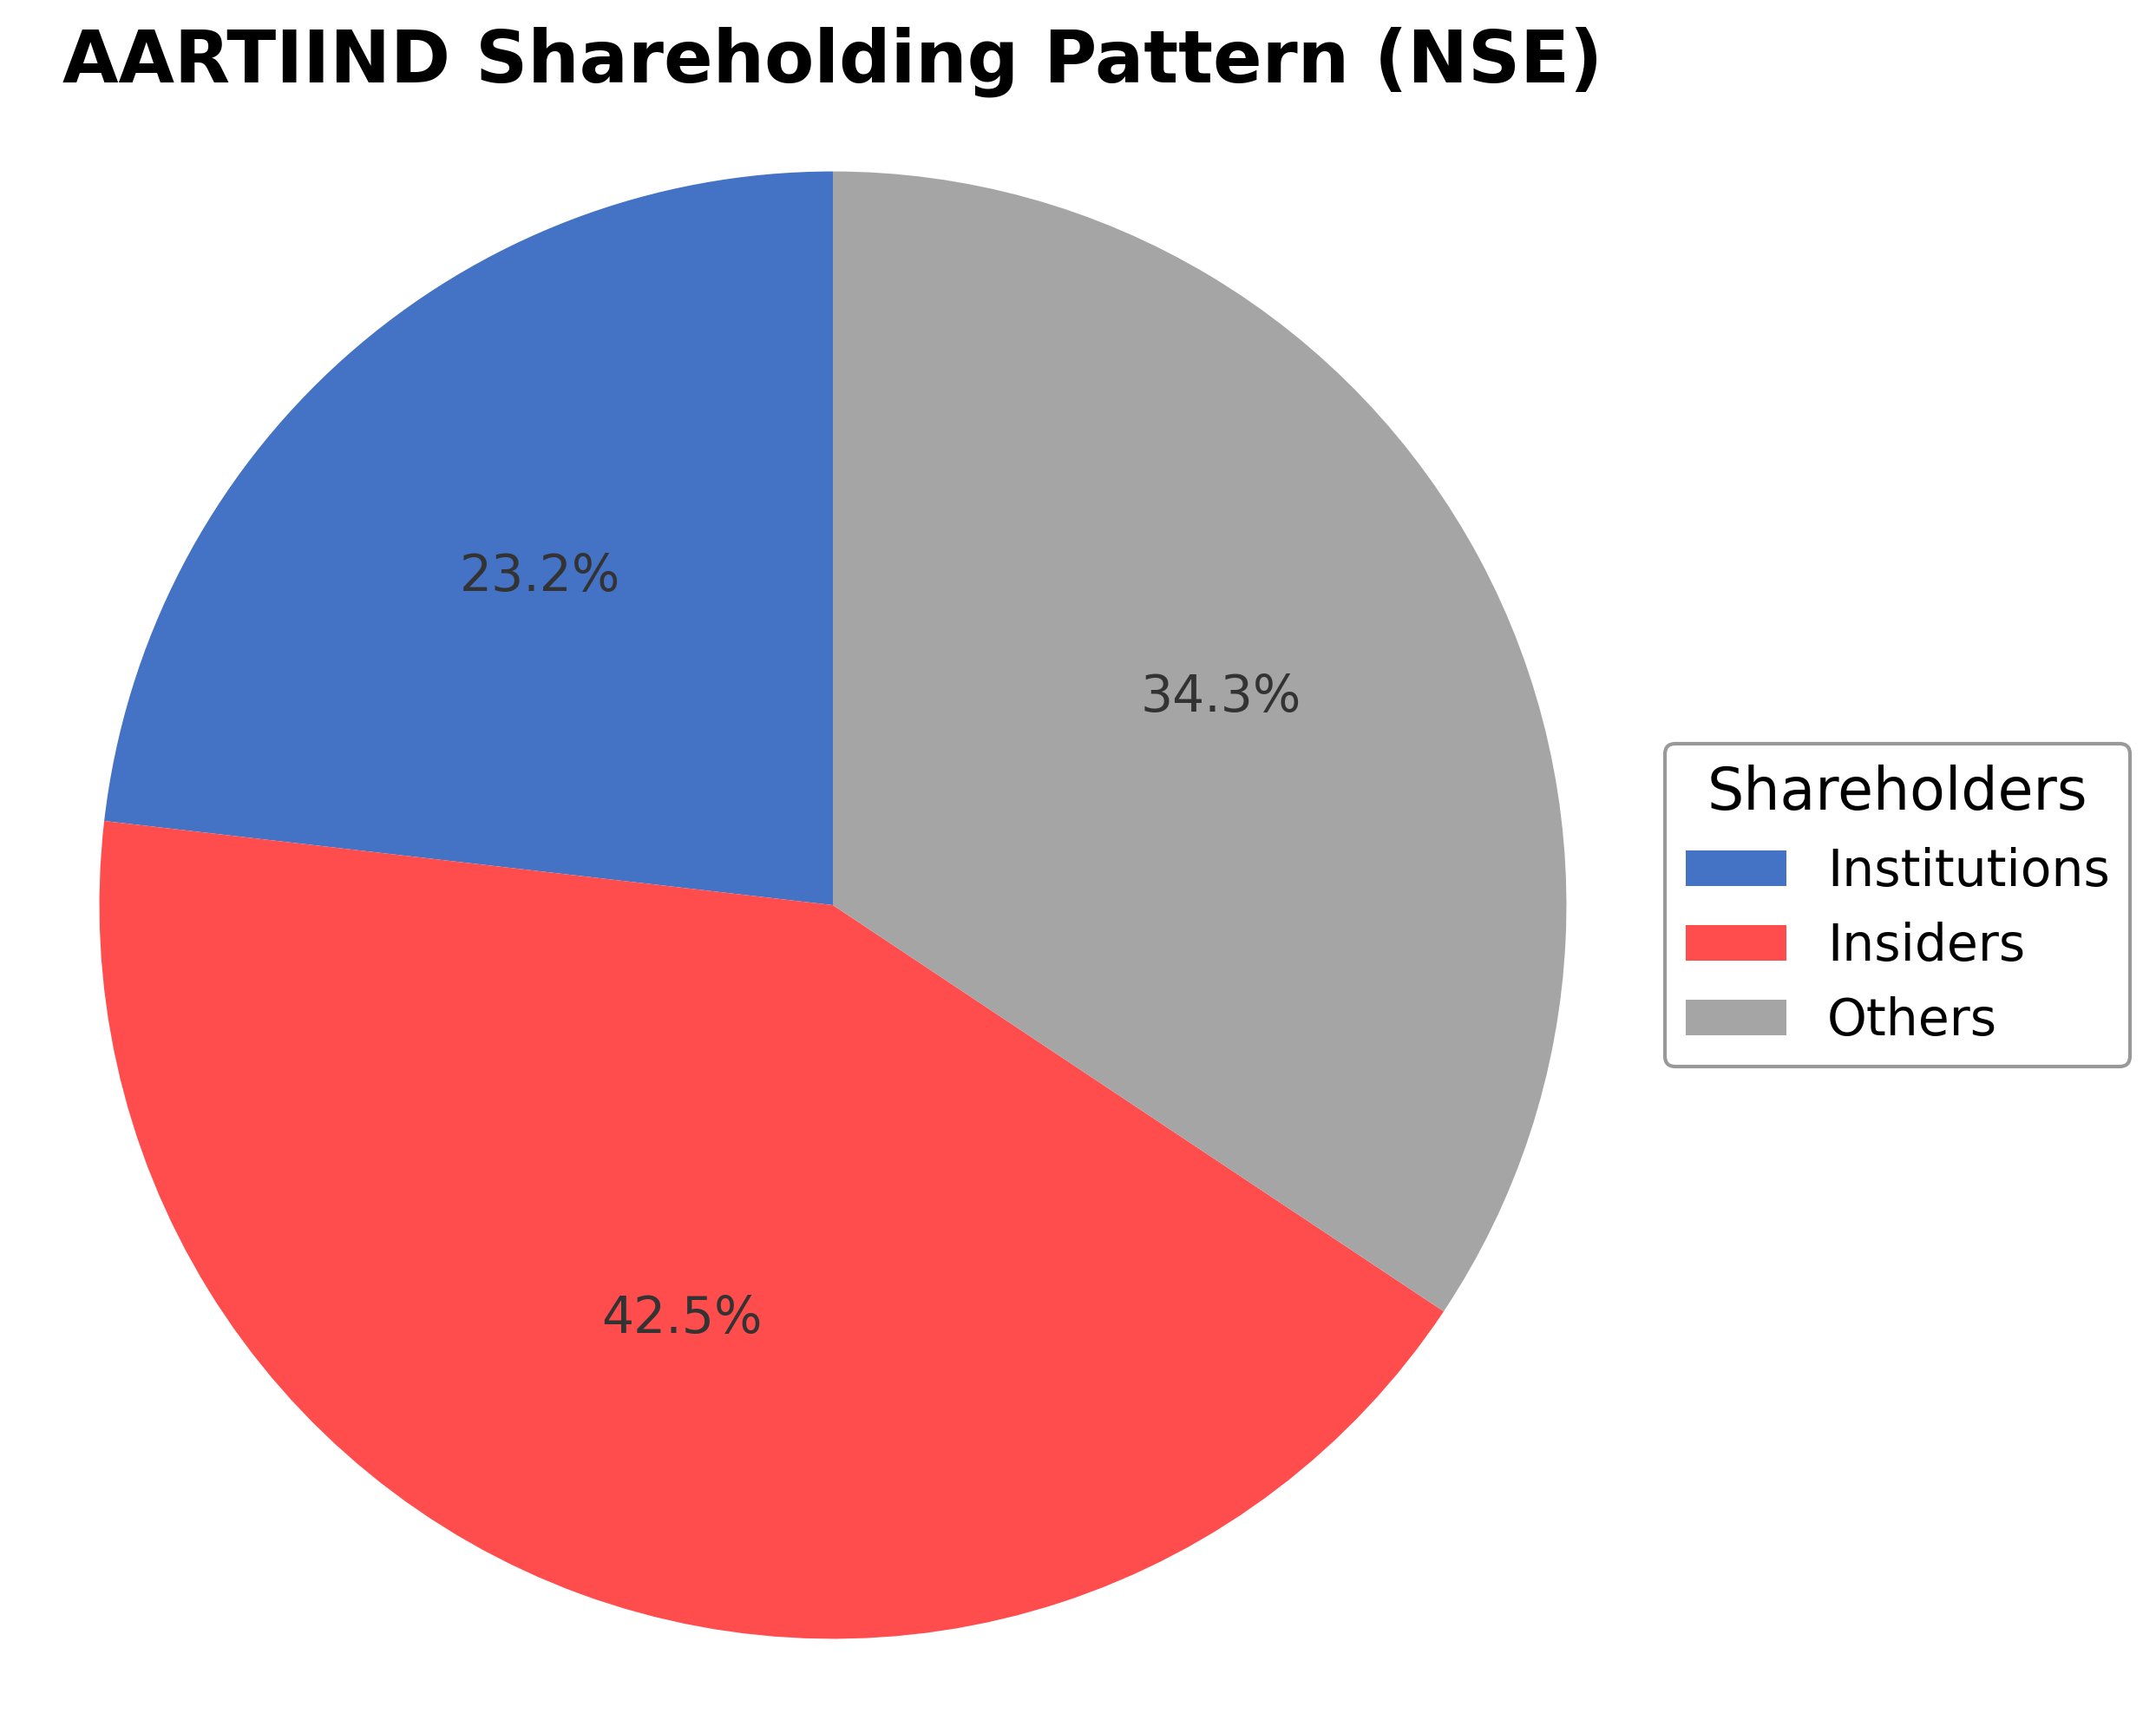
Aarti Industries Ltd.'s shareholding structure comprises approximately 42.49% held by insiders including executives and board members, 23.17% by institutional investors such as mutual funds and pension funds, and the remaining 34.34% by public shareholders including retail investors and employee stock plans. Over the past 12 to 24 months, institutional ownership has shown moderate accumulation, reflecting confidence from major funds in the company’s growth prospects. Promoter holdings have remained relatively stable, supporting governance continuity. This ownership pattern indicates balanced market sentiment with significant institutional interest, which may influence strategic decisions and corporate governance going forward.
Sector and Industry Analysis
The chemicals sector in India is a significant contributor to the economy, encompassing a broad range of products including specialty chemicals, pharmaceuticals, and agrochemicals. The specialty chemicals segment, in particular, is witnessing robust growth, with an estimated CAGR of around 19% from FY20 to FY23, driven by increasing demand from end-user industries such as pharmaceuticals and agrochemicals. Key players in this sector include companies with strong backward integration and diversified product portfolios, enabling them to cater to multiple industries with complex chemical solutions.
Industry trends indicate a growing emphasis on value-added and specialty chemicals, supported by innovation and long-term customer contracts that provide cost-plus pricing models, enhancing margin stability. Companies with advanced chemistry capabilities and integrated manufacturing processes hold competitive advantages, as barriers to entry include high capital intensity, technical expertise, and stringent quality standards. The competitive landscape is marked by firms expanding their product baskets and entering multi-year contract research and manufacturing services (CRAMS) agreements to secure steady revenue streams.
The regulatory environment for the chemicals sector is shaped by environmental, safety, and export-import policies that influence operational compliance and market access. Stringent environmental norms necessitate investments in cleaner technologies and waste management, impacting cost structures but also encouraging sustainable practices. Additionally, government initiatives promoting domestic manufacturing and export incentives aim to bolster the sector’s global competitiveness, while adherence to international quality standards remains critical for accessing global markets.
Note: Analysis synthesized from industry research, market reports, and regulatory filings. Information is subject to change based on market conditions.
Financial Ratios Dashboard
Illustrative Scenario Analysis
DCF Assumptions:
Method: Two-Stage EPS-Priority Model
Financials
Peer Analysis
| Company Name | Market Cap | P/E Ratio | P/B Ratio | EV/EBITDA | Price to CFO |
|---|---|---|---|---|---|
| Aarti Industries Ltd. | ₹184.26B | 48.75 | 3.23 | 20.63 | 63.33 |
| Vinati Organics Ltd. | ₹137.18B | 31.02 | 4.68 | 20.50 | 33.02 |
| Balaji Amines Ltd. | ₹43.21B | 30.11 | 2.30 | 19.37 | 16.32 |
| Linde India Ltd. | ₹624.28B | 106.82 | 16.41 | 74.59 | 96.25 |
| Asian Paints Ltd. | ₹2.34T | 61.11 | 11.99 | 39.79 | 49.47 |
| Atul Ltd. | ₹200.72B | 29.62 | 3.23 | 18.03 | 19.63 |
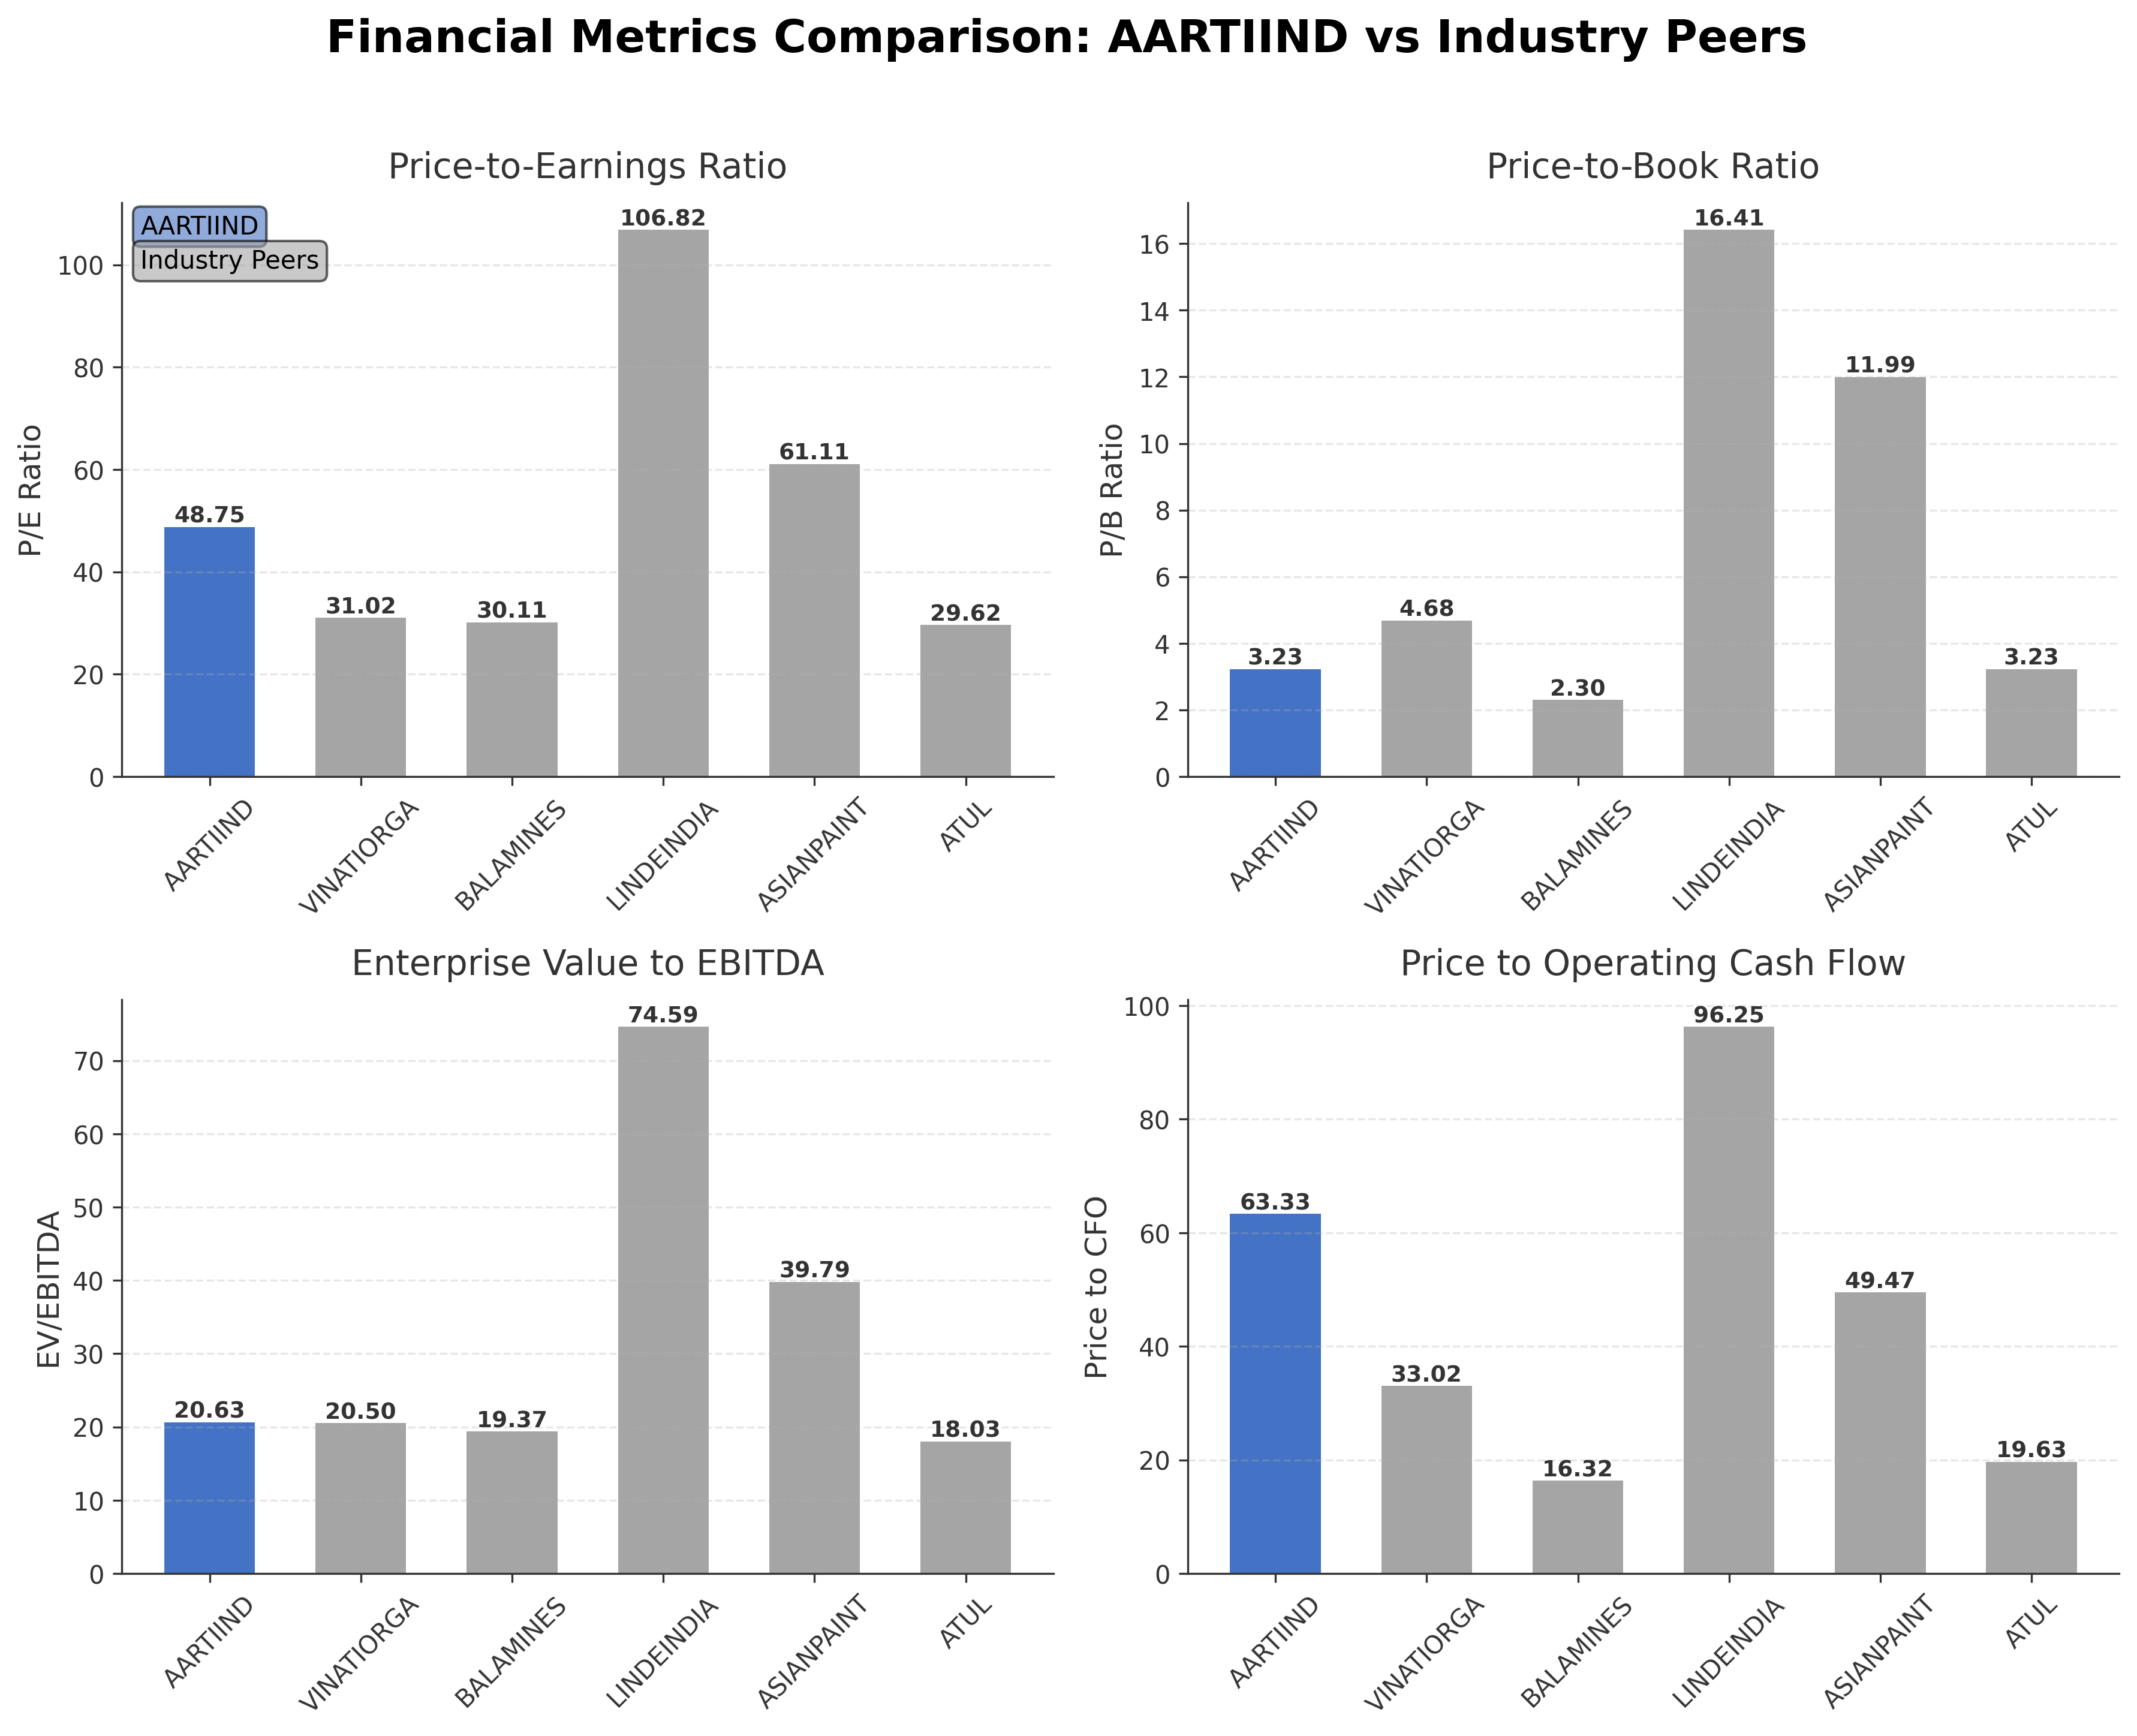
Comparison Analysis: Aarti Industries Ltd. exhibits a higher trailing P/E ratio of 48.75 compared to most peers such as Vinati Organics (31.02) and Balaji Amines (30.11), indicating a premium valuation. Its P/B ratio of 3.23 is moderate relative to the sector, lower than Linde India and Asian Paints but aligned with Atul Ltd. The EV/EBITDA multiple of 20.63 is comparable to peers like Vinati Organics and slightly above Balaji Amines and Atul Ltd. The company’s price to CFO ratio at 63.33 is notably higher than peers, suggesting elevated cash flow valuation. Return on equity at 6% is lower than most peers, reflecting relatively modest profitability. Overall, Aarti Industries trades at premium multiples with moderate profitability compared to regional specialty chemical companies.
Financial Metrics Comparison with Peers
Financial Statements
Comprehensive financial data including income, balance sheet, and cash flow metrics
Income Statement
| fiscal_date | 2025-03-31 | 2024-03-31 | 2023-03-31 | 2022-03-31 | 2021-03-31 |
|---|---|---|---|---|---|
| Sales | 71.31B | 61.93B | 64.92B | 51.91B | 43.05B |
| Cost Of Goods | 53.75B | 46.55B | 46.95B | 36.02B | 28.63B |
| Gross Profit | 17.56B | 15.38B | 17.98B | 15.89B | 14.42B |
| Operating Expense Selling General And Administrative | 4.35B | 3.09B | 4.31B | 3.87B | 2.62B |
| Operating Expense Other Operating Expenses | 11.93B | 11.12B | 13.03B | 19.40B | 600.00K |
| Operating Income | 6.00B | 6.23B | 7.96B | 14.86B | 7.66B |
| Non Operating Interest Income | 149.50M | 70.90M | 0.00 | N/A | N/A |
| Non Operating Interest Expense | 2.36B | 1.83B | 1.06B | 686.30M | 767.10M |
| Pretax Income | 3.07B | 3.95B | 6.11B | 13.72B | 6.65B |
| Income Tax | -236.30M | -210.50M | 658.70M | 1.86B | 1.29B |
| Net Income | 3.31B | 4.16B | 5.45B | 11.86B | 5.35B |
| Eps Basic | 9.13 | 11.49 | 15.04 | 32.71 | 15.02 |
| Eps Diluted | 9.12 | 11.49 | 15.04 | 32.71 | 15.02 |
| Basic Shares Outstanding | 362.53M | 362.50M | 362.50M | 362.50M | 348.47M |
| Diluted Shares Outstanding | 362.53M | 362.50M | 362.50M | 362.50M | 348.47M |
| Ebit | 5.44B | 5.79B | 7.17B | 14.41B | 7.41B |
| Ebitda | 9.86B | 9.62B | 10.28B | 16.87B | 9.73B |
| Net Income Continuous Operations | 3.05B | 3.95B | 6.11B | 13.72B | 6.65B |
| Minority Interests | 0.00 | 0.00 | 0.00 | -2.30M | -117.50M |
| Preferred Stock Dividends | 0.00 | 0.00 | 0.00 | 0.00 | 0.00 |
Source: Financial statements and regulatory filings
Balance Sheet
| fiscal_date | 2025-03-31 | 2024-03-31 | 2023-03-31 | 2022-03-31 | 2021-03-31 |
|---|---|---|---|---|---|
| Cash And Cash Equivalents | 1.99B | 417.80M | 1.67B | 936.30M | 4.10B |
| Accounts Receivable | 7.86B | 8.26B | 9.40B | 10.92B | 7.94B |
| Total Assets | 111.14B | 96.16B | 85.81B | 78.51B | 76.42B |
| Total Liabilities | 55.08B | 43.25B | 36.60B | 33.33B | 41.27B |
| Long Term Debt | 19.15B | 15.73B | 6.60B | 9.45B | 12.81B |
| Shareholders Equity | 56.05B | 52.90B | 49.21B | 45.17B | 35.15B |
Source: Financial statements and regulatory filings
Cash Flow Statement
| fiscal_date | 2025-03-31 | 2024-03-31 | 2023-03-31 | 2022-03-31 | 2021-03-31 |
|---|---|---|---|---|---|
| Operating Activities Net Income | 3.05B | 3.95B | 6.11B | 13.72B | 6.65B |
| Operating Activities Other Non Cash Items | 2.37B | 1.95B | 1.13B | 766.00M | 810.60M |
| Operating Activities Accounts Receivable | 437.70M | 685.50M | 4.22B | -4.98B | -250.10M |
| Operating Activities Other Assets Liabilities | -2.95B | -1.29B | -969.20M | -4.20B | -1.11B |
| Operating Activities Operating Cash Flow | 2.91B | 5.30B | 10.50B | 5.31B | 6.10B |
| Investing Activities Capital Expenditures | -13.79B | -13.04B | -13.26B | -11.65B | -13.14B |
| Investing Activities Net Acquisitions | -234.50M | 0.00 | 0.00 | 0.00 | 0.00 |
| Investing Activities Other Investing Activity | 600.00K | 400.00K | 600.00K | 500.00K | 500.00K |
| Investing Activities Investing Cash Flow | -14.02B | -13.04B | -13.30B | -11.69B | -13.22B |
| Financing Activities Long Term Debt Issuance | 7.03B | 12.92B | 15.27B | N/A | 10.08B |
| Financing Activities Long Term Debt Payments | -4.55B | -9.82B | -12.21B | N/A | -2.62B |
| Financing Activities Common Stock Issuance | 100.00K | N/A | 0.00 | 11.87B | 0.00 |
| Financing Activities Common Dividends | -362.50M | -543.80M | -906.30M | -1.27B | -450.90M |
| Financing Activities Other Financing Charges | -10.00M | -10.00M | N/A | N/A | N/A |
| Financing Activities Financing Cash Flow | 2.11B | 2.54B | 2.15B | 10.60B | 7.01B |
| End Cash Position | 1.99B | 1.30B | 2.01B | 1.74B | 4.12B |
| Free Cash Flow | -1.44B | -1.24B | -75.60M | -6.47B | -4.42B |
| Investing Activities Purchase Of Investments | N/A | N/A | -35.40M | -50.00M | -78.20M |
| Investing Activities Sale Of Investments | N/A | N/A | 0.00 | 5.20M | 0.00 |
| Financing Activities Common Stock Repurchase | N/A | N/A | N/A | N/A | N/A |
Source: Financial statements and regulatory filings
Technical Analysis
Key Insights
- The stock is currently in an upward trend, trading above its 50-day moving average of ₹435.03 and 200-day moving average of ₹397.66, indicating bullish momentum.
- Key support levels are identified near ₹435 and ₹398, while resistance is observed close to the 52-week high of ₹512.40.
- The price remains above the 10-day moving average, reinforcing short-term strength in price action.
- Momentum indicators show RSI in a moderately overbought range, MACD is positive with a bullish crossover, and stochastic oscillators indicate sustained buying pressure.
- Analysis across daily, weekly, and monthly timeframes confirms consistent upward momentum with no major trend reversals detected.
- Potential scenarios include continuation of the current uptrend if support levels hold, while a break below the 50-day moving average could signal consolidation or a pullback.
Trending News
1. Headline: Stay Informed with MarketsMojo News: Stock Market Insights, Portfolio Tracking, Alerts, and Expert Analyses
Summary: Latest news on Stocks in Action, Trending Stocks, Stock Analysis, Result Analysis, Corporate News, Stock Market News, IPOs, Mutual Funds, Global Markets, and Investment Ideas at MarketsMojo. Enhance your financial decisions with insightful stock market analysis, seamless portfolio tracking, ...
Sentiment: neutral
Summary: Last week saw the newest annual earnings release from Aarti Industries Limited ( NSE:AARTIIND ), an important milestone...
Sentiment: positive
Summary: Aarti Industries Delivers Resilient Performance in Q4; Strengthens Global Positioning Amid Volatile Macro Environment
Sentiment: positive
4. Headline: Aarti Industries: Strong Growth Meets High Valuation and Shrinking Margins | Whalesbook
Summary: Aarti Industries posts strong sales growth, but high valuations, rising costs, and geopolitical risks are squeezing profit margins.
Sentiment: positive
5. Headline: Accumulate Aarti Industries; target of Rs 529: Prabhudas Lilladher- Moneycontrol.com
Summary: Prabhudas Lilladher recommended Accumulate rating on Aarti Industries with a target price of Rs 529 in its research report dated May 05, 2026.
Sentiment: neutral
Recent Updates
News Summary
As of 2026-05-09. Aarti Industries demonstrated operational resilience in Q4 FY26, successfully strengthening its global market position despite a volatile macroeconomic backdrop. The company reported a 12% year-on-year revenue increase to ₹9,018 crore for FY26, supported by strong EBITDA and PAT growth, indicating enhanced operational efficiency and solid demand. Key strategic contracts and operational milestones achieved during the quarter further underscore the company's robust execution capabilities. These developments collectively reinforce Aarti Industries' standing as a leading specialty chemicals manufacturer in India with sustained growth momentum.
News Sentiment
The overall sentiment across recent updates is positive, driven by strong financial results including double-digit revenue growth and margin expansion despite challenging global conditions. Positive operational developments and strategic contract wins contribute to confidence in the company's market positioning. However, some caution is warranted due to ongoing macroeconomic volatility and margin pressures noted in industry commentary. The balanced tone reflects optimism about growth prospects tempered by awareness of external risks.
Source List
- https://thehindubusinessline.com/brandhub/pr-release/aarti-industries-delivers-resilient-performance-in-q4-strengthens-global-positioning-amid-volatile-macro-environment/article70946514.ece
- https://www.investywise.com/aarti-industries-q4-fy26-performance-update/
- https://www.investywise.com/aarti-industries-q4-and-annual-fy26-results/
Analytical Overview
Analysis Summary
Aarti Industries’ valuation metrics show a trailing P/E of 48.75 and forward P/E of 32.27, which are higher than the industry average P/E of 48.75 but reflect a premium relative to several peers, indicating market expectations for growth. The company’s revenue growth of 26% quarterly and 12% annually, alongside positive cash flow trends with operating cash flow of ₹2.91 billion and free cash flow of ₹3.31 billion, demonstrate a solid growth trajectory and operational cash generation. Financial health is moderate with a total debt to equity ratio of 69.56%, and a current ratio below 1 at 0.83, suggesting some liquidity constraints but manageable leverage. Sector-specific challenges include rising input costs and geopolitical risks impacting margins, while opportunities arise from increasing demand in specialty chemicals and strategic contract wins. Considering India-specific factors, regulatory compliance and domestic market growth support the company’s positioning in a competitive environment.
Overall Business and Market Assessment
Supporting Factors: strong revenue growth and operational cash flow generation, alongside strategic contract acquisitions that bolster market presence
Risk Factors: margin pressures from input cost inflation and geopolitical uncertainties that may affect profitability
SWOT Analysis
Strengths
- Strong revenue growth with 26% quarterly increase and 12% annual growth.
- Robust operational cash flow generation supporting financial stability.
- Established market position in specialty chemicals with diversified product portfolio.
- Strategic contract wins enhancing global competitiveness.
Weaknesses
- High valuation multiples compared to industry peers.
- Moderate return on equity at 5.9% indicating room for profitability improvement.
- Current ratio below 1 indicating potential short-term liquidity constraints.
- Debt-to-equity ratio of 69.56% reflects moderate leverage.
Opportunities
- Growing demand in specialty chemicals sector driven by industrial and pharmaceutical needs.
- Expansion through strategic partnerships and contract acquisitions.
- Favorable regulatory environment supporting domestic chemical manufacturing.
- Innovation and R&D capabilities enabling product diversification.
Threats
- Rising raw material and input costs squeezing profit margins.
- Geopolitical tensions impacting global supply chains and market stability.
- Intense competition within the specialty chemicals industry.
- Macroeconomic volatility affecting demand and operational costs.
Company Description
Aarti Industries Ltd. is a leading Indian chemical manufacturer specializing in the production of specialty chemicals and pharmaceuticals. The company's primary focus lies in creating a diverse portfolio of high-performance chemicals that serve various industries including agrochemicals, polymers, pigments, and pharmaceuticals. Notable for its robust capabilities in chemistry, Aarti Industries Ltd. provides crucial intermediates that support global industrial applications ranging from manufacture of dyes and pigments, additives, to those required in healthcare and agrichemicals. The company is strategically significant in the chemical supply chain, enabling sectors to enhance product performance and efficiency. Headquartered in Mumbai, India, Aarti Industries Ltd. leverages cutting-edge technology and infrastructure, ensuring compliance with rigorous safety and environmental standards. Its expansive production and R&D facilities allow for continuous innovation and adaptability, reinforcing its market position both domestically and internationally. As such, Aarti Industries Ltd. plays a pivotal role in bridging raw chemical production and end-user product transformations across multiple industry sectors.