
Aarti Industries Ltd (AARTIIND)
Stock Analysis Report
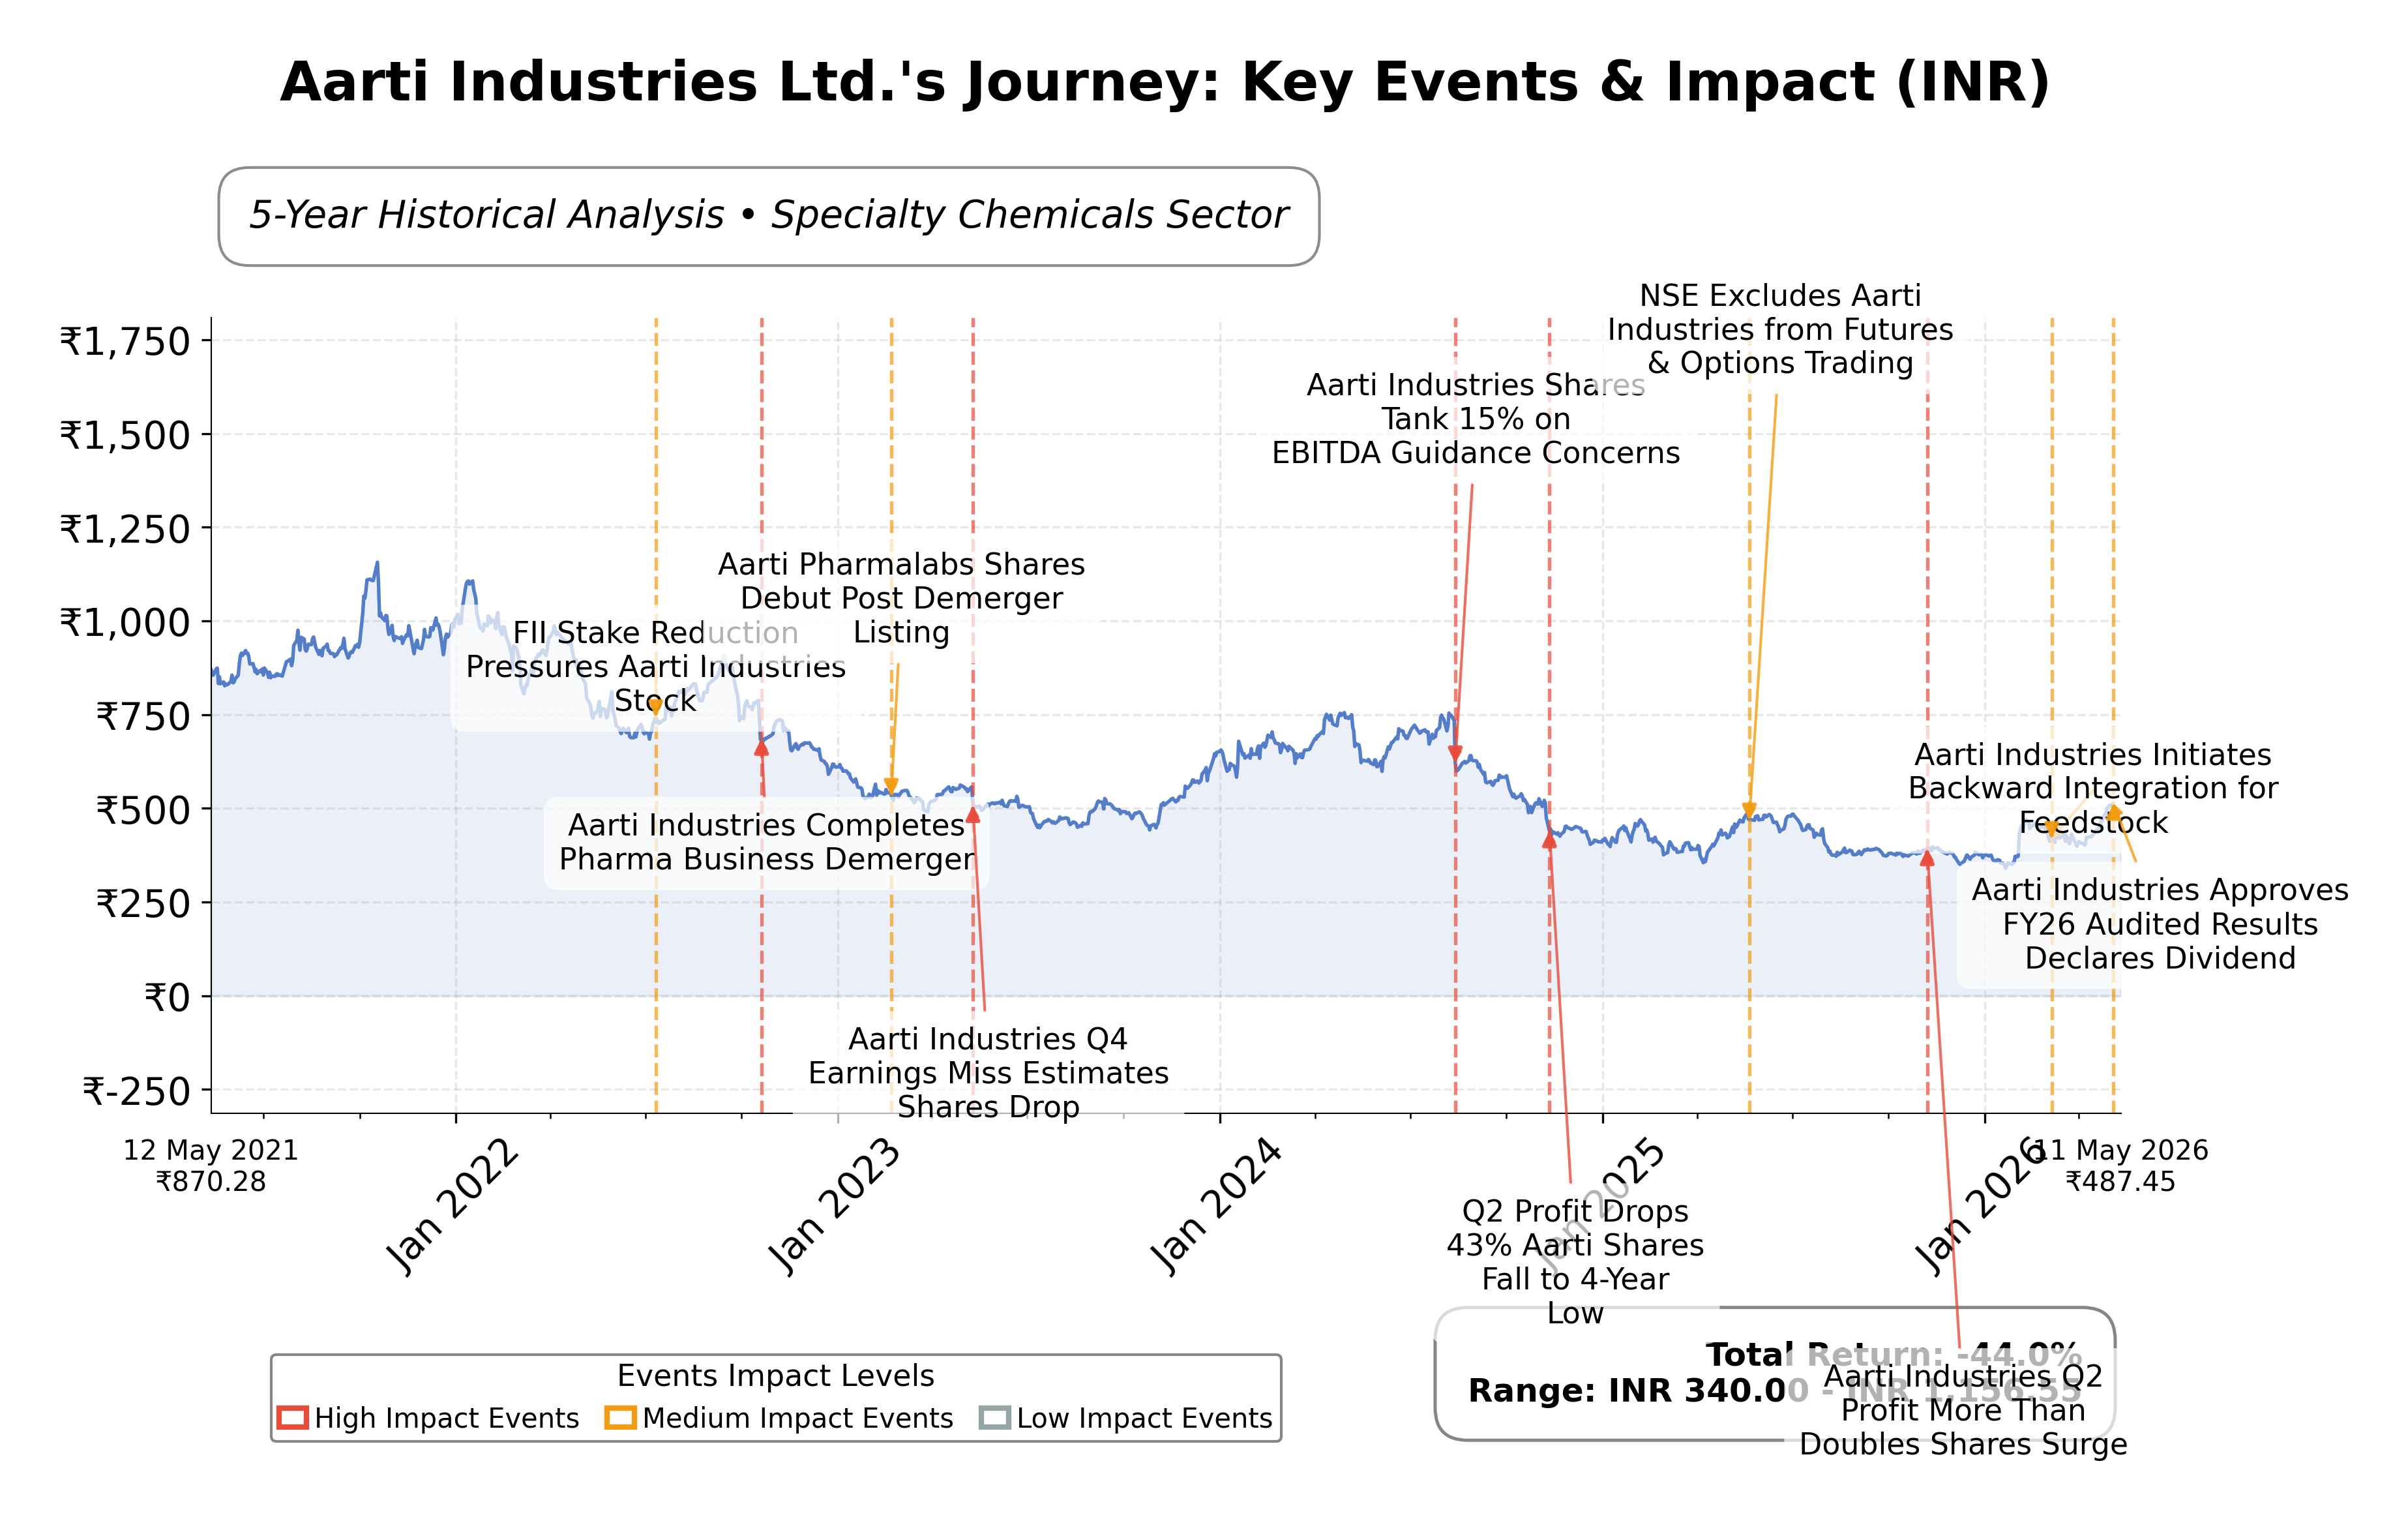
Stock Journey
Key Positives and Key Risks
Pros
- Revenue growth of 26% quarterly and 12% annually demonstrates strong top-line momentum.
- Positive free cash flow of ₹4.19 billion indicates effective cash generation despite operating cash flow challenges.
- Forward P/E ratio of 23.87 and PEG ratio of 0.21 suggest valuation aligned with growth prospects.
Cons
- Current ratio of 0.83 signals potential liquidity constraints in the short term.
- Trailing P/E of 42.18 is high relative to peers, indicating premium pricing.
- Negative operating cash flow of ₹-2.68 billion raises concerns about core cash operations.
Disclosure: This information is for general awareness and does not constitute investment advice
Report Summary
Aarti Industries Ltd. operates as a prominent Indian manufacturer specializing in specialty chemicals and pharmaceuticals. Listed on the NSE under the Basic Materials sector, the company serves diverse industries including agrochemicals, polymers, pigments, and healthcare. Its market positioning is reinforced by advanced R&D capabilities and extensive production infrastructure, enabling it to supply critical chemical intermediates for global industrial applications. Headquartered in Mumbai, Aarti Industries maintains compliance with stringent safety and environmental standards, supporting its competitive stance both domestically and internationally.
Financially, the company reported trailing twelve months (TTM) revenue of approximately ₹80.29 billion with a gross margin of 40.09%, operating margin of 8.84%, and net profit margin of 4.71%. Return on equity (ROE) stands at 7.04%, and return on assets (ROA) at 3.15%, indicating moderate profitability and asset efficiency. The company’s EBITDA reached ₹11.46 billion, while net income was ₹3.78 billion, reflecting operational strength despite some margin pressures. Quarterly revenue growth was robust at 26%, and earnings growth year-over-year surged by 189%, signaling positive momentum.
Valuation metrics reveal a trailing P/E ratio of 42.18 and a forward P/E of 23.87, with a price-to-book ratio of 3.10 and an EV/EBITDA multiple near 20. The market capitalization is approximately ₹176.25 billion. The stock price currently trades at ₹471, within a 52-week range of ₹523.10 to ₹338.05, representing an upside potential of about 11.1% from the current price to the 52-week high. These valuation levels suggest the market prices in growth prospects, though at a premium relative to some peers.
Key strengths include a strong market presence in specialty chemicals, consistent revenue growth, and a solid balance sheet with total assets exceeding ₹111 billion. The company maintains a manageable debt-to-equity ratio of 0.70 and positive free cash flow of ₹4.19 billion, despite negative operating cash flow. Risks involve exposure to regulatory changes, competitive pressures in the chemical sector, and macroeconomic headwinds impacting raw material costs. Recent strategic actions include securing key contracts and operational milestones that support growth, alongside leadership continuity.
Technically, the stock exhibits a stable uptrend supported by its position above the 200-day moving average and moderate momentum indicators. The current price action suggests consolidation with potential for further accumulation, though volatility remains a consideration. Recent news highlights operational resilience and margin expansion, reflecting improving fundamentals. Overall, the data points to a cautiously optimistic environment for monitoring the stock’s performance.
Company and Industry Overview
Company Basics
Price Performance
Company Size
Shareholding Pattern
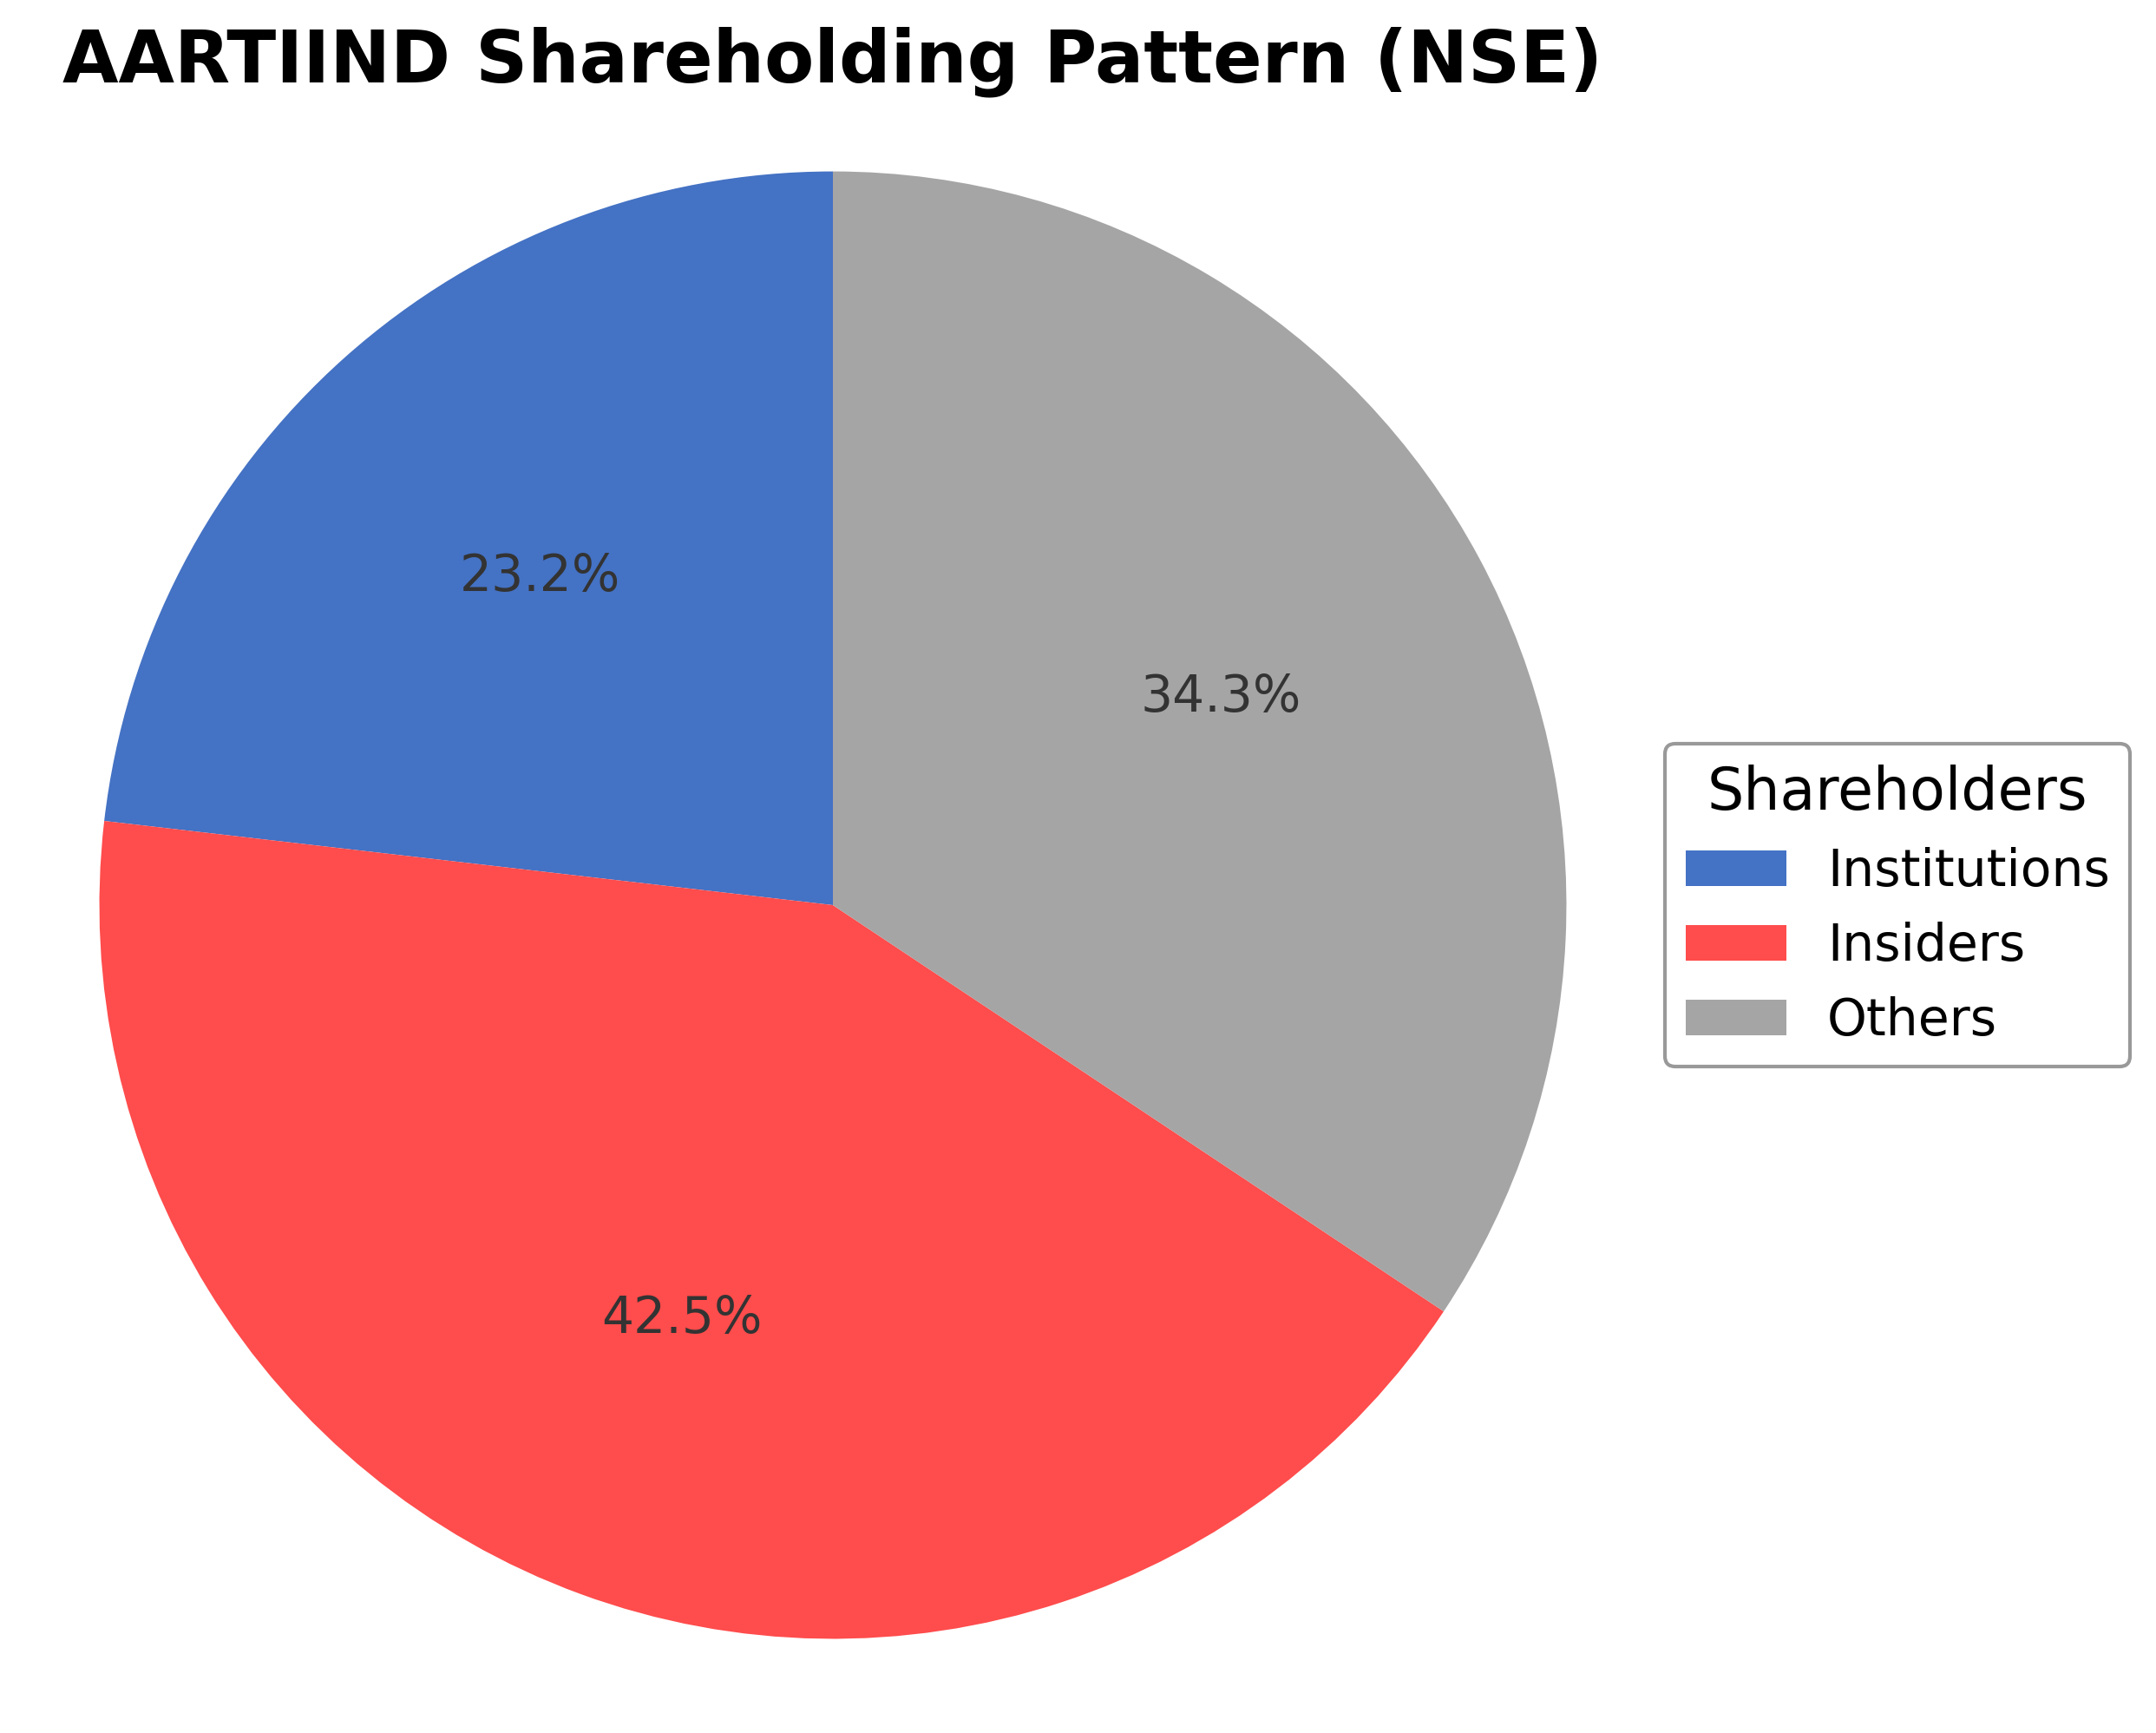
Aarti Industries Ltd. exhibits a shareholding structure dominated by insiders, who hold approximately 42.49% of shares, including executives and board members. Institutional investors account for about 23.17%, comprising mutual funds, pension funds, and asset managers, while the remaining 34.34% is held by public shareholders and other retail investors. Over the past 12 to 24 months, institutional ownership has shown moderate accumulation, reflecting growing confidence from major funds. This ownership distribution suggests a balanced governance framework with significant promoter control alongside active institutional participation. The current structure supports strategic decision-making aligned with shareholder interests and may influence future corporate actions in line with market expectations.
Sector and Industry Analysis
The chemical sector in India, encompassing specialty chemicals, agrochemicals, dyes, pigments, and pharmaceutical intermediates, is a significant contributor to the country's industrial output. It has shown steady growth with a compound annual growth rate (CAGR) of around 11-14% in recent years, driven by rising domestic demand and export opportunities. Major players include diversified companies with integrated manufacturing facilities, such as Aarti Industries, which hold strong market positions in niche segments like NCB-based specialty chemicals.
Industry trends highlight a shift towards specialty and performance chemicals due to their higher value addition and growth potential compared to commodity chemicals. Competitive dynamics are shaped by technological innovation, scale of operations, and backward integration, which create high entry barriers. Companies with diversified product portfolios and strong R&D capabilities tend to maintain competitive advantages, while increasing debtor days and capital-intensive operations remain challenges within the sector.
The regulatory environment for the chemical industry in India involves stringent environmental and safety norms, including compliance with pollution control and hazardous waste management standards. Recent policies emphasize sustainable manufacturing and reduction of carbon footprint, impacting operational costs and investment decisions. Ongoing regulatory scrutiny and evolving export-import policies continue to influence industry practices and market access, shaping the sector’s medium to long-term outlook.
Note: Analysis synthesized from industry research, market reports, and regulatory filings. Information is subject to change based on market conditions.
Financial Ratios Dashboard
Illustrative Scenario Analysis
DCF Assumptions:
Method: Two-Stage EPS-Priority Model
Financials
Peer Analysis
| Company Name | Market Cap | P/E Ratio | P/B Ratio | EV/EBITDA | Price to CFO |
|---|---|---|---|---|---|
| Aarti Industries Ltd. | ₹176.25B | 42.18 | 3.10 | 19.97 | -65.76 |
| Vinati Organics Ltd. | ₹144.73B | 32.70 | 4.93 | 21.64 | 34.84 |
| Balaji Amines Ltd. | ₹48.19B | 33.48 | 2.56 | 21.59 | 18.20 |
| Kansai Nerolac Paints Ltd. | ₹178.19B | 30.27 | 2.75 | 16.78 | 21.31 |
| Asian Paints Ltd. | ₹2.49T | 65.03 | 12.72 | 41.20 | 52.62 |
| Atul Ltd. | ₹208.70B | 30.82 | 3.35 | 18.80 | 20.41 |
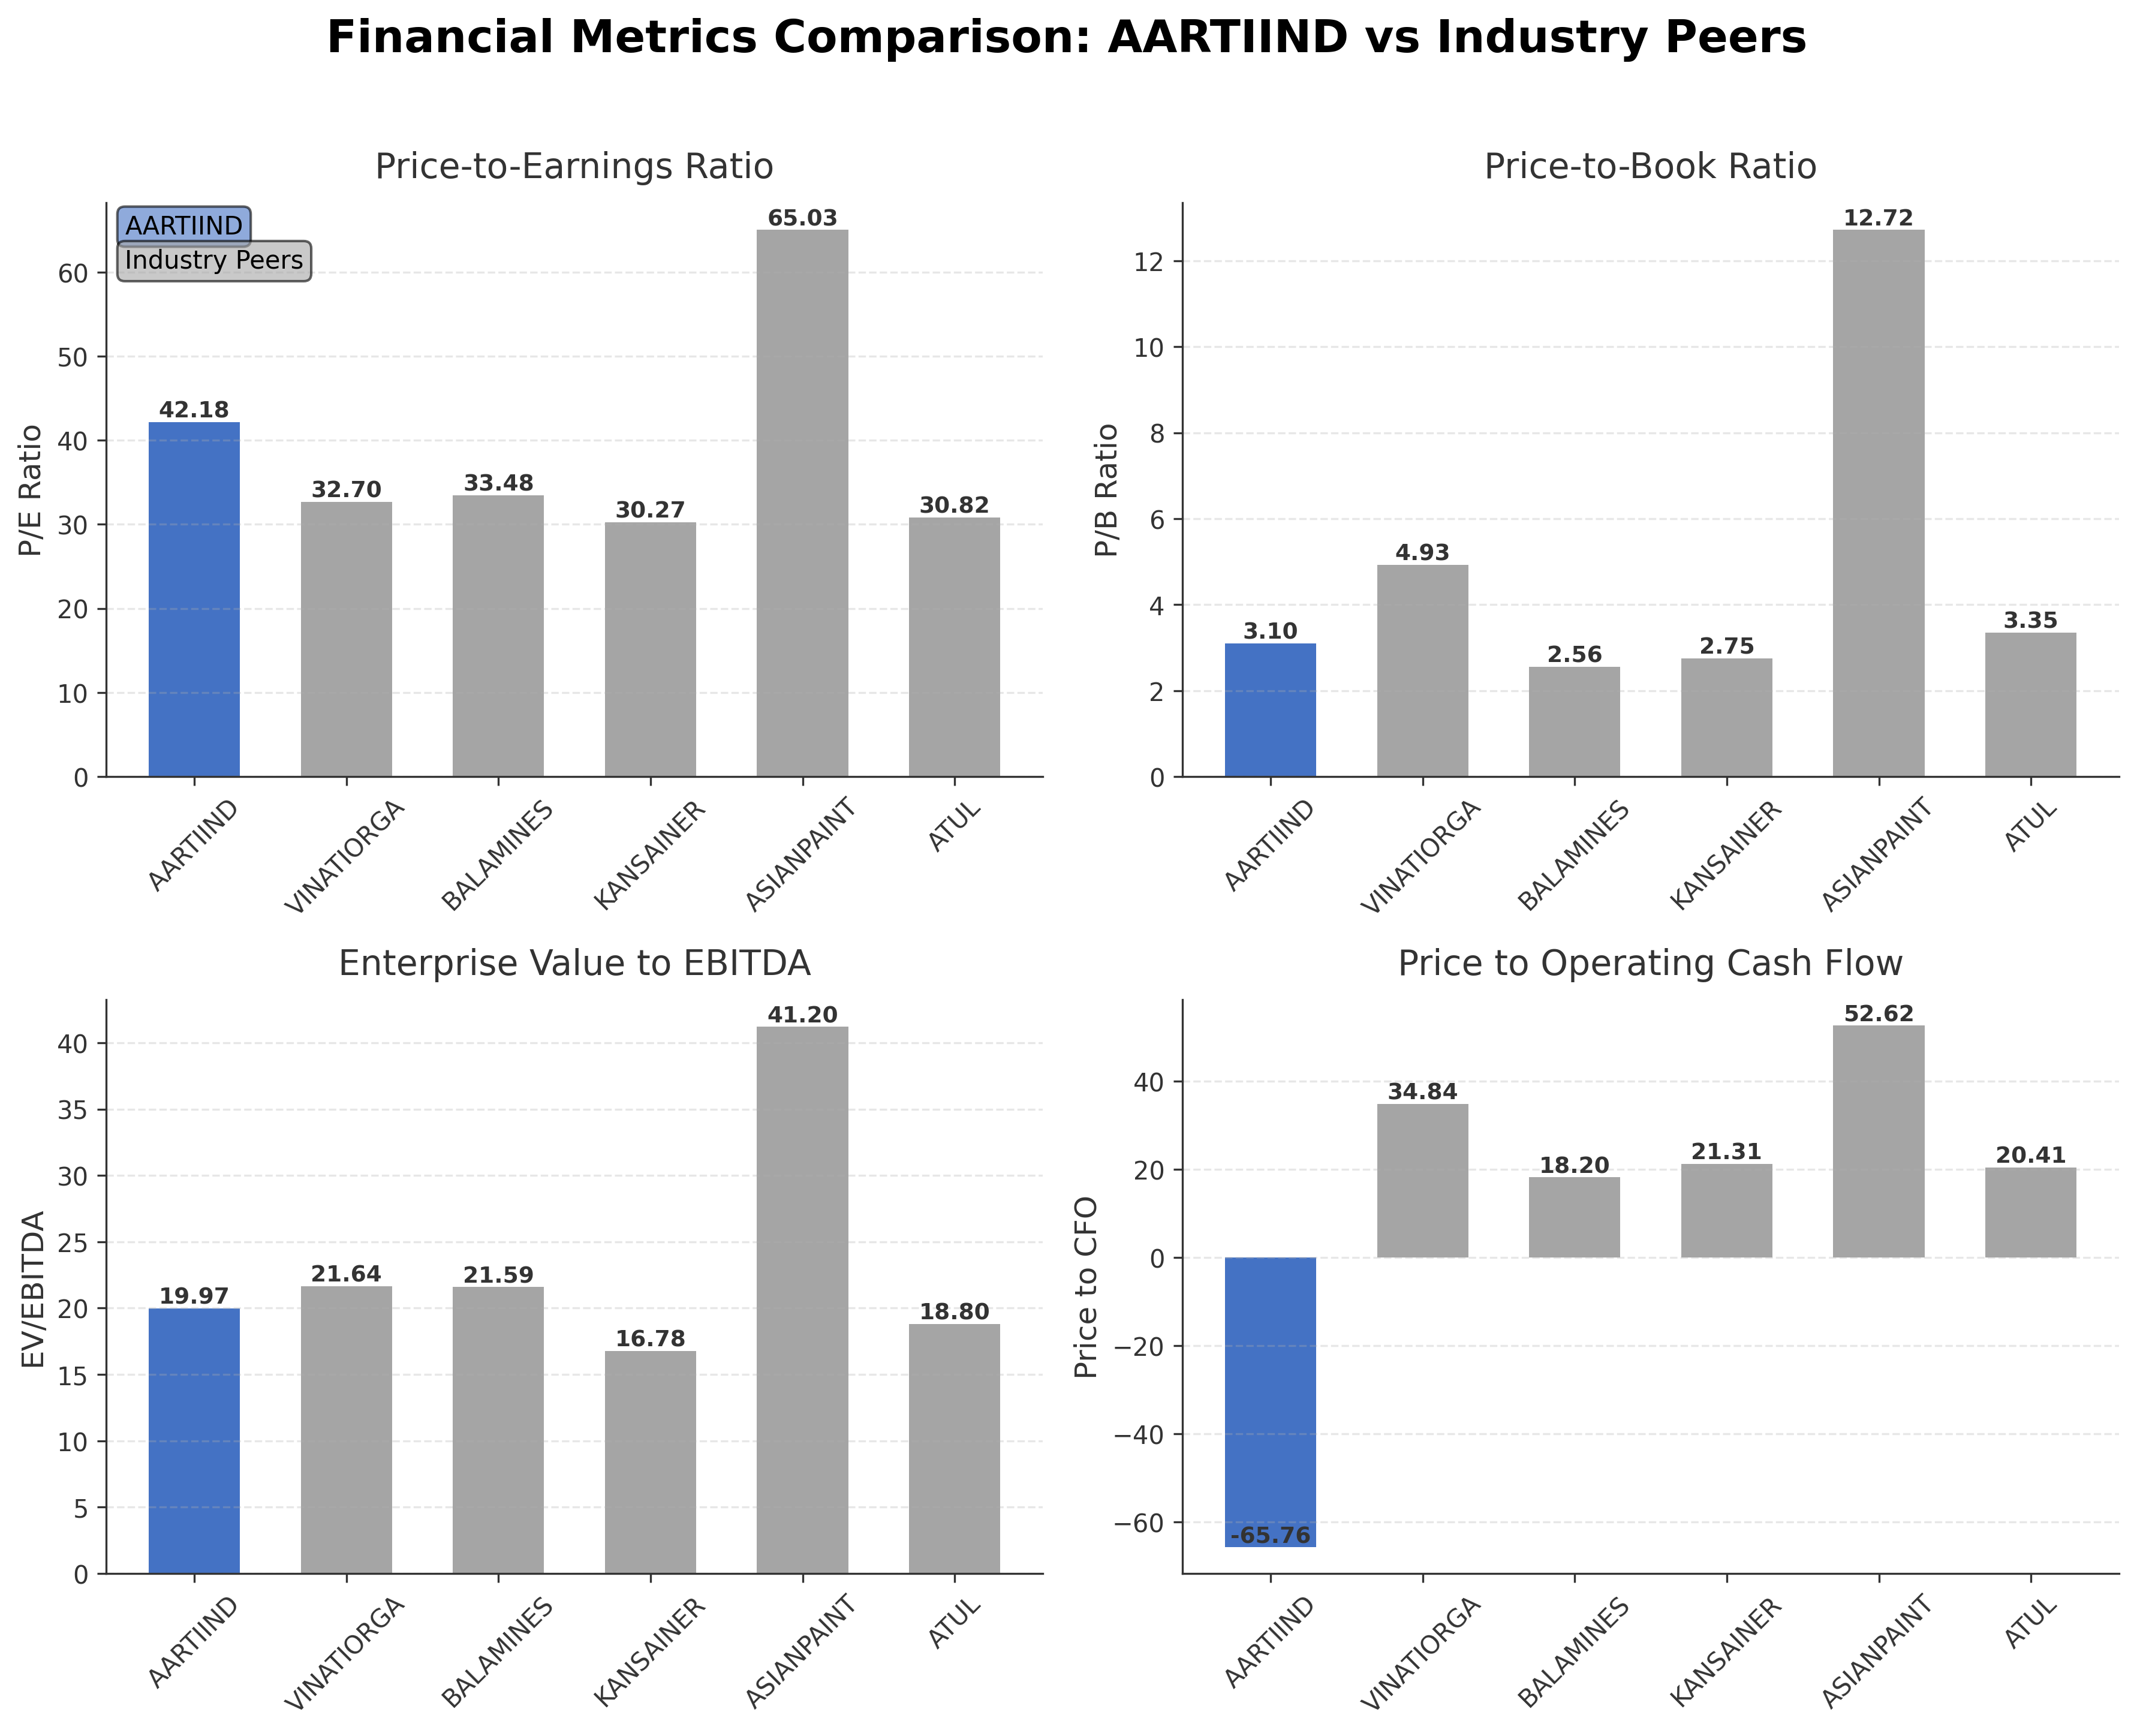
Comparison Analysis: Aarti Industries Ltd. trades at a higher P/E ratio of 42.18 compared to most regional peers, indicating a premium valuation relative to earnings. Its price-to-book ratio of 3.10 is moderate within the peer group, while the EV/EBITDA multiple of 19.97 is slightly below Asian Paints but above Kansai Nerolac and Atul Ltd. The company’s negative price to CFO ratio contrasts with positive values for peers, suggesting recent operating cash flow challenges. Return on equity at 7% is lower than most peers, reflecting comparatively modest profitability. Overall, Aarti Industries demonstrates solid market capitalization and growth metrics but faces valuation and cash flow considerations relative to its industry counterparts.
Financial Metrics Comparison with Peers
Financial Statements
Comprehensive financial data including income, balance sheet, and cash flow metrics
Income Statement
| fiscal_date | 2025-03-31 | 2024-03-31 | 2023-03-31 | 2022-03-31 | 2021-03-31 |
|---|---|---|---|---|---|
| Sales | 71.31B | 61.93B | 64.92B | 51.91B | 43.05B |
| Cost Of Goods | 53.75B | 46.55B | 46.95B | 36.02B | 28.63B |
| Gross Profit | 17.56B | 15.38B | 17.98B | 15.89B | 14.42B |
| Operating Expense Selling General And Administrative | 4.35B | 3.09B | 4.31B | 3.87B | 2.62B |
| Operating Expense Other Operating Expenses | 11.93B | 11.12B | 13.03B | 19.40B | 600.00K |
| Operating Income | 6.00B | 6.23B | 7.96B | 14.86B | 7.66B |
| Non Operating Interest Income | 149.50M | 70.90M | 0.00 | N/A | N/A |
| Non Operating Interest Expense | 2.36B | 1.83B | 1.06B | 686.30M | 767.10M |
| Pretax Income | 3.07B | 3.95B | 6.11B | 13.72B | 6.65B |
| Income Tax | -236.30M | -210.50M | 658.70M | 1.86B | 1.29B |
| Net Income | 3.31B | 4.16B | 5.45B | 11.86B | 5.35B |
| Eps Basic | 9.13 | 11.49 | 15.04 | 32.71 | 15.02 |
| Eps Diluted | 9.12 | 11.49 | 15.04 | 32.71 | 15.02 |
| Basic Shares Outstanding | 362.53M | 362.50M | 362.50M | 362.50M | 348.47M |
| Diluted Shares Outstanding | 362.53M | 362.50M | 362.50M | 362.50M | 348.47M |
| Ebit | 5.44B | 5.79B | 7.17B | 14.41B | 7.41B |
| Ebitda | 9.86B | 9.62B | 10.28B | 16.87B | 9.73B |
| Net Income Continuous Operations | 3.05B | 3.95B | 6.11B | 13.72B | 6.65B |
| Minority Interests | 0.00 | 0.00 | 0.00 | -2.30M | -117.50M |
| Preferred Stock Dividends | 0.00 | 0.00 | 0.00 | 0.00 | 0.00 |
Source: Financial statements and regulatory filings
Balance Sheet
| fiscal_date | 2025-03-31 | 2024-03-31 | 2023-03-31 | 2022-03-31 | 2021-03-31 |
|---|---|---|---|---|---|
| Cash And Cash Equivalents | 1.99B | 417.80M | 1.67B | 936.30M | 4.10B |
| Accounts Receivable | 7.86B | 8.26B | 9.40B | 10.92B | 7.94B |
| Total Assets | 111.14B | 96.16B | 85.81B | 78.51B | 76.42B |
| Total Liabilities | 55.08B | 43.25B | 36.60B | 33.33B | 41.27B |
| Long Term Debt | 19.15B | 15.73B | 6.60B | 9.45B | 12.81B |
| Shareholders Equity | 56.05B | 52.90B | 49.21B | 45.17B | 35.15B |
Source: Financial statements and regulatory filings
Cash Flow Statement
| fiscal_date | 2025-03-31 | 2024-03-31 | 2023-03-31 | 2022-03-31 | 2021-03-31 |
|---|---|---|---|---|---|
| Operating Activities Net Income | 3.05B | 3.95B | 6.11B | 13.72B | 6.65B |
| Operating Activities Other Non Cash Items | 2.37B | 1.95B | 1.13B | 766.00M | 810.60M |
| Operating Activities Accounts Receivable | 437.70M | 685.50M | 4.22B | -4.98B | -250.10M |
| Operating Activities Other Assets Liabilities | -2.95B | -1.29B | -969.20M | -4.20B | -1.11B |
| Operating Activities Operating Cash Flow | 2.91B | 5.30B | 10.50B | 5.31B | 6.10B |
| Investing Activities Capital Expenditures | -13.79B | -13.04B | -13.26B | -11.65B | -13.14B |
| Investing Activities Net Acquisitions | -234.50M | 0.00 | 0.00 | 0.00 | 0.00 |
| Investing Activities Other Investing Activity | 600.00K | 400.00K | 600.00K | 500.00K | 500.00K |
| Investing Activities Investing Cash Flow | -14.02B | -13.04B | -13.30B | -11.69B | -13.22B |
| Financing Activities Long Term Debt Issuance | 7.03B | 12.92B | 15.27B | N/A | 10.08B |
| Financing Activities Long Term Debt Payments | -4.55B | -9.82B | -12.21B | N/A | -2.62B |
| Financing Activities Common Stock Issuance | 100.00K | N/A | 0.00 | 11.87B | 0.00 |
| Financing Activities Common Dividends | -362.50M | -543.80M | -906.30M | -1.27B | -450.90M |
| Financing Activities Other Financing Charges | -10.00M | -10.00M | N/A | N/A | N/A |
| Financing Activities Financing Cash Flow | 2.11B | 2.54B | 2.15B | 10.60B | 7.01B |
| End Cash Position | 1.99B | 1.30B | 2.01B | 1.74B | 4.12B |
| Free Cash Flow | -1.44B | -1.24B | -75.60M | -6.47B | -4.42B |
| Investing Activities Purchase Of Investments | N/A | N/A | -35.40M | -50.00M | -78.20M |
| Investing Activities Sale Of Investments | N/A | N/A | 0.00 | 5.20M | 0.00 |
| Financing Activities Common Stock Repurchase | N/A | N/A | N/A | N/A | N/A |
Source: Financial statements and regulatory filings
Technical Analysis
Key Insights
- The current trend shows a stable upward movement with price consolidating near ₹471, supported by higher lows in recent sessions.
- Key support levels are identified near ₹440 and ₹400, with resistance around the 52-week high of ₹523.
- The stock price is trading above the 200-day moving average (₹399) and close to the 50-day moving average (₹440), indicating medium-term bullish momentum.
- Momentum indicators show RSI near neutral levels around 55, MACD is slightly positive, and Stochastic oscillators suggest potential for further upward movement.
- Daily and weekly charts confirm a steady uptrend, while monthly charts indicate longer-term consolidation with gradual strength buildup.
- Potential scenarios include continuation of the upward trend if support holds, or sideways movement if resistance near ₹523 limits gains in the short term.
Trending News
1. Headline: Q4 Results This Week: Bharti Airtel, HAL, Tata Motors, Cochin Shipyard, Premier Energies, ITC Hotels And More
Summary: PVR Inox, Dixon Technologies, Dr Reddys Laboratories, Tata Steel, Cipla, JSW Steel and NCC, among others will declare earnings from May 11 and 16.
Sentiment: neutral
2. Headline: Q4 results: Blue Dart, Birla Corp, and Affle 3I among 33 firms on May 9 | Company Results - Business Standard
Summary: Q4FY26 company results: Firms including Gujarat Ambuja Exports, Advanced Enzyme Technologies, D-Link (India), and Aarti Surfactants are also to release their January-March earnings today
Sentiment: neutral
Summary: Last week saw the newest annual earnings release from Aarti Industries Limited ( NSE:AARTIIND ), an important milestone...
Sentiment: positive
4. Headline: Aarti Industries Ltd: Valuation Shift Enhances Price Attractiveness Amid Mixed Returns
Summary: Aarti Industries is classified as a small-cap stock, which typically entails higher volatility but also greater growth potential. The recent upgrade in its Mojo Grade from Sell to Hold on 9 March 2026, with a current Mojo Score of 68.0, reflects a more favourable outlook by MarketsMOJO analysts. This upgrade aligns with the valuation shift and improved relative price attractiveness, signalling cautious optimism among market participants. Why settle for Aarti Industries Ltd...
Sentiment: positive
5. Headline: Accumulate Aarti Industries; target of Rs 529: Prabhudas Lilladher- Moneycontrol.com
Summary: Prabhudas Lilladher recommended Accumulate rating on Aarti Industries with a target price of Rs 529 in its research report dated May 05, 2026.
Sentiment: neutral
Recent Updates
News Summary
As of 2026-05-12. Aarti Industries reported strong financial results for fiscal year 2026, with revenue reaching ₹9,018 crore, representing a 12% year-on-year increase. The company demonstrated significant growth in EBITDA and PAT, indicating improved operational efficiency and profitability. In Q4 2026, despite global headwinds, Aarti Industries achieved 12% revenue growth and secured key strategic contracts, highlighting its resilience in a challenging macroeconomic environment. Margin expansion was notable, with operating margins reaching a record 15.46%, driving a 42.71% year-on-year increase in net profit to ₹137 crore. These developments underscore the company’s ability to maintain growth momentum and strengthen its market position.
News Sentiment
The overall sentiment from recent updates is positive, driven by robust revenue growth, margin expansion, and successful contract acquisitions. The company’s ability to deliver a 12% increase in revenue and significant profit growth despite macroeconomic challenges reflects operational strength. Positive margin trends and strategic milestones contribute to a constructive outlook, although ongoing global headwinds remain a consideration. This balanced but optimistic tone is supported by multiple sources highlighting improved financial performance and market positioning.
Source List
- https://www.investywise.com/aarti-industries-q4-fy26-performance-update/
- https://www.investywise.com/aarti-industries-q4-and-annual-fy26-results/
Analytical Overview
Analysis Summary
Aarti Industries’ valuation metrics show a trailing P/E of 42.18 and forward P/E of 23.87, which are above the industry average P/E of 42.18 but reflect expected earnings growth. The PEG ratio of 0.21 suggests the stock may be undervalued relative to its growth prospects. Revenue growth of 26% quarterly and 12% annually, alongside positive free cash flow of ₹4.19 billion, indicates a strong growth trajectory supported by improving operational efficiency. The company’s financial health is moderate, with a debt-to-equity ratio of 0.70 and a current ratio below 1 at 0.83, signaling some liquidity constraints but manageable leverage. Sector-specific challenges include raw material price volatility and regulatory compliance, while opportunities arise from expanding specialty chemical demand in India and global markets. Considering India-specific factors, the company benefits from a growing domestic chemicals market and favorable government policies supporting manufacturing and exports.
Overall Business and Market Assessment
Supporting Factors: robust revenue and earnings growth, strong margin expansion, and positive free cash flow generation
Risk Factors: the company’s liquidity position given a current ratio below 1 and exposure to raw material cost fluctuations
SWOT Analysis
Strengths
- Strong revenue growth with a 26% quarterly increase and 12% annual rise.
- Robust operational margins with gross margin at 40.09% and operating margin at 8.84%.
- Significant market presence in specialty chemicals with advanced R&D capabilities.
- Positive free cash flow of ₹4.19 billion indicating operational cash generation.
Weaknesses
- Current ratio below 1 at 0.83, indicating potential short-term liquidity constraints.
- High trailing P/E ratio of 42.18, suggesting premium valuation.
- Negative operating cash flow of ₹-2.68 billion despite positive free cash flow.
- Return on equity at 7.04% is modest compared to industry peers.
Opportunities
- Growing demand for specialty chemicals in domestic and international markets.
- Favorable government policies supporting manufacturing and exports in India.
- Potential for margin improvement through pricing discipline and operational efficiencies.
- Expansion of strategic contracts and partnerships enhancing market position.
Threats
- Volatility in raw material prices impacting cost structures.
- Regulatory changes and compliance requirements in chemical manufacturing.
- Competitive pressures from domestic and global specialty chemical producers.
- Macroeconomic uncertainties affecting global supply chains and demand.
Company Description
Aarti Industries Ltd. is a leading Indian chemical manufacturer specializing in the production of specialty chemicals and pharmaceuticals. The company's primary focus lies in creating a diverse portfolio of high-performance chemicals that serve various industries including agrochemicals, polymers, pigments, and pharmaceuticals. Notable for its robust capabilities in chemistry, Aarti Industries Ltd. provides crucial intermediates that support global industrial applications ranging from manufacture of dyes and pigments, additives, to those required in healthcare and agrichemicals. The company is strategically significant in the chemical supply chain, enabling sectors to enhance product performance and efficiency. Headquartered in Mumbai, India, Aarti Industries Ltd. leverages cutting-edge technology and infrastructure, ensuring compliance with rigorous safety and environmental standards. Its expansive production and R&D facilities allow for continuous innovation and adaptability, reinforcing its market position both domestically and internationally. As such, Aarti Industries Ltd. plays a pivotal role in bridging raw chemical production and end-user product transformations across multiple industry sectors.