


Aarti Industries Ltd (AARTIIND)
Stock Analysis Report
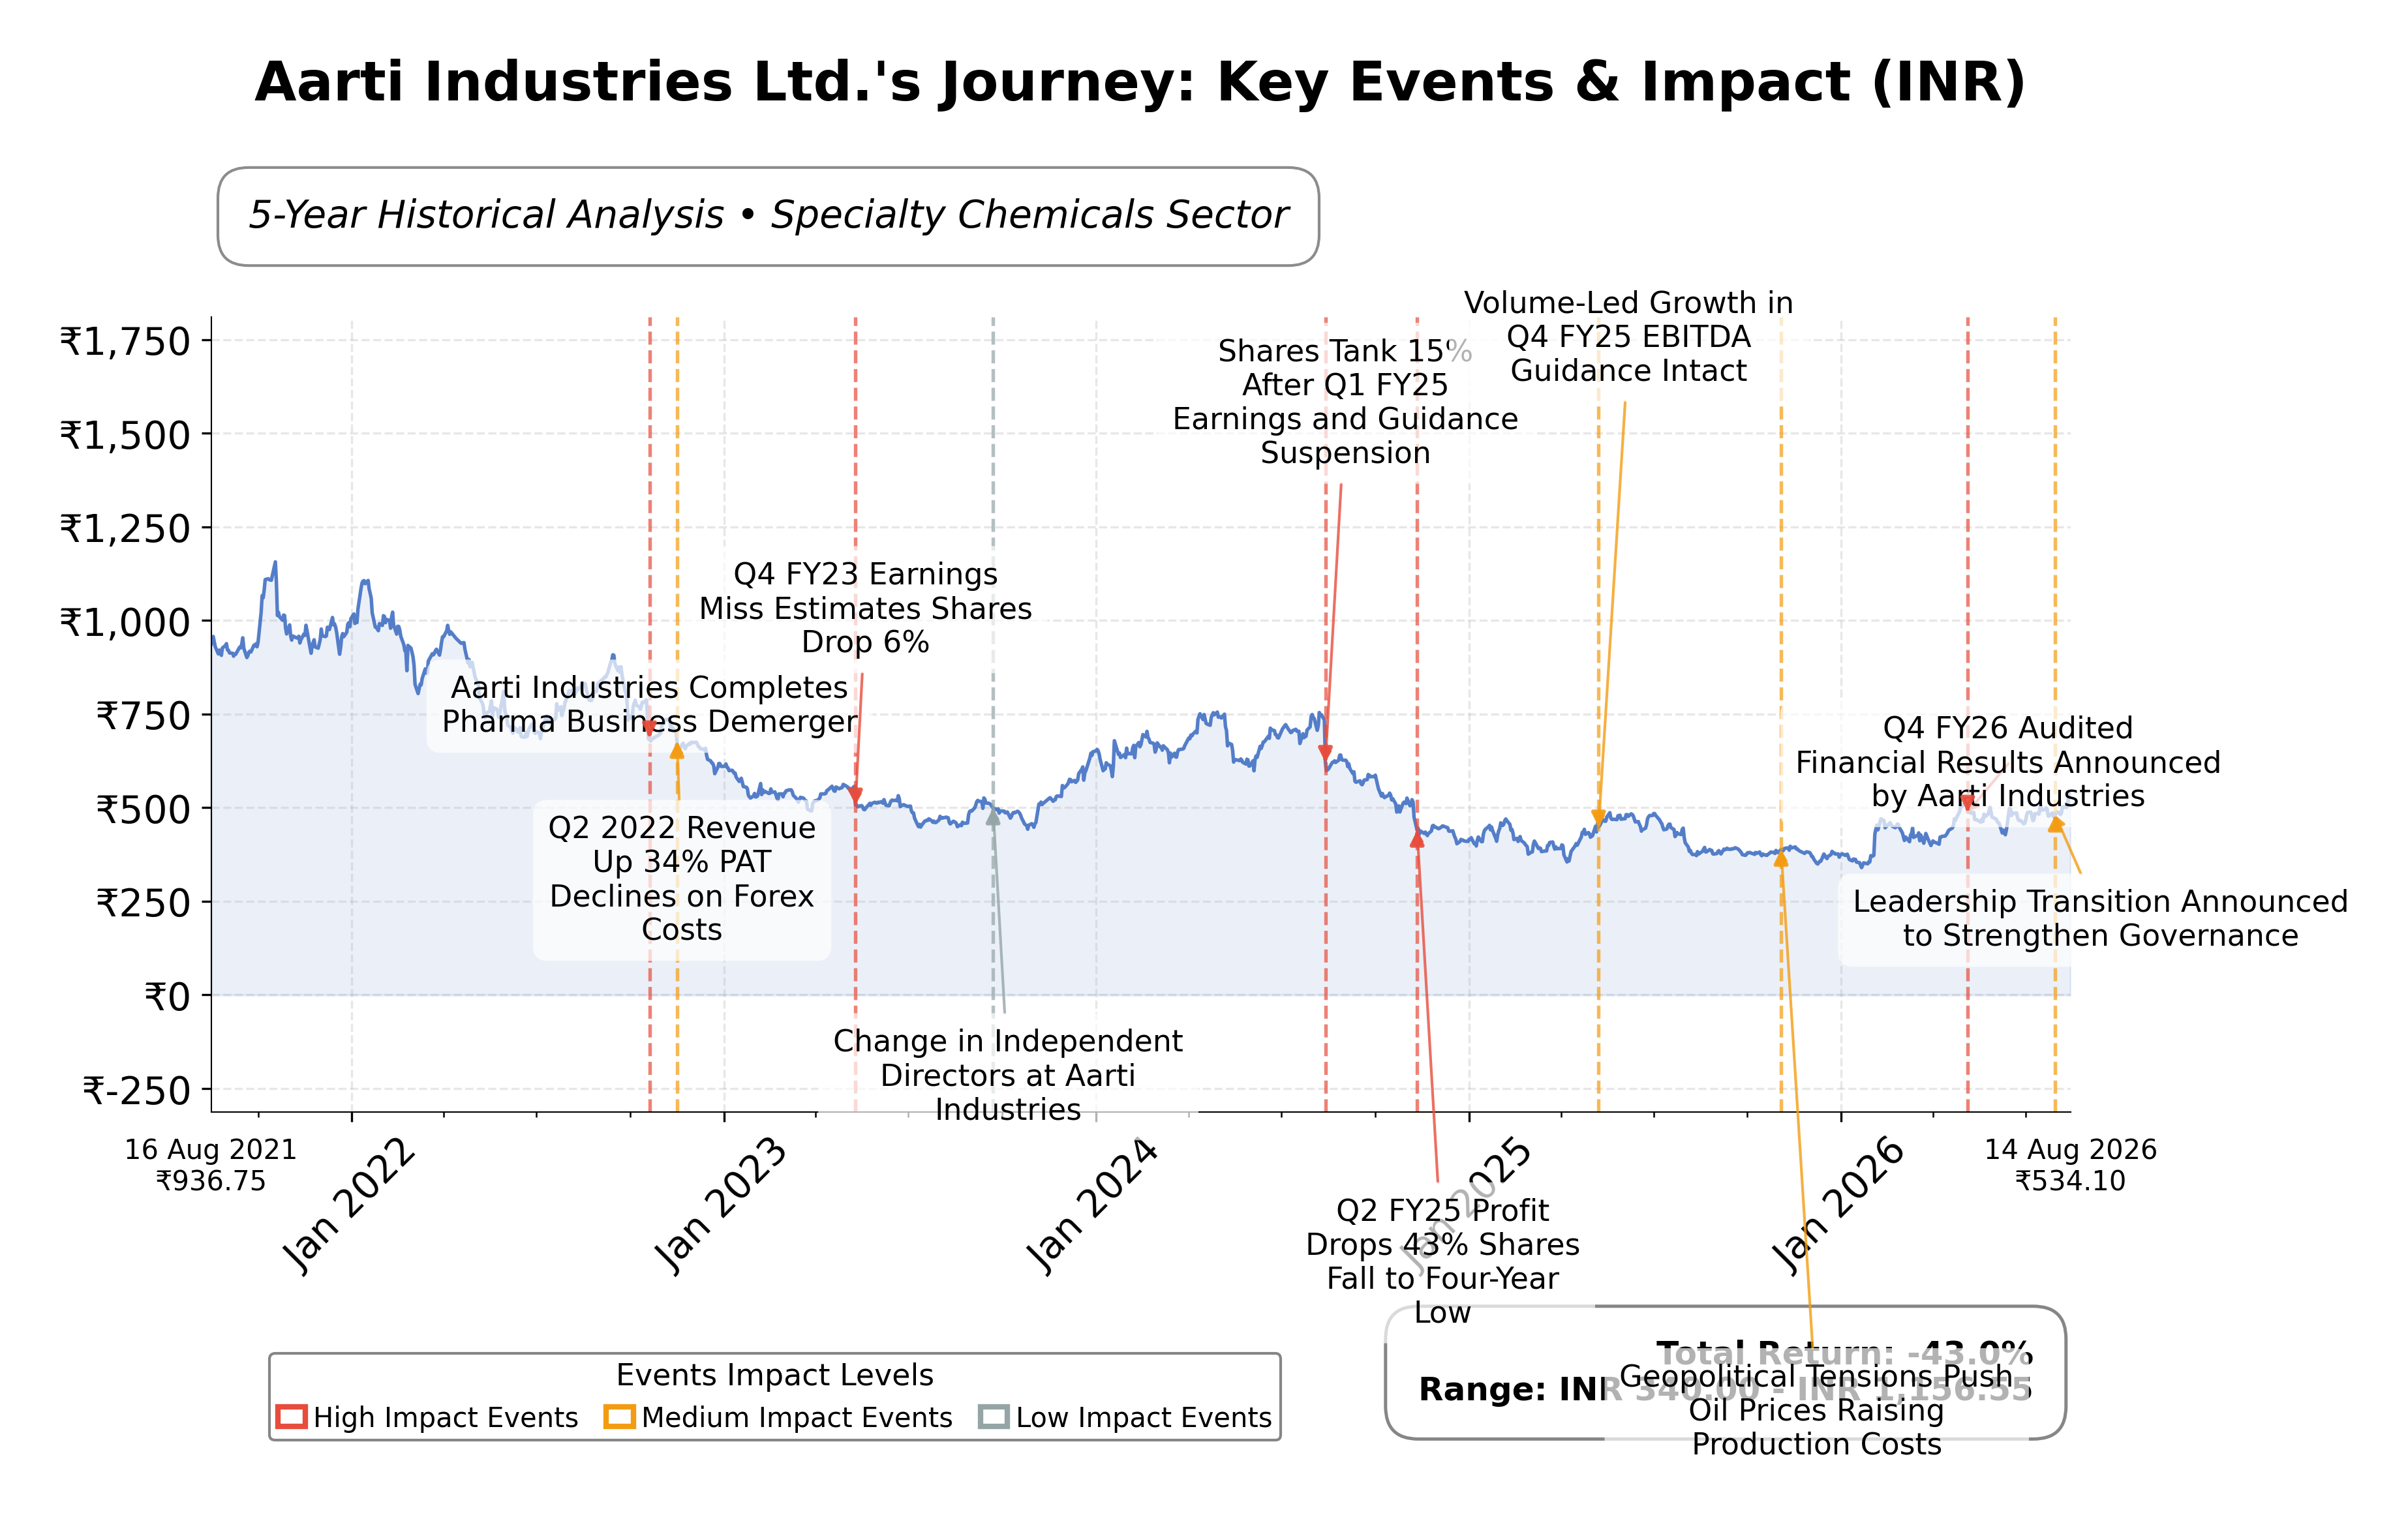
Stock Journey
Key Positives and Key Risks
Pros
- Aarti Industries exhibits a revenue growth rate of 13.2%, indicating a solid growth trajectory within the specialty chemicals sector.
- The company maintains a strong gross margin of 40.1%, reflecting operational efficiency and pricing power.
- The forward P/E ratio of 23.75 suggests market expectations of earnings growth and a more attractive valuation compared to the trailing P/E of 42.67.
Cons
- The current ratio of 0.83 signals potential liquidity constraints that could affect short-term financial flexibility.
- Negative free cash flow of approximately ₹-6.46 billion highlights significant capital expenditure or working capital demands.
- Return on equity at 7.25% is relatively low compared to industry peers, indicating limited profitability efficiency.
Disclosure: This information is for general awareness and does not constitute investment advice
Report Summary
Aarti Industries Ltd. is a prominent Indian chemical manufacturer specializing in specialty chemicals and pharmaceuticals. Listed on the NSE under the Basic Materials sector, the company serves diverse industries such as agrochemicals, polymers, pigments, and healthcare. With headquarters in Mumbai, it leverages advanced technology and extensive R&D capabilities to maintain a strong market position domestically and internationally. The company plays a critical role in the chemical supply chain by providing high-performance intermediates essential for various industrial applications.
Financially, Aarti Industries reported trailing twelve months revenue of approximately ₹82.86 billion with a gross margin of 40.1%, operating margin near 9.8%, and a net profit margin of 5.06%. The return on equity (ROE) stands at 7.25%, while return on assets (ROA) is 3.47%, reflecting moderate profitability and asset utilization efficiency. The company’s operating cash flow totaled ₹7.81 billion, although free cash flow was negative at about ₹-6.46 billion, indicating capital expenditure or working capital investments.
Valuation metrics show a trailing price-to-earnings (P/E) ratio of 42.67 and a forward P/E of 23.75, suggesting the market anticipates earnings growth. The price-to-book (P/B) ratio is 2.89, and the enterprise value to EBITDA (EV/EBITDA) stands at 18.80, positioning the stock at a premium relative to some peers. The market capitalization is approximately ₹173.31 billion, with the current share price at ₹534.10, near the 52-week high of ₹523.10, indicating recent strength in price performance.
Key strengths include a diversified product portfolio, robust gross margins, and strategic industry positioning. The company maintains a manageable debt-to-equity ratio of 0.83, though the current ratio of 0.83 suggests liquidity constraints. Risks involve sector-specific regulatory challenges, competitive pressures in specialty chemicals, and macroeconomic factors impacting raw material costs. No recent strategic partnerships or leadership changes were reported, maintaining operational continuity.
Technically, the stock is trading above its 50-day and 200-day moving averages, with a beta of 0.59 indicating relatively low volatility. Momentum indicators and multi-timeframe analyses suggest a stable upward trend, though the current price is near resistance levels. Overall, the data portrays a balanced scenario where market participants may consider monitoring developments closely, as conditions reflect a mix of growth potential and valuation considerations.
Company and Industry Overview
Company Basics
Price Performance
Company Size
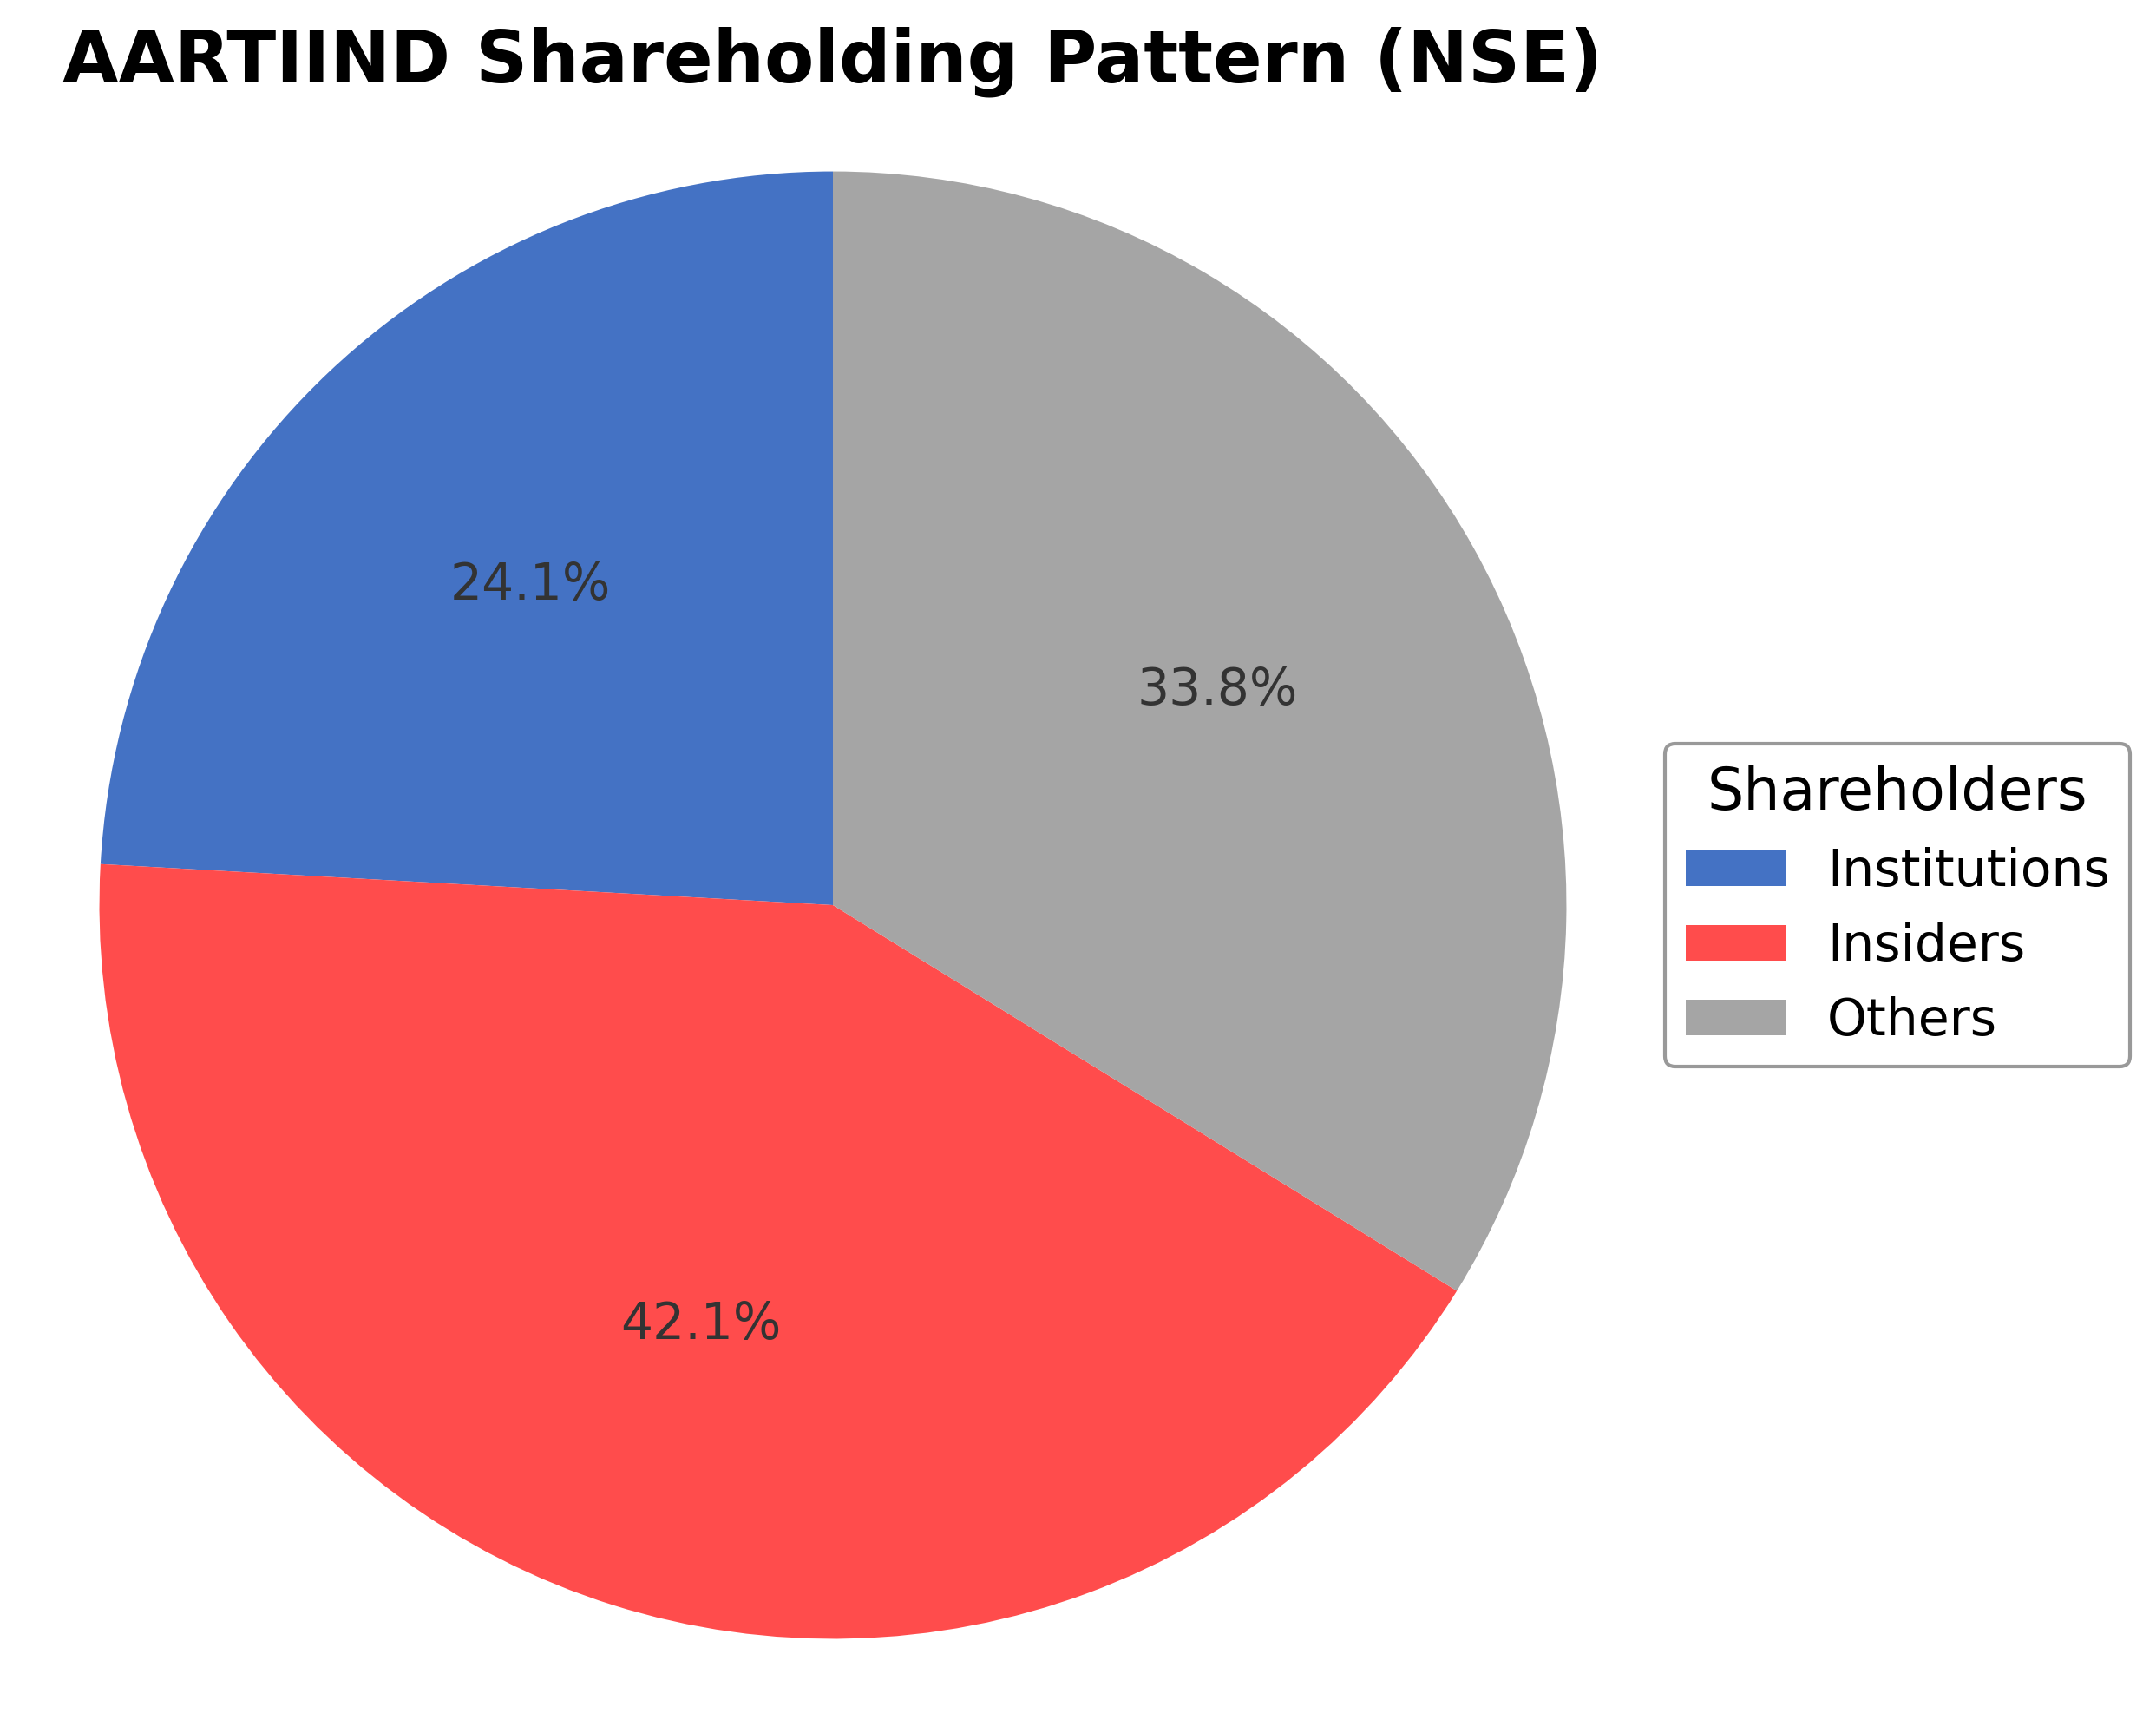
Shareholding Pattern
Sector and Industry Analysis
The chemical sector in India is a significant contributor to the economy, with a diverse product range including specialty and basic chemicals. It has demonstrated steady growth, driven by increasing domestic demand and export opportunities, with market size expanding alongside industrial and consumer sectors. Major players include large integrated firms and specialty chemical manufacturers, with companies like Aarti Industries holding strong positions in niche segments such as Nitro Chloro Benzenes (NCB).
Industry trends highlight a shift towards specialty chemicals due to higher margins and value addition compared to commodity chemicals. Competitive dynamics are shaped by technological capabilities, scale of operations, and supply chain integration, which create high barriers to entry. Companies with diversified product portfolios and strong R&D, such as Aarti Industries, maintain competitive advantages in this evolving landscape.
The regulatory environment for the chemical industry is governed by environmental, safety, and export-import policies, which influence operational costs and market access. Compliance with pollution control norms and hazardous chemical handling standards is critical, impacting capital expenditure and ongoing operations. The outlook remains cautiously positive as regulatory frameworks evolve to balance growth with sustainability and safety concerns.
Note: Analysis synthesized from industry research, market reports, and regulatory filings. Information is subject to change based on market conditions.
Illustrative Scenario Analysis
DCF Assumptions:
Method: Two-Stage EPS-Priority Model
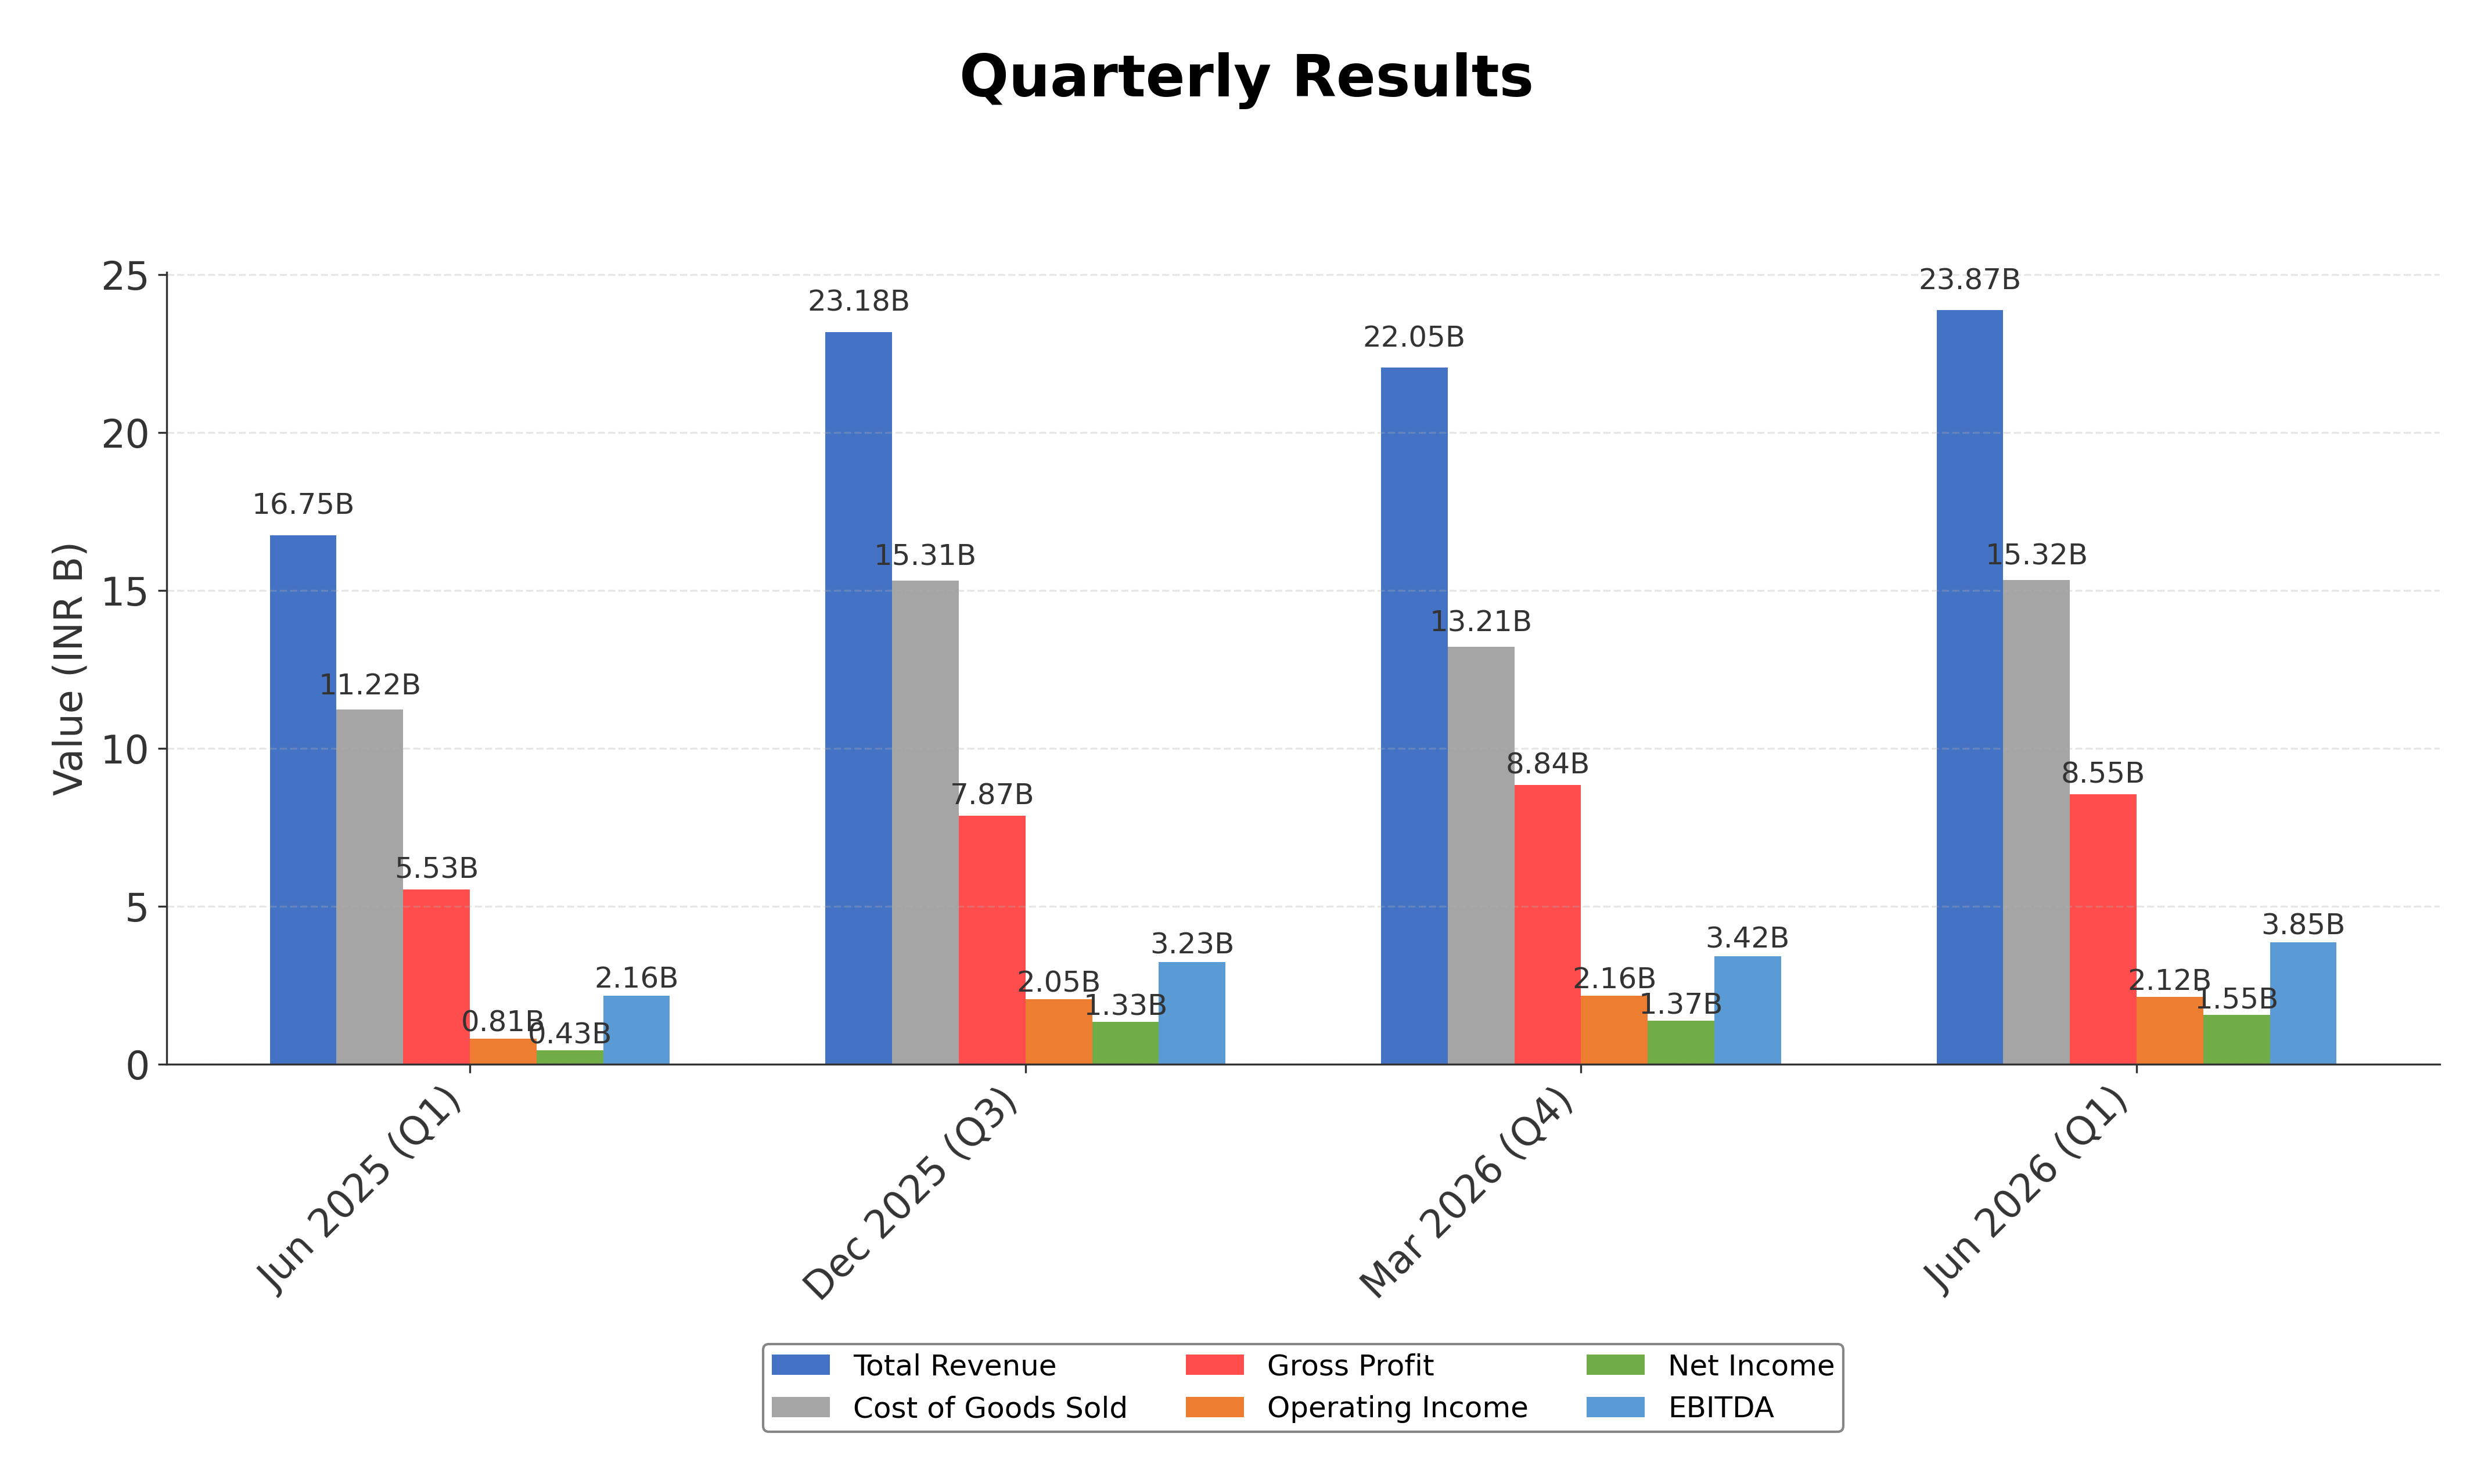
Financials
Peer Analysis
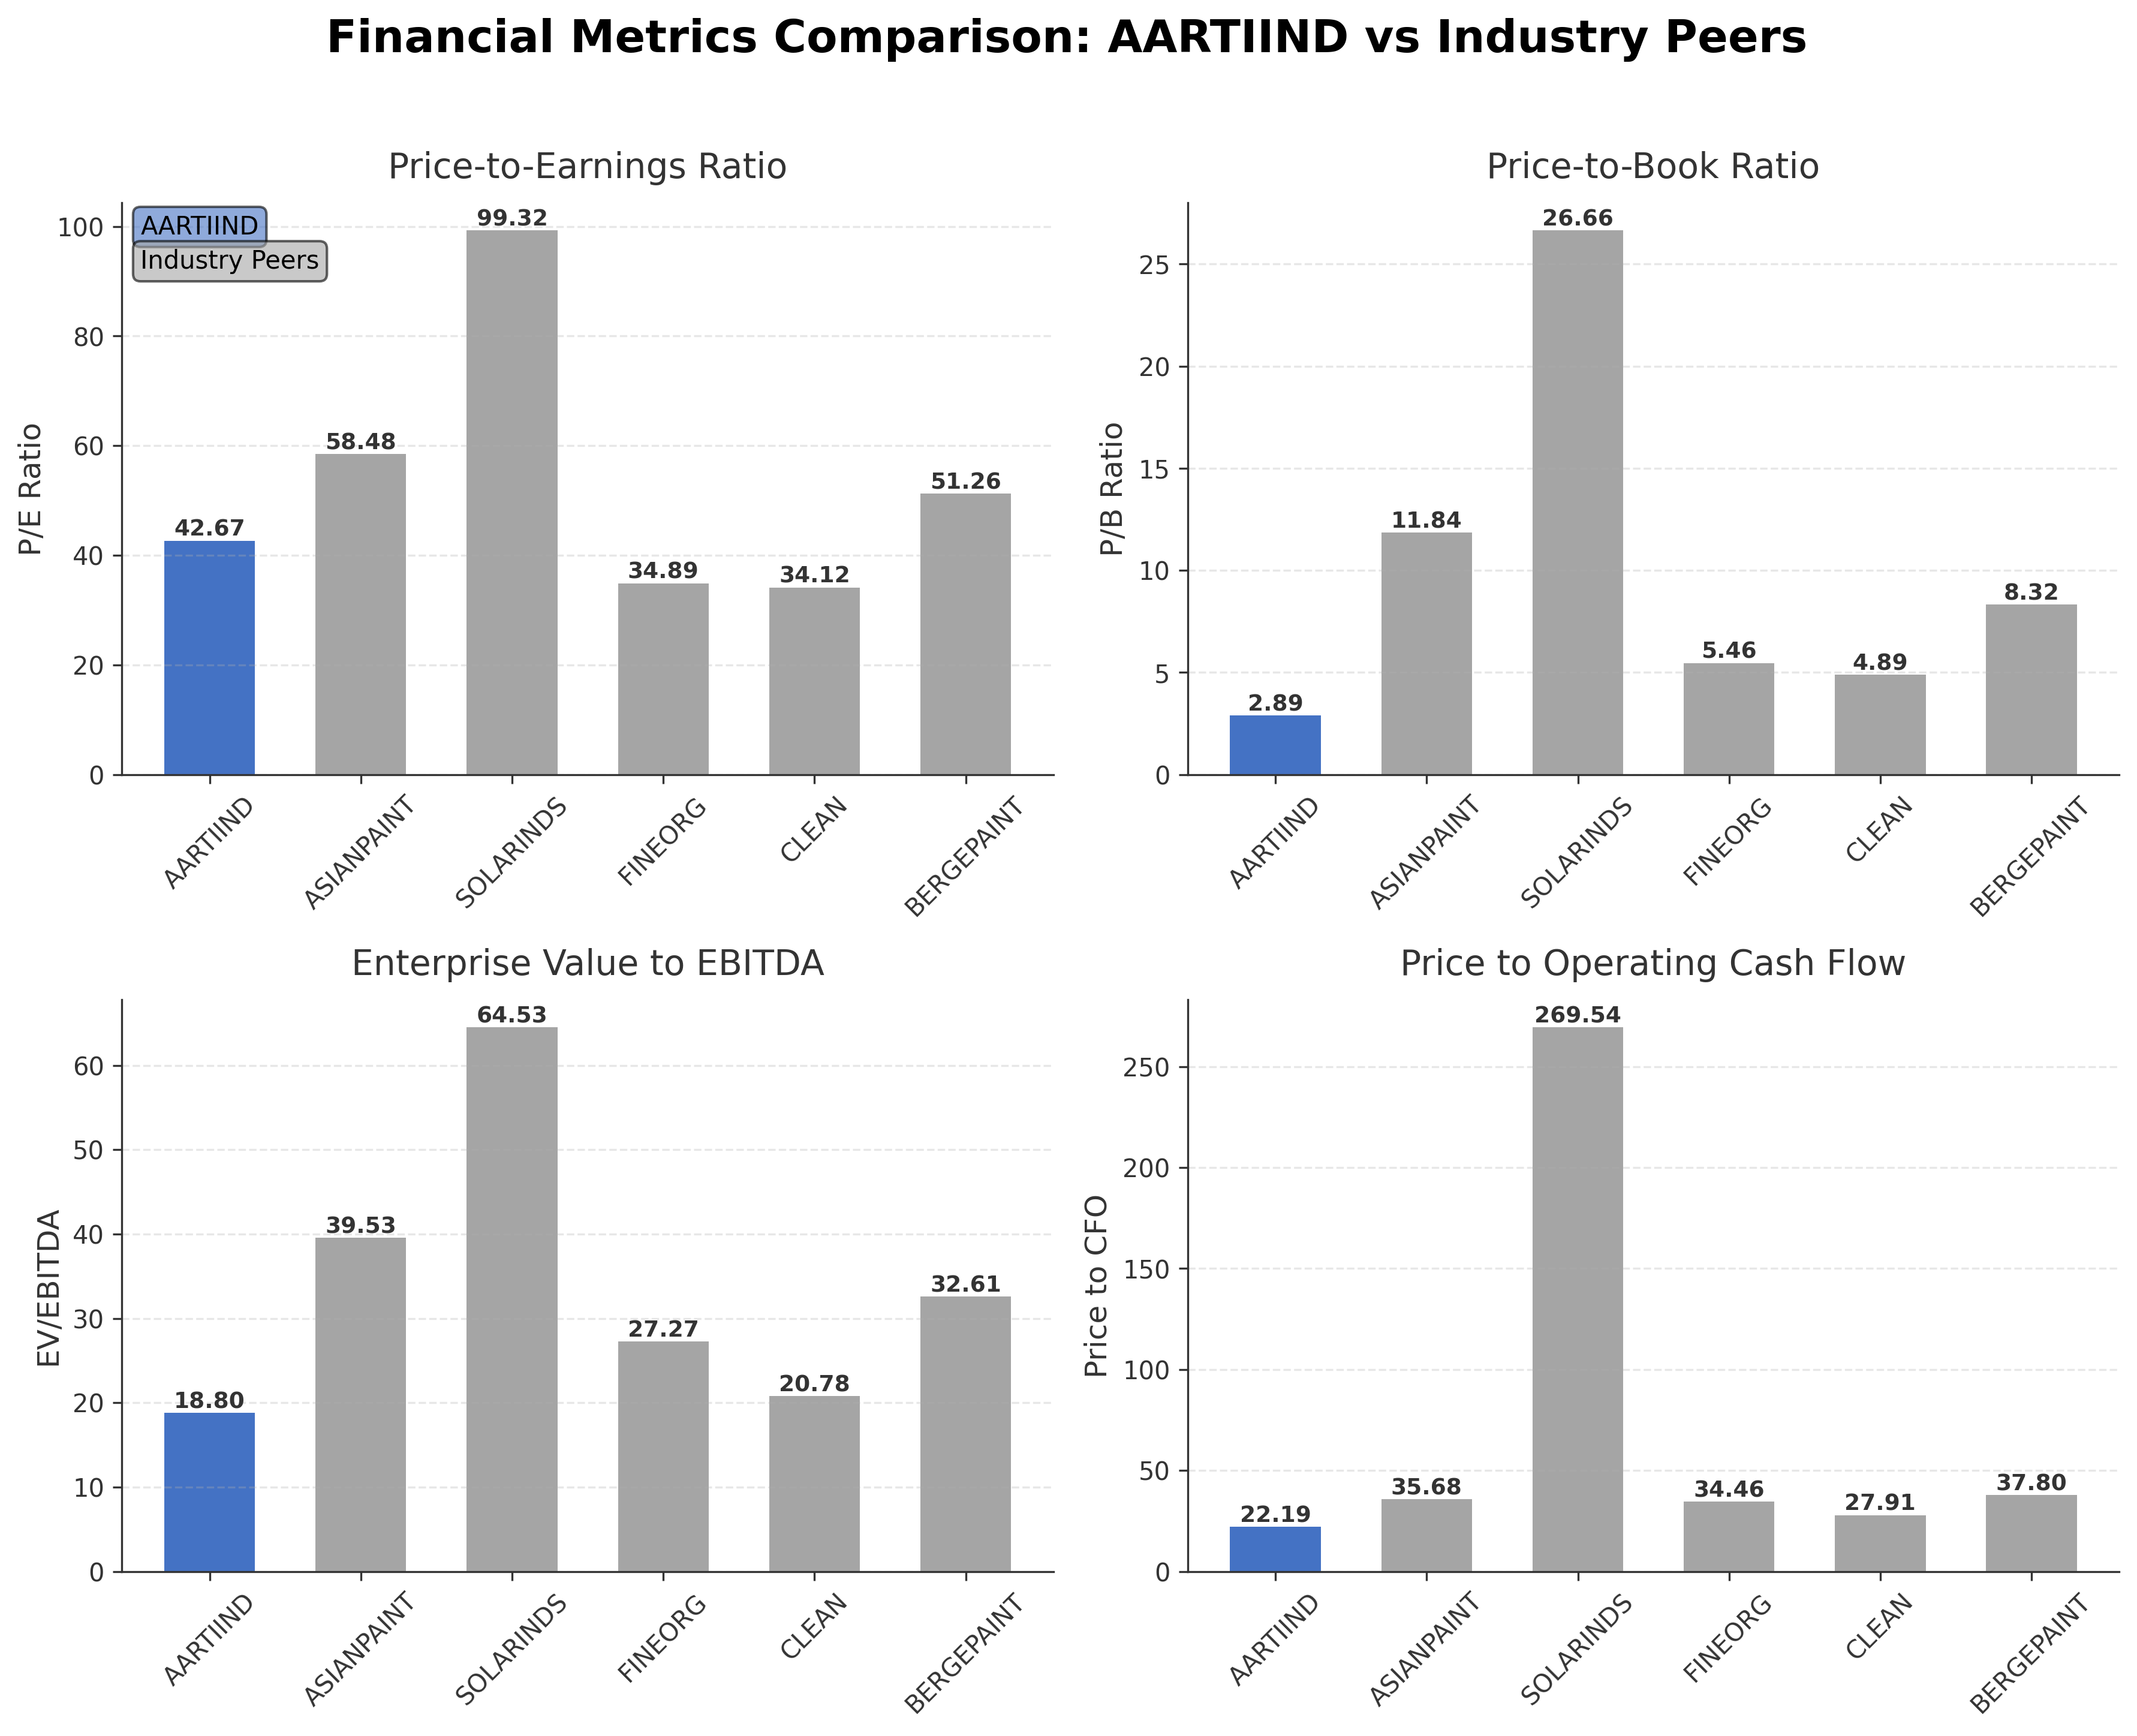
| Company Name | Market Cap | P/E Ratio | P/B Ratio | EV/EBITDA | Price to CFO |
|---|---|---|---|---|---|
| Aarti Industries Ltd. | ₹173.31B | 42.67 | 2.89 | 18.80 | 22.19 |
| Asian Paints Ltd. | ₹2.53T | 58.48 | 11.84 | 39.53 | 35.68 |
| Solar Industries India Ltd. | ₹1.67T | 99.32 | 26.66 | 64.53 | 269.54 |
| Fine Organic Industries Ltd. | ₹148.04B | 34.89 | 5.46 | 27.27 | 34.46 |
| Clean Science & Technology Ltd. | ₹76.63B | 34.12 | 4.89 | 20.78 | 27.91 |
| Berger Paints India Ltd | ₹582.07B | 51.26 | 8.32 | 32.61 | 37.80 |
Comparison Analysis: Aarti Industries Ltd. exhibits a moderate market capitalization of ₹173.31 billion relative to its peers, with a trailing P/E ratio of 42.67 which is lower than Asian Paints and Solar Industries but higher than Fine Organic and Clean Science. Its P/B ratio of 2.89 is notably lower than most peers, indicating a more conservative valuation on book value. The EV/EBITDA multiple of 18.80 is also below the sector heavyweights, suggesting relatively better valuation metrics. However, its return on equity at 7.25% is significantly lower than peer averages, reflecting room for improvement in profitability. Overall, Aarti Industries maintains competitive valuation levels but lags peers in return metrics.
Financial Metrics Comparison with Peers
Financial Statements
Comprehensive financial data including income, balance sheet, and cash flow metrics
Income Statement
| fiscal_date | 2026-03-31 | 2025-03-31 | 2024-03-31 | 2023-03-31 | 2022-03-31 |
|---|---|---|---|---|---|
| Sales | 82.86B | 72.69B | 61.93B | 64.92B | 51.91B |
| Cost Of Goods | 53.49B | 46.55B | 46.55B | 46.95B | 36.02B |
| Gross Profit | 29.37B | 26.14B | 15.38B | 17.98B | 15.89B |
| Operating Expense Other Operating Expenses | 13.64B | 11.67B | 11.12B | 13.03B | 19.40B |
| Operating Income | 6.77B | 5.66B | 6.23B | 7.96B | 14.86B |
| Non Operating Interest Expense | 3.40B | 2.75B | 1.83B | 1.06B | 686.30M |
| Pretax Income | 3.65B | 3.07B | 3.95B | 6.11B | 13.72B |
| Income Tax | -540.00M | -230.00M | -210.50M | 658.70M | 1.86B |
| Net Income | 4.19B | 3.31B | 4.16B | 5.45B | 11.86B |
| Eps Basic | 11.56 | 9.13 | 11.49 | 15.04 | 32.71 |
| Eps Diluted | 11.55 | 9.12 | 11.49 | 15.04 | 32.71 |
| Basic Shares Outstanding | 362.46M | 362.54M | 362.50M | 362.50M | 362.50M |
| Diluted Shares Outstanding | 362.46M | 362.54M | 362.50M | 362.50M | 362.50M |
| Ebit | 7.05B | 5.82B | 5.79B | 7.17B | 14.41B |
| Ebitda | 11.72B | 10.14B | 9.62B | 10.28B | 16.87B |
| Net Income Continuous Operations | 3.58B | 3.05B | 3.95B | 6.11B | 13.72B |
| Minority Interests | 0.00 | 0.00 | 0.00 | 0.00 | -2.30M |
| Preferred Stock Dividends | 0.00 | 0.00 | 0.00 | 0.00 | 0.00 |
| Operating Expense Selling General And Administrative | N/A | 4.35B | 3.09B | 4.31B | 3.87B |
| Non Operating Interest Income | N/A | 149.50M | 70.90M | 0.00 | N/A |
Data provided by Twelve Data
Balance Sheet
| fiscal_date | 2026-03-31 | 2025-03-31 | 2024-03-31 | 2023-03-31 | 2022-03-31 |
|---|---|---|---|---|---|
| Cash And Cash Equivalents | 5.83B | 1.99B | 417.80M | 1.67B | 936.30M |
| Accounts Receivable | 14.03B | 7.86B | 8.26B | 9.40B | 10.92B |
| Total Assets | 132.99B | 111.14B | 96.16B | 85.81B | 78.51B |
| Total Liabilities | 73.44B | 55.08B | 43.25B | 36.60B | 33.33B |
| Long Term Debt | 22.22B | 19.15B | 15.73B | 6.60B | 9.45B |
| Shareholders Equity | 59.55B | 56.05B | 52.90B | 49.21B | 45.17B |
Data provided by Twelve Data
Cash Flow Statement
| fiscal_date | 2026-03-31 | 2025-03-31 | 2024-03-31 | 2023-03-31 | 2022-03-31 |
|---|---|---|---|---|---|
| Operating Activities Net Income | 3.58B | 3.05B | 3.95B | 6.11B | 13.72B |
| Operating Activities Stock Based Compensation | 100.00M | 70.00M | N/A | N/A | N/A |
| Operating Activities Other Non Cash Items | 3.36B | 2.59B | 1.95B | 1.13B | 766.00M |
| Operating Activities Accounts Receivable | -6.93B | 310.00M | 685.50M | 4.22B | -4.98B |
| Operating Activities Other Assets Liabilities | -2.79B | -3.50B | -1.29B | -969.20M | -4.20B |
| Operating Activities Operating Cash Flow | 7.81B | 12.42B | 5.30B | 10.50B | 5.31B |
| Investing Activities Net Acquisitions | -640.00M | -230.00M | 0.00 | 0.00 | 0.00 |
| Investing Activities Other Investing Activity | -11.32B | -13.79B | 400.00K | 600.00K | 500.00K |
| Investing Activities Investing Cash Flow | -11.96B | -14.02B | -13.04B | -13.30B | -11.69B |
| Financing Activities Long Term Debt Issuance | 12.51B | 7.04B | 12.92B | 15.27B | N/A |
| Financing Activities Long Term Debt Payments | -2.42B | -4.55B | -9.82B | -12.21B | N/A |
| Financing Activities Common Stock Issuance | -110.00M | -100.00M | N/A | 0.00 | 11.87B |
| Financing Activities Common Dividends | -360.00M | -360.00M | -543.80M | -906.30M | -1.27B |
| Financing Activities Financing Cash Flow | 9.62B | 2.02B | 2.54B | 2.15B | 10.60B |
| End Cash Position | 5.83B | 1.99B | 1.30B | 2.01B | 1.74B |
| Free Cash Flow | 7.81B | 12.42B | -1.24B | -75.60M | -6.47B |
| Financing Activities Other Financing Charges | N/A | -10.00M | -10.00M | N/A | N/A |
| Investing Activities Capital Expenditures | N/A | N/A | -13.04B | -13.26B | -11.65B |
| Investing Activities Purchase Of Investments | N/A | N/A | N/A | -35.40M | -50.00M |
| Investing Activities Sale Of Investments | N/A | N/A | N/A | 0.00 | 5.20M |
Data provided by Twelve Data
Technical Analysis
Key Insights
- Aarti Industries is currently exhibiting an upward trend with price action above key moving averages, indicating bullish momentum.
- Key support levels are identified near ₹475 and ₹425, while resistance is observed around the 52-week high near ₹523.
- The stock price is trading above the 10-day, 50-day (₹474.87), and 200-day (₹424.93) moving averages, signaling sustained positive momentum.
- Momentum indicators show RSI in a neutral to slightly overbought range, MACD remains positive, and stochastic oscillators suggest potential consolidation.
- Multi-timeframe analysis across daily, weekly, and monthly charts confirms a consistent uptrend with minor pullbacks.
- Current technical setup suggests potential for continued upward movement if support levels hold, with caution warranted near resistance zones.
Recent Updates
News Summary
As of the latest available data, there are no recent significant news updates for Aarti Industries Ltd. covering earnings, leadership changes, strategic partnerships, or regulatory developments within the past three months. The absence of material news indicates a period of operational stability without major corporate events or market-moving disclosures.
News Sentiment
The overall sentiment from recent updates is neutral due to the lack of new information or announcements. This suggests a steady state in business operations and market perception without notable positive or negative catalysts influencing the stock.
Source List
Analytical Overview
Analysis Summary
Aarti Industries’ valuation metrics, including a trailing P/E of 42.67 and forward P/E of 23.75, are generally in line with the specialty chemicals industry average P/E of 42.67, indicating fair market pricing relative to earnings expectations. The company demonstrates a healthy revenue growth rate of 13.2% and positive quarterly earnings growth of 42.9%, supporting a favorable growth trajectory. Financial health shows a debt-to-equity ratio of 0.83 and operating cash flow of ₹7.81 billion, though free cash flow is negative, reflecting ongoing capital investments. Sector-specific challenges include regulatory compliance and raw material cost volatility, while opportunities arise from expanding specialty chemical demand in India’s growing industrial base. The company benefits from India’s evolving regulatory environment and increasing focus on chemical innovation, which may support long-term growth prospects.
Overall Business and Market Assessment
Supporting Factors: solid revenue growth, reasonable valuation relative to peers, and a diversified product portfolio
Risk Factors: liquidity constraints indicated by a current ratio below 1 and negative free cash flow, which may impact operational flexibility
SWOT Analysis
Strengths
- A diversified portfolio in specialty chemicals and pharmaceuticals supports revenue stability.
- Strong gross margin of 40.1% reflects efficient production capabilities.
- Robust operating cash flow of ₹7.81 billion underpins operational strength.
- Strategic market positioning in India’s growing chemical industry enhances competitive advantage.
Weaknesses
- Current ratio of 0.83 indicates potential short-term liquidity challenges.
- Negative free cash flow of ₹-6.46 billion suggests high capital expenditure or working capital needs.
- Return on equity at 7.25% is below industry peers, indicating room for profitability improvement.
- Moderate debt-to-equity ratio of 0.83 could constrain financial flexibility.
Opportunities
- Growing demand for specialty chemicals in agrochemical and pharmaceutical sectors offers expansion potential.
- Technological advancements and R&D investments can drive product innovation.
- Favorable regulatory environment in India supports industry growth.
- Potential to increase institutional ownership and market confidence.
Threats
- Volatility in raw material prices may impact margins.
- Intense competition within specialty chemicals sector could pressure market share.
- Regulatory changes and compliance costs may increase operational expenses.
- Macroeconomic uncertainties in India could affect demand and supply chains.
Company Description
Aarti Industries Ltd. is a leading Indian chemical manufacturer specializing in the production of specialty chemicals and pharmaceuticals. The company's primary focus lies in creating a diverse portfolio of high-performance chemicals that serve various industries including agrochemicals, polymers, pigments, and pharmaceuticals. Notable for its robust capabilities in chemistry, Aarti Industries Ltd. provides crucial intermediates that support global industrial applications ranging from manufacture of dyes and pigments, additives, to those required in healthcare and agrichemicals. The company is strategically significant in the chemical supply chain, enabling sectors to enhance product performance and efficiency. Headquartered in Mumbai, India, Aarti Industries Ltd. leverages cutting-edge technology and infrastructure, ensuring compliance with rigorous safety and environmental standards. Its expansive production and R&D facilities allow for continuous innovation and adaptability, reinforcing its market position both domestically and internationally. As such, Aarti Industries Ltd. plays a pivotal role in bridging raw chemical production and end-user product transformations across multiple industry sectors.