
Aarti Industries Ltd (AARTIIND)
Stock Analysis Report
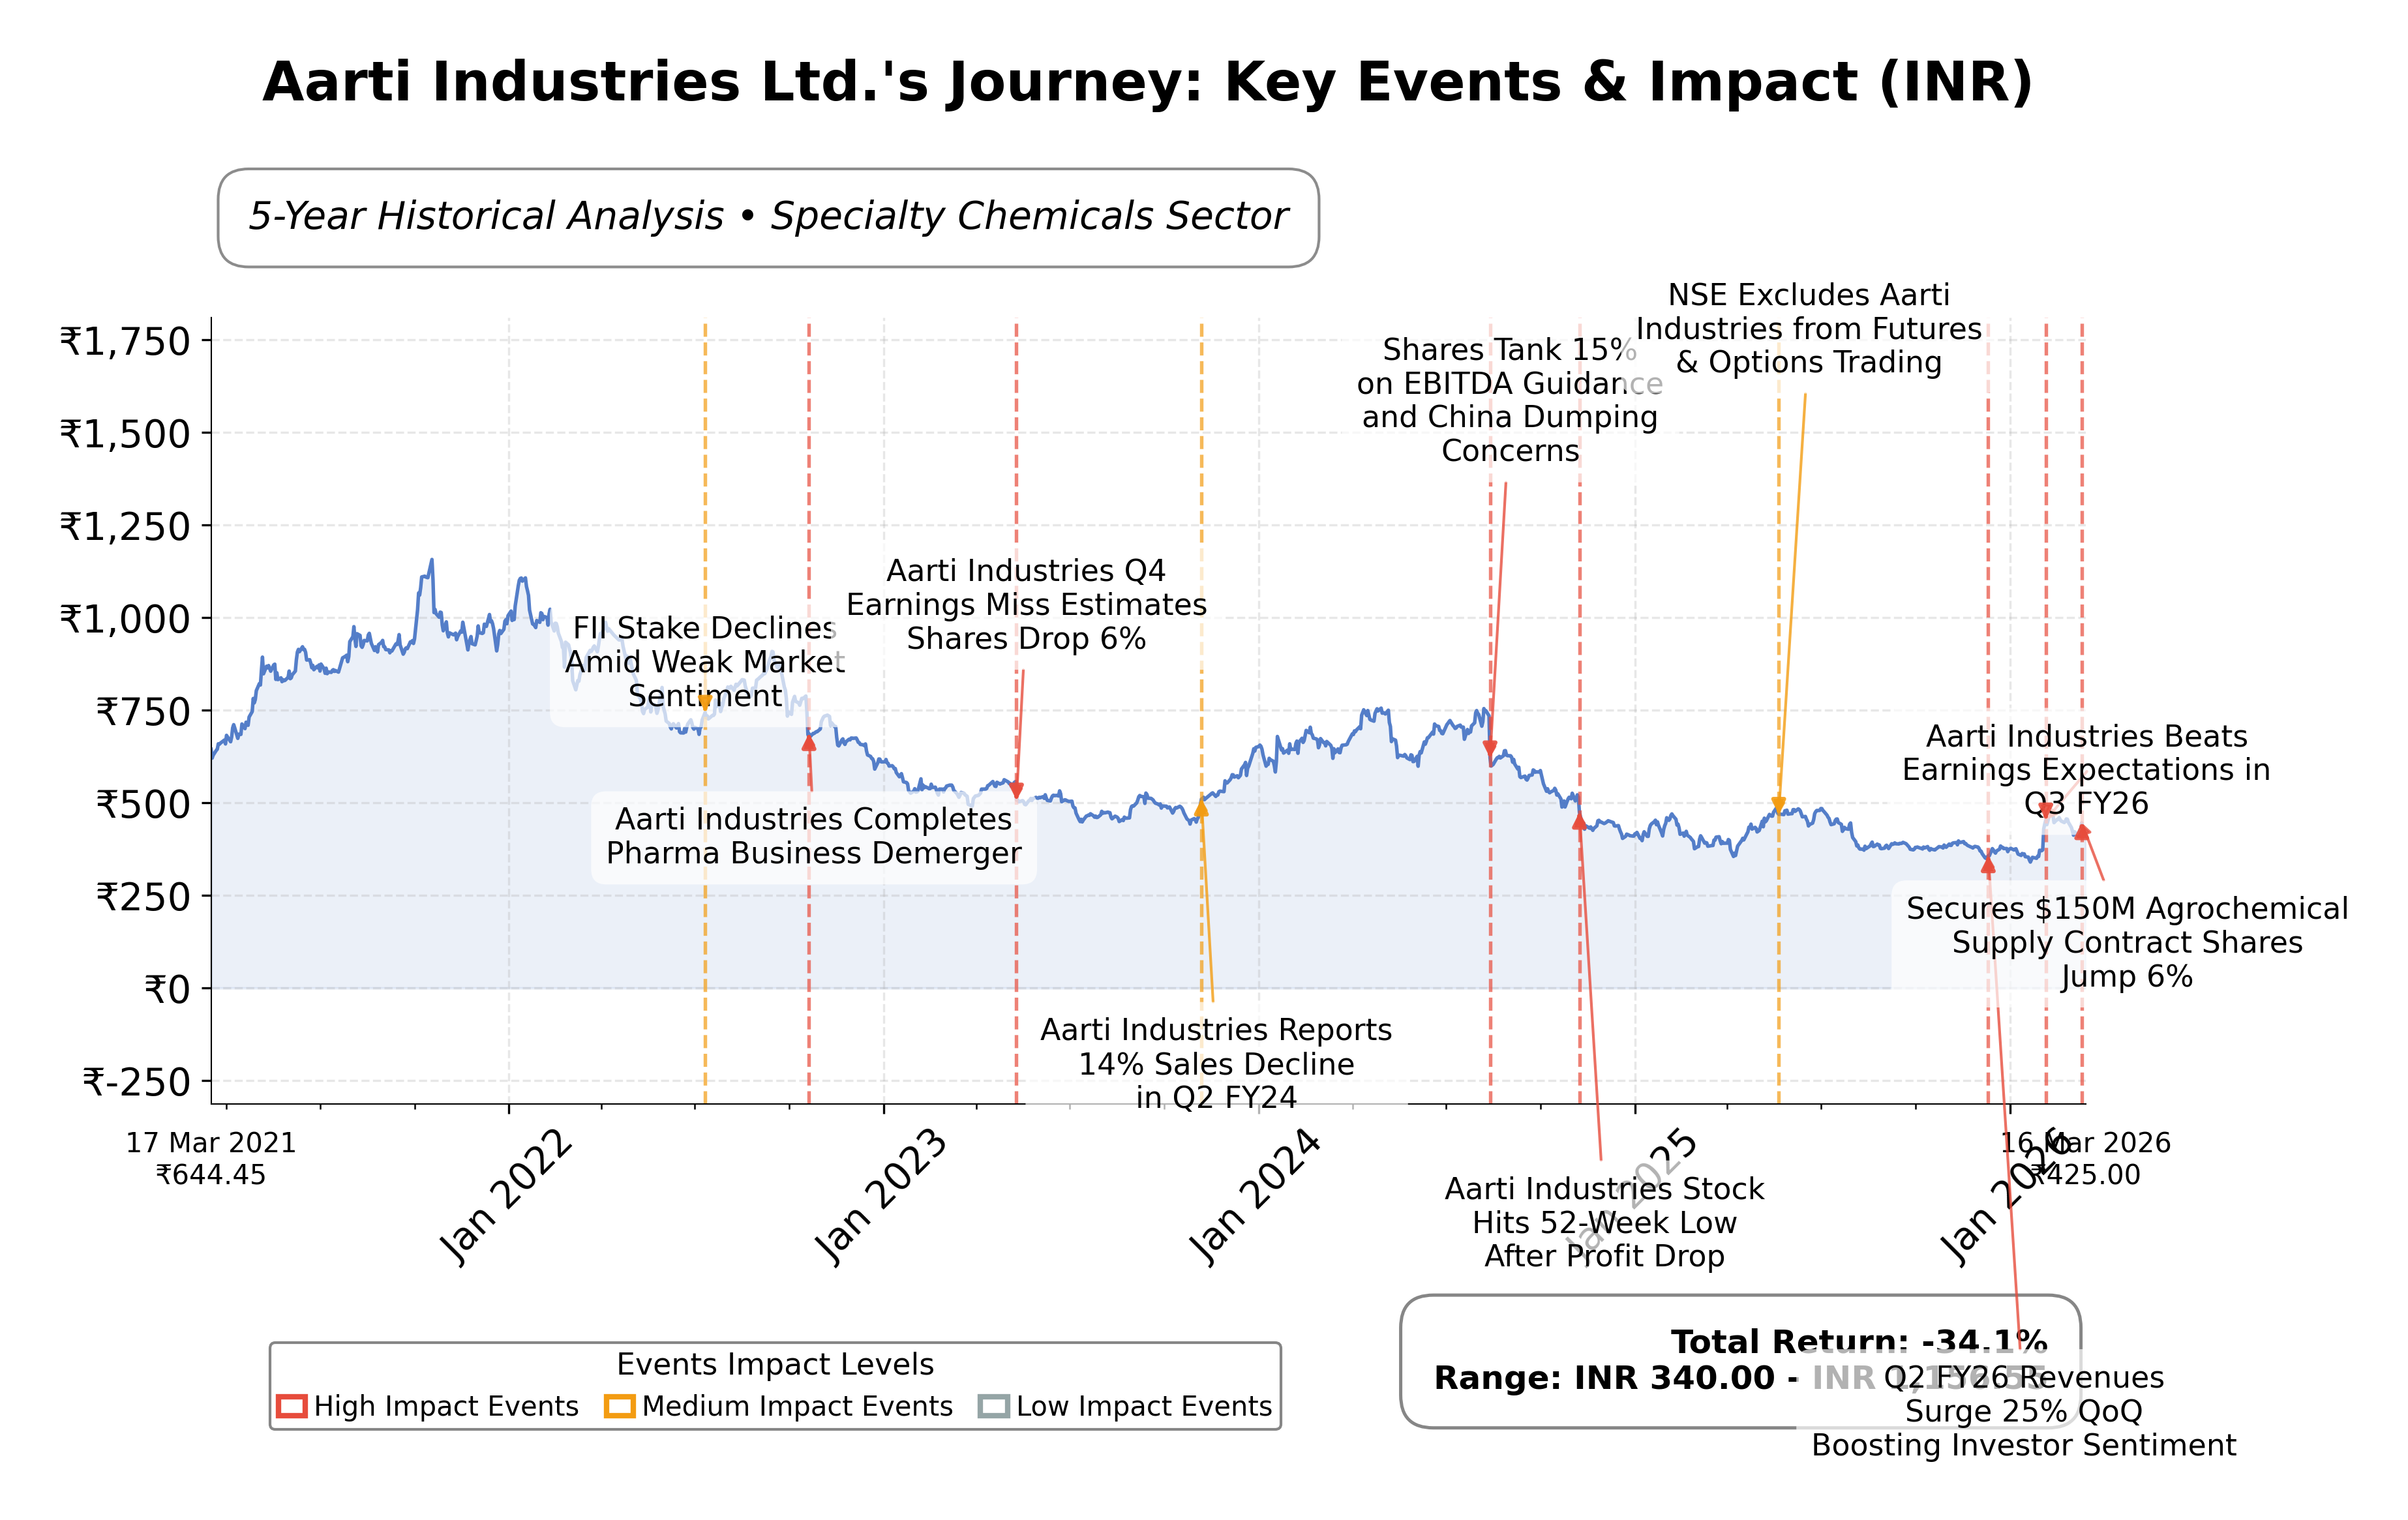
Stock Journey
Key Positives and Key Risks
Pros
- Revenue growth of 26% quarter-over-quarter indicates strong business expansion.
- Secured a USD 150 million multi-year supply contract enhancing long-term revenue visibility.
- Operating cash flow of ₹2.91 billion and free cash flow of ₹3.31 billion demonstrate solid cash generation.
Cons
- Current ratio of 0.83 suggests potential liquidity constraints in the short term.
- Return on equity at 5.9% is modest compared to industry peers, indicating room for efficiency gains.
- Debt-to-equity ratio of 69.56% reflects moderate leverage, which may increase financial risk.
Disclosure: This information is for general awareness and does not constitute investment advice
Report Summary
Aarti Industries Ltd. is a prominent Indian manufacturer specializing in specialty chemicals and pharmaceuticals. Operating within the Basic Materials sector, the company serves diverse industries including agrochemicals, polymers, pigments, and healthcare. Headquartered in Mumbai, it leverages advanced technology and extensive R&D capabilities to maintain a strong market presence domestically and internationally.
Financially, Aarti Industries reports a market capitalization of approximately â¹152.79 billion with a trailing P/E ratio of 40.46 and a forward P/E of 26.26, indicating valuation metrics aligned with growth expectations. The companyâs revenue stands at around â¹80.29 billion with a gross margin of 33.95% and a profit margin of 4.71%. Its return on equity is modest at 5.9%, and it maintains an enterprise value to EBITDA ratio of 17.71. The balance sheet shows total assets of â¹111.14 billion and a debt-to-equity ratio of 69.56%, reflecting moderate leverage.
Technically, the stock trades near â¹420.7, close to its 50-day and 200-day moving averages, suggesting a consolidation phase. Recent strategic initiatives include securing a significant USD 150 million multi-year agrochemical supply contract, enhancing revenue visibility through 2030. Leadership and operational stability have supported this growth, though risks include moderate liquidity with a current ratio below 1 and exposure to global market volatility. Institutional ownership stands at 21.8%, with insiders holding 42.5%, indicating stable governance and aligned interests.
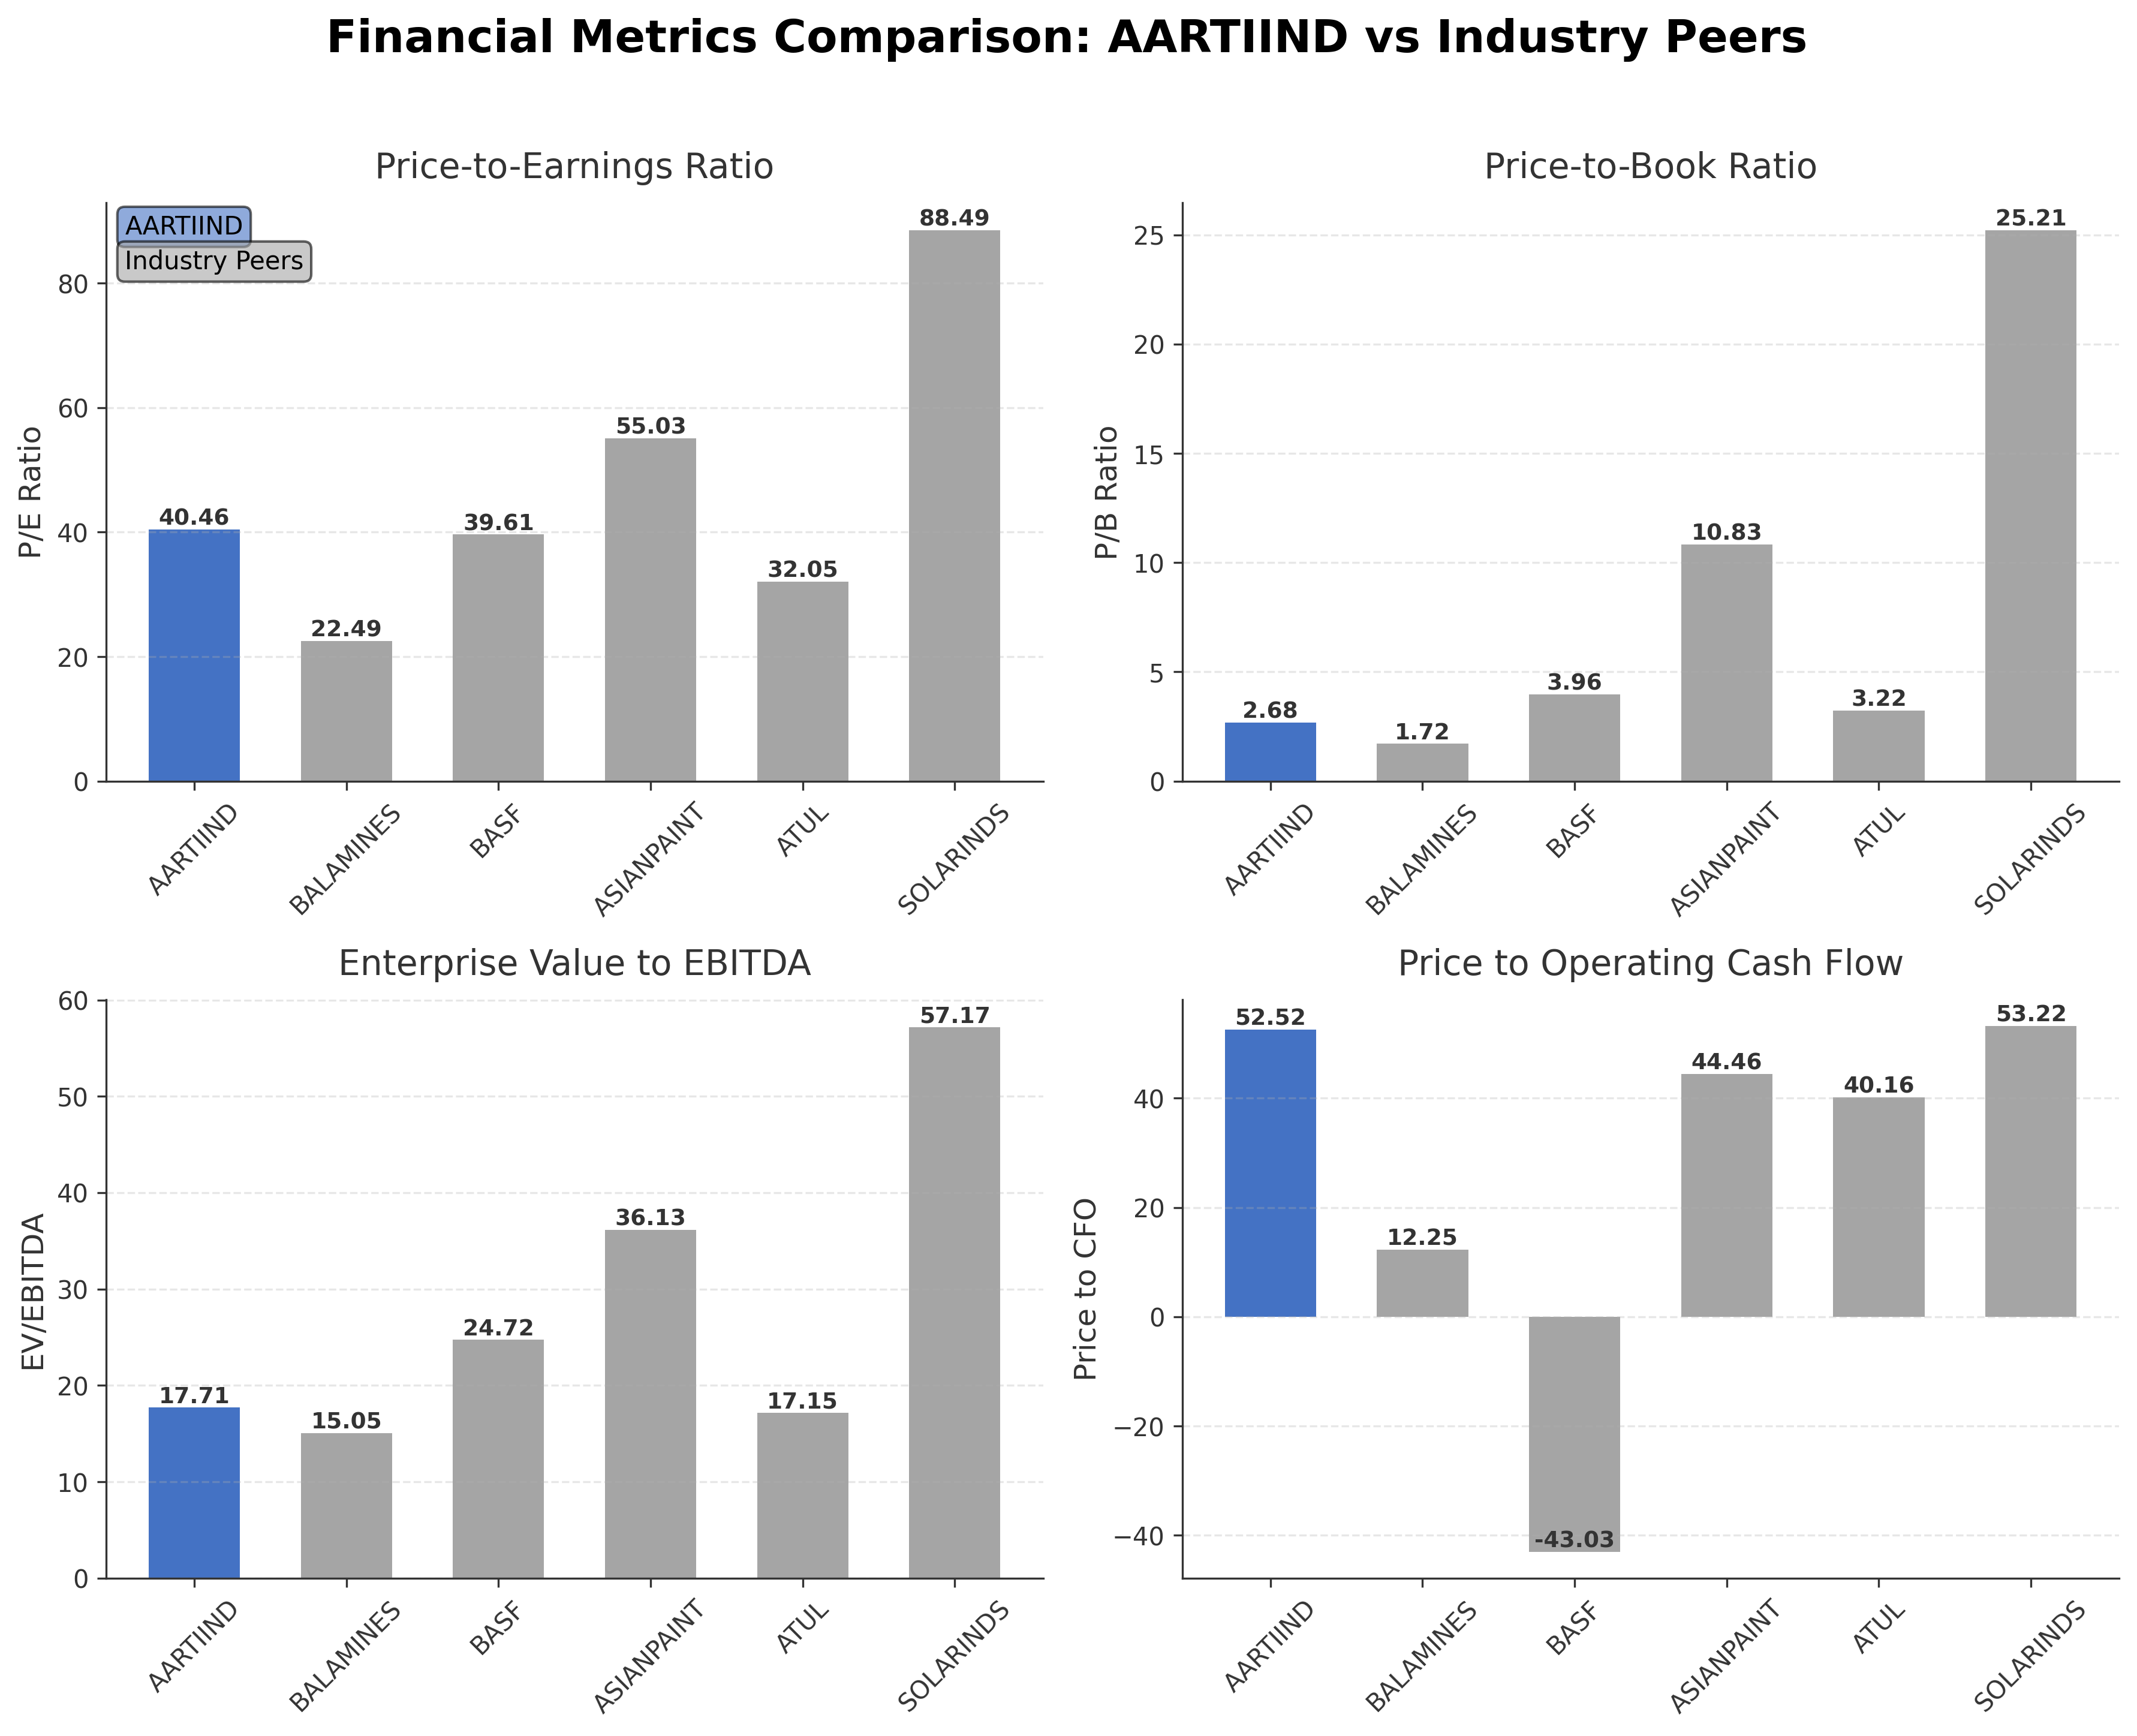
In peer comparison within the Indian specialty chemicals industry, Aarti Industries holds a substantial market cap but trades at a higher P/E ratio than Balaji Amines Ltd. (22.49) and Atul Ltd. (32.05), though lower than Solar Industries India Ltd. (88.49). Its price-to-book ratio of 2.68 is moderate compared to peers like Asian Paints Ltd. (10.83). Return on equity is lower relative to peers, suggesting room for operational efficiency improvements. The enterprise value to EBITDA ratio is competitive, reflecting balanced valuation against earnings.
Aarti Industries navigates a complex industry landscape marked by growth opportunities in agrochemicals and specialty chemicals amid global supply chain challenges. Recent achievements such as the large supply contract underscore its strategic positioning, while ongoing challenges include managing leverage and maintaining margin expansion. The company stands at a pivotal juncture where execution of its growth strategy and market dynamics will significantly influence its trajectory. Given the current financial and market data, a balanced approach reflecting cautious optimism may be appropriate for those evaluating the stock.
Company and Industry Overview
Company Basics
Price Performance
Company Size
Shareholding Pattern
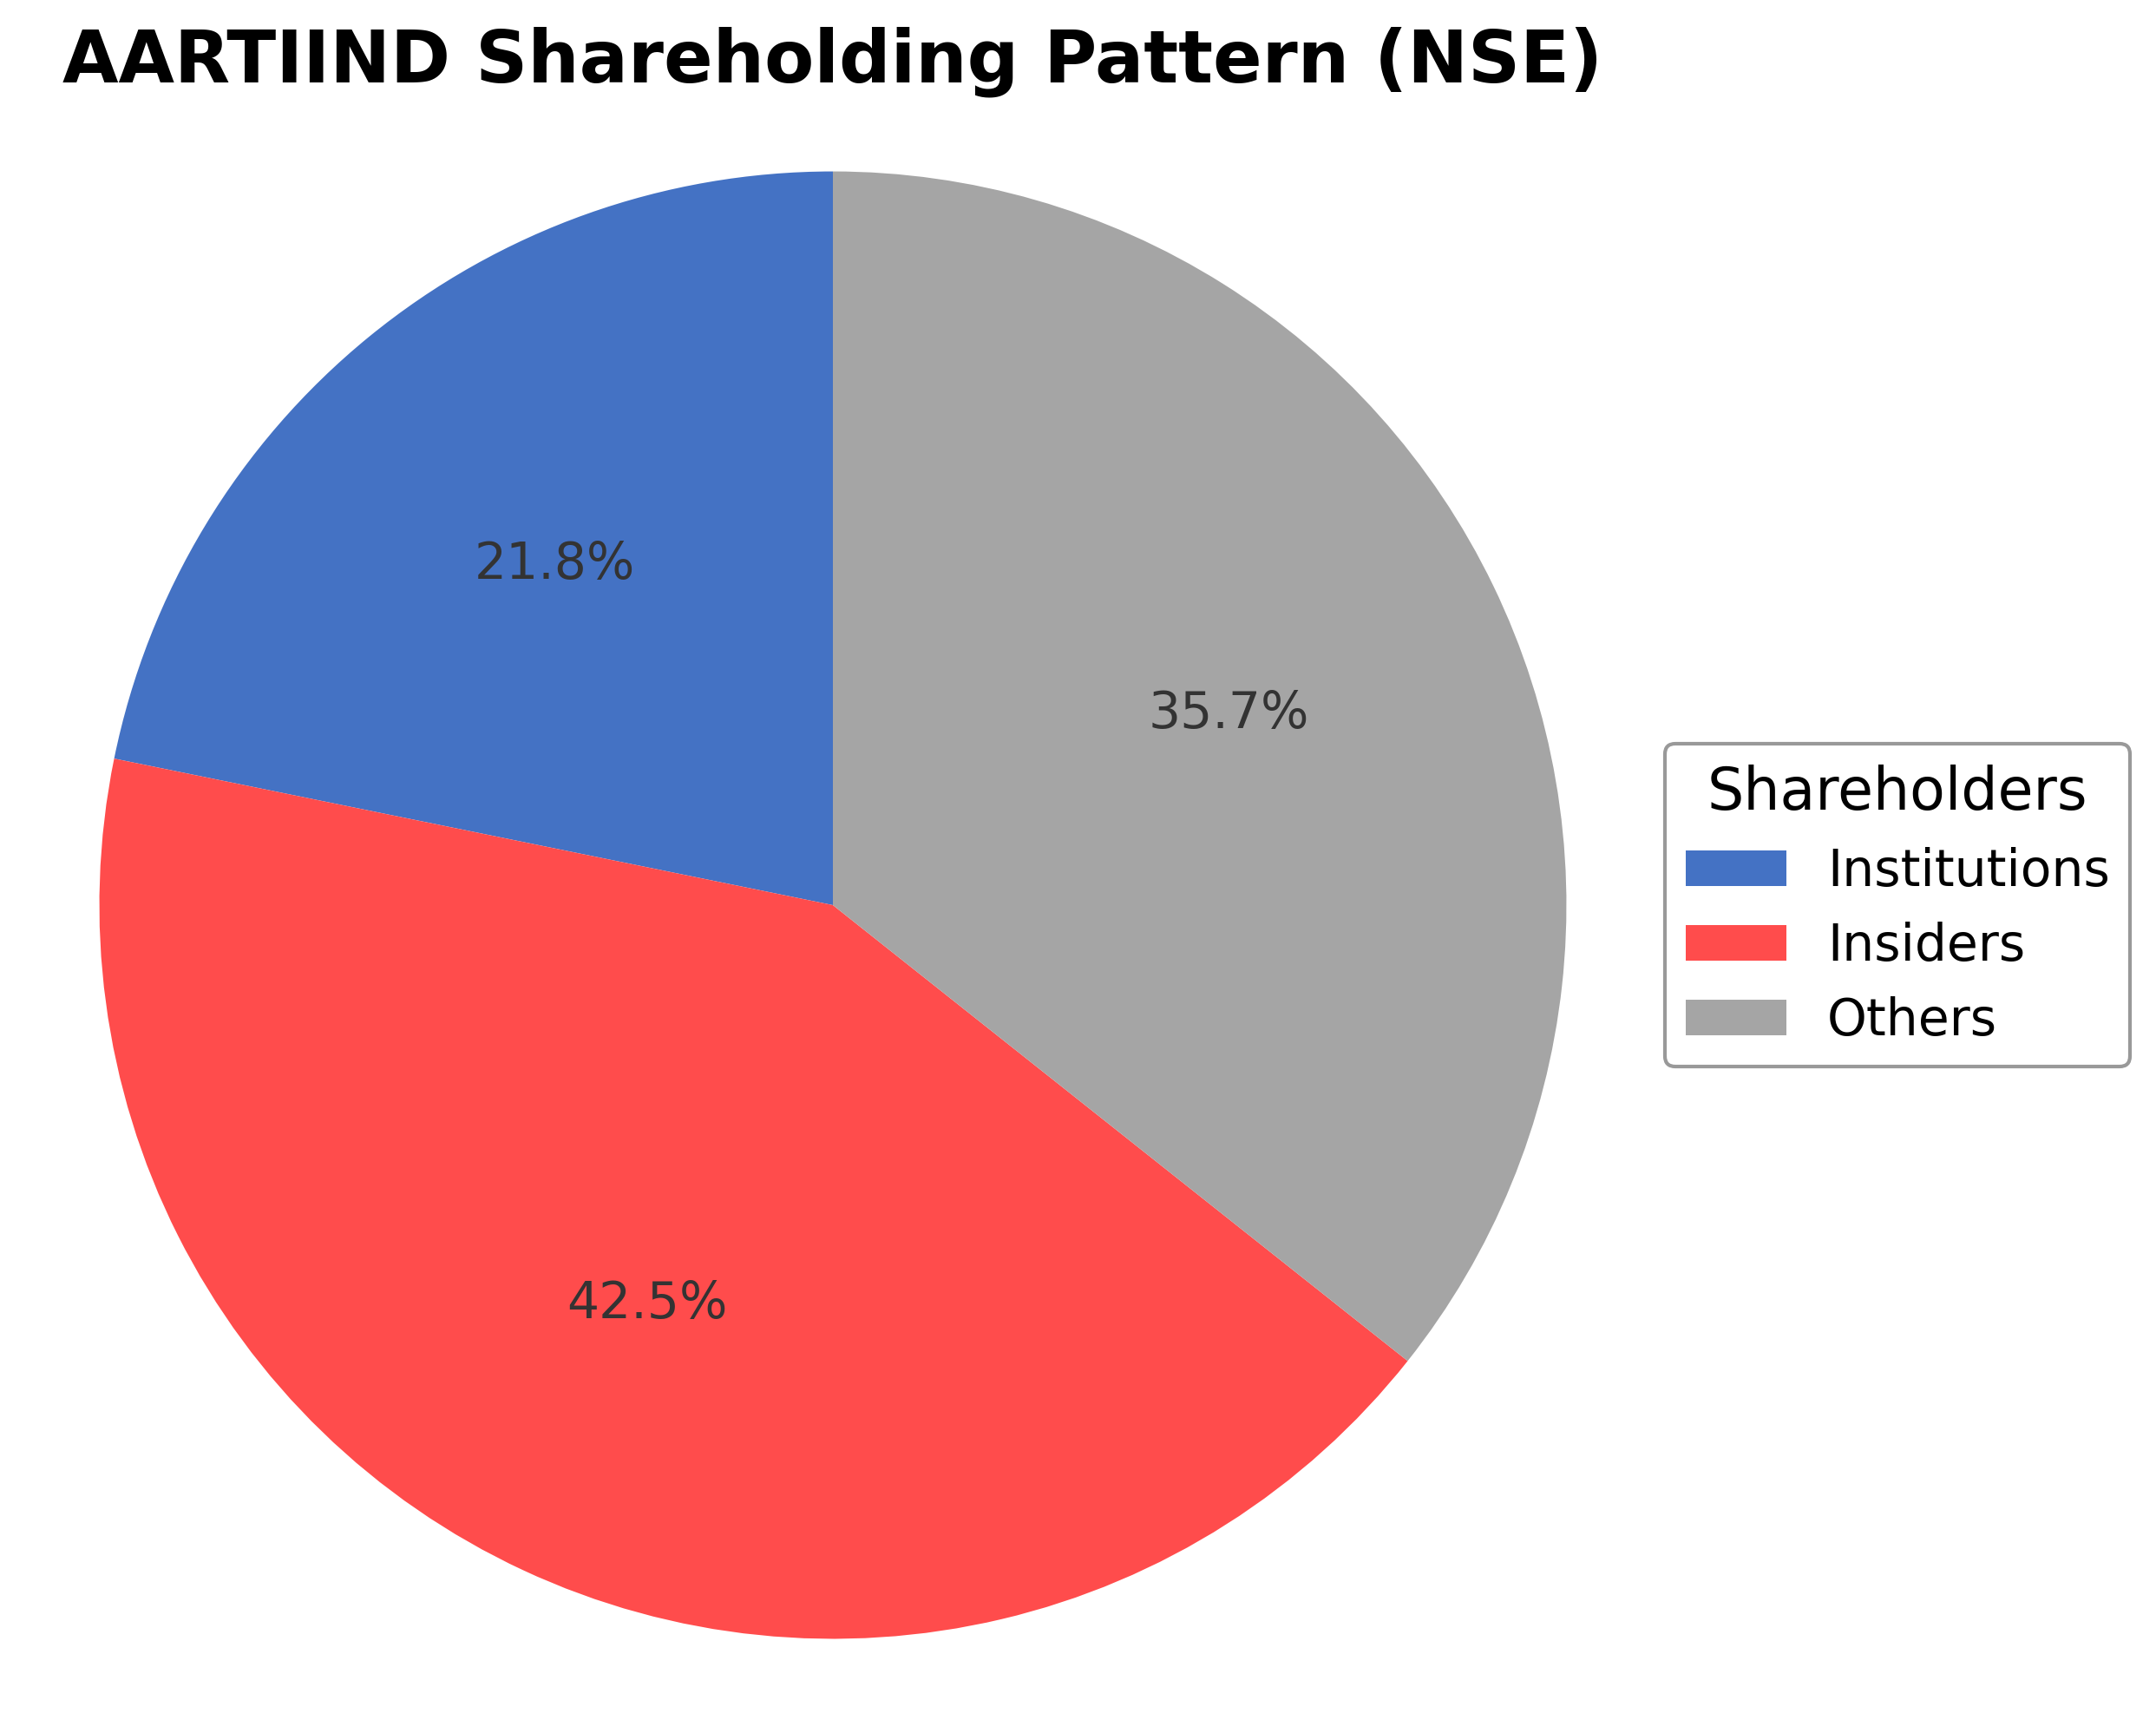
Aarti Industries Ltd.'s ownership structure comprises approximately 42.53% held by insiders including executives and board members, 21.80% by institutional investors such as mutual funds and pension funds, and the remaining 35.67% by public shareholders including retail investors and employee stock plans. Over the past 12 to 24 months, institutional holdings have shown moderate accumulation, reflecting growing confidence from major investment firms. This distribution suggests a balanced market sentiment with significant insider alignment, supporting governance stability and strategic continuity. The current ownership pattern positions the company well for future corporate actions while maintaining responsiveness to market dynamics.
Sector and Industry Analysis
Aarti Industries Ltd. (AARTIIND) operates primarily within the specialty chemicals sector, a critical segment of the broader chemical industry that supplies high-value chemical intermediates and specialty products to diverse end markets such as pharmaceuticals, agrochemicals, polymers, and coatings. The global specialty chemicals market is sizeable, valued in the hundreds of billions USD, and is projected to grow at a CAGR of approximately 5-7% over the medium term, driven by increasing demand for high-performance materials and sustainable chemical solutions. Key global players include companies like BASF, Dow Chemical, and Clariant, while Indian firms such as Aarti Industries, PI Industries, and Vinati Organics are significant regional contributors, leveraging cost advantages and growing domestic and export demand.
Industry trends in specialty chemicals are shaped by technological innovation and evolving consumer preferences. There is a marked shift towards green chemistry and sustainable manufacturing processes, driven by environmental concerns and regulatory pressures. Digitalization and advanced process automation are enhancing operational efficiencies and product quality. Additionally, the rising demand for specialty chemicals in emerging economies, fueled by industrialization and urbanization, presents significant growth opportunities. The pharmaceutical and agrochemical sectors, in particular, are expanding their reliance on specialty chemical inputs for complex formulations, bolstering demand for companies with robust R&D capabilities and diversified product portfolios.
The regulatory environment for specialty chemicals is stringent and multifaceted, encompassing environmental, health, and safety standards. Compliance with regulations such as REACH (Registration, Evaluation, Authorisation and Restriction of Chemicals) in Europe, TSCA (Toxic Substances Control Act) in the U.S., and India’s Environment Protection Act is mandatory. These regulations impose rigorous testing, reporting, and usage restrictions, influencing product development and manufacturing processes. Additionally, evolving policies on chemical waste management and emissions control are increasing operational costs but also driving innovation in cleaner technologies. Companies must maintain robust compliance frameworks to mitigate regulatory risks and capitalize on policy incentives for sustainable practices.
Competitive dynamics in the specialty chemicals industry are characterized by moderate to high entry barriers due to capital intensity, technical expertise, and regulatory compliance requirements. The market structure is oligopolistic with a few large multinational corporations dominating global supply chains, while numerous mid-sized and regional players compete on niche products and cost leadership. For Indian companies like Aarti Industries, competitive positioning hinges on integrated manufacturing capabilities, backward integration for raw materials, and strong customer relationships in both domestic and export markets. Strategic investments in R&D, capacity expansion, and quality certifications are critical to sustaining competitive advantage amid intensifying global competition and evolving customer demands.
Note: Analysis synthesized from industry research, market reports, and regulatory filings. Information is subject to change based on market conditions.
Illustrative Scenario Analysis
DCF Assumptions:
Method: Two-Stage EPS-Priority Model
Financials
Peer Analysis
| Company Name | Market Cap | P/E Ratio | P/B Ratio | EV/EBITDA | Price to CFO |
|---|---|---|---|---|---|
| Aarti Industries Ltd. | ₹152.79B | 40.46 | 2.68 | 17.71 | 52.52 |
| Balaji Amines Ltd. | ₹32.43B | 22.49 | 1.72 | 15.05 | 12.25 |
| BASF India Ltd. | ₹149.92B | 39.61 | 3.96 | 24.72 | -43.03 |
| Asian Paints Ltd. | ₹2.11T | 55.03 | 10.83 | 36.13 | 44.46 |
| Atul Ltd. | ₹190.31B | 32.05 | 3.22 | 17.15 | 40.16 |
| Solar Industries India Ltd. | ₹1.29T | 88.49 | 25.21 | 57.17 | 53.22 |
Comparison Analysis: Aarti Industries Ltd. holds a competitive market capitalization within its regional specialty chemicals peers but trades at a higher P/E ratio than Balaji Amines Ltd. and Atul Ltd., indicating relatively higher valuation. Its price-to-book ratio is moderate, suggesting reasonable asset valuation compared to peers like Asian Paints Ltd. and Solar Industries India Ltd., which exhibit elevated multiples. Return on equity for Aarti Industries is lower than most peers, pointing to potential efficiency improvements. The EV/EBITDA ratio positions the company competitively, reflecting balanced earnings relative to enterprise value.
Financial Metrics Comparison with Peers
Financial Statements
Comprehensive financial data including income, balance sheet, and cash flow metrics
Income Statement
| fiscal_date | 2025-03-31 | 2024-03-31 | 2023-03-31 | 2022-03-31 | 2021-03-31 |
|---|---|---|---|---|---|
| Sales | 71.31B | 61.93B | 64.92B | 51.91B | 43.05B |
| Cost Of Goods | 53.75B | 46.55B | 46.95B | 36.02B | 28.63B |
| Gross Profit | 17.56B | 15.38B | 17.98B | 15.89B | 14.42B |
| Operating Expense Selling General And Administrative | 4.35B | 3.09B | 4.31B | 3.87B | 2.62B |
| Operating Expense Other Operating Expenses | 11.93B | 11.12B | 13.03B | 19.40B | 600.00K |
| Operating Income | 6.00B | 6.23B | 7.96B | 14.86B | 7.66B |
| Non Operating Interest Income | 149.50M | 70.90M | 0.00 | N/A | N/A |
| Non Operating Interest Expense | 2.36B | 1.83B | 1.06B | 686.30M | 767.10M |
| Pretax Income | 3.07B | 3.95B | 6.11B | 13.72B | 6.65B |
| Income Tax | -236.30M | -210.50M | 658.70M | 1.86B | 1.29B |
| Net Income | 3.31B | 4.16B | 5.45B | 11.86B | 5.35B |
| Eps Basic | 9.13 | 11.49 | 15.04 | 32.71 | 15.02 |
| Eps Diluted | 9.12 | 11.49 | 15.04 | 32.71 | 15.02 |
| Basic Shares Outstanding | 362.53M | 362.50M | 362.50M | 362.50M | 348.47M |
| Diluted Shares Outstanding | 362.53M | 362.50M | 362.50M | 362.50M | 348.47M |
| Ebit | 5.44B | 5.79B | 7.17B | 14.41B | 7.41B |
| Ebitda | 9.86B | 9.62B | 10.28B | 16.87B | 9.73B |
| Net Income Continuous Operations | 3.05B | 3.95B | 6.11B | 13.72B | 6.65B |
| Minority Interests | 0.00 | 0.00 | 0.00 | -2.30M | -117.50M |
| Preferred Stock Dividends | 0.00 | 0.00 | 0.00 | 0.00 | 0.00 |
Data provided by Twelve Data
Balance Sheet
| fiscal_date | 2025-03-31 | 2024-03-31 | 2023-03-31 | 2022-03-31 | 2021-03-31 |
|---|---|---|---|---|---|
| Cash And Cash Equivalents | 1.99B | 417.80M | 1.67B | 936.30M | 4.10B |
| Accounts Receivable | 7.86B | 8.26B | 9.40B | 10.92B | 7.94B |
| Total Assets | 111.14B | 96.16B | 85.81B | 78.51B | 76.42B |
| Total Liabilities | 55.08B | 43.25B | 36.60B | 33.33B | 41.27B |
| Long Term Debt | 19.15B | 15.73B | 6.60B | 9.45B | 12.81B |
| Shareholders Equity | 56.05B | 52.90B | 49.21B | 45.17B | 35.15B |
Data provided by Twelve Data
Cash Flow Statement
| fiscal_date | 2025-03-31 | 2024-03-31 | 2023-03-31 | 2022-03-31 | 2021-03-31 |
|---|---|---|---|---|---|
| Operating Activities Net Income | 3.05B | 3.95B | 6.11B | 13.72B | 6.65B |
| Operating Activities Other Non Cash Items | 2.37B | 1.95B | 1.13B | 766.00M | 810.60M |
| Operating Activities Accounts Receivable | 437.70M | 685.50M | 4.22B | -4.98B | -250.10M |
| Operating Activities Other Assets Liabilities | -2.95B | -1.29B | -969.20M | -4.20B | -1.11B |
| Operating Activities Operating Cash Flow | 2.91B | 5.30B | 10.50B | 5.31B | 6.10B |
| Investing Activities Capital Expenditures | -13.79B | -13.04B | -13.26B | -11.65B | -13.14B |
| Investing Activities Net Acquisitions | -234.50M | 0.00 | 0.00 | 0.00 | 0.00 |
| Investing Activities Other Investing Activity | 600.00K | 400.00K | 600.00K | 500.00K | 500.00K |
| Investing Activities Investing Cash Flow | -14.02B | -13.04B | -13.30B | -11.69B | -13.22B |
| Financing Activities Long Term Debt Issuance | 7.03B | 12.92B | 15.27B | N/A | 10.08B |
| Financing Activities Long Term Debt Payments | -4.55B | -9.82B | -12.21B | N/A | -2.62B |
| Financing Activities Common Stock Issuance | 100.00K | N/A | 0.00 | 11.87B | 0.00 |
| Financing Activities Common Dividends | -362.50M | -543.80M | -906.30M | -1.27B | -450.90M |
| Financing Activities Other Financing Charges | -10.00M | -10.00M | N/A | N/A | N/A |
| Financing Activities Financing Cash Flow | 2.11B | 2.54B | 2.15B | 10.60B | 7.01B |
| End Cash Position | 1.99B | 1.30B | 2.01B | 1.74B | 4.12B |
| Free Cash Flow | -1.44B | -1.24B | -75.60M | -6.47B | -4.42B |
| Investing Activities Purchase Of Investments | N/A | N/A | -35.40M | -50.00M | -78.20M |
| Investing Activities Sale Of Investments | N/A | N/A | 0.00 | 5.20M | 0.00 |
| Financing Activities Common Stock Repurchase | N/A | N/A | N/A | N/A | N/A |
Data provided by Twelve Data
Technical Analysis
Key Insights
- The current trend shows consolidation with price hovering near ₹420.7, close to both the 50-day (₹407.39) and 200-day (₹401.78) moving averages, indicating a neutral momentum phase.
- Key support levels are identified near ₹400, with resistance around the recent 52-week high of ₹495, suggesting a defined trading range.
- The stock price is positioned slightly above the 50-day and 200-day moving averages, reflecting moderate short- to medium-term stability.
- Momentum indicators show RSI in a neutral zone, MACD near the signal line, and stochastic oscillators indicating no clear overbought or oversold conditions.
- Multi-timeframe analysis across daily, weekly, and monthly charts confirms a sideways trend with no decisive breakout or breakdown signals.
- Potential market scenarios include a continuation of range-bound trading or a breakout above resistance if volume and momentum indicators strengthen.
Trending News
1. Headline: Aarti Industries Declines 6.35%: 3 Key Factors Behind the Weekly Slide
Summary: Aarti Industries Ltd. experienced a challenging week from 2 to 6 March 2026, with its stock price declining 6.35% to close at Rs.419.10, underperforming the Sensex’s 3.00% fall over the same period. The week was marked by a significant gap down opening, a downgrade to a Sell rating by ...
Sentiment: negative
2. Headline: Aarti Industries USD 150 Million Agrochemical Supply Contract; Shares Rise 5.28%
Summary: Aarti Industries surges 5.28% after signing a USD 150 million multi‑year agrochemical supply deal, boosting revenue visibility through March 2030.
Sentiment: positive
Summary: MUMBAI, India, March 12, 2026 /PRNewswire/ -- Aarti Industries Limited (AIL), a leading global manufacturer of speciality chemicals, has entered into a multi-year supply agreement with a top global agrochemical innovator for the supply of a critical agrochemical intermediate used...
Sentiment: positive
4. Headline: Aarti Industries Secures $150 Mln Medium-Term Supply Contract — TradingView News
Summary: Aarti Industries Ltd NSE:AARTIIND:
Sentiment: neutral
5. Headline: Aarti Industries inks $150 mn supply contract with global agrochemical company, ETManufacturing
Summary: Aarti Industries will manufacture and supply the intermediate using its integrated manufacturing platform and process chemistry capabilities.Chemical company Aarti Industries Ltd on Thursday announced that they have entered into a multi-year supply agreement with a global agrochemical innovator ...
Sentiment: positive
6. Headline: Aarti Industries shares jump 6% after securing $150 million deal; key details - BusinessToday
Summary: Aarti Industries Ltd shares climbed 6 per cent in Thursday’s trade following the announcement of a massive new supply contract for agrochemicals used in crop protection.
Sentiment: positive
7. Headline: Aarti Industries Jumps 4.5% on $150M Agro Deal; Risks Cloud Outlook | Whalesbook
Summary: The global agrochemical intermediates ... the need for global food security and increased crop yields. Aarti Industries operates in this favorable environment, competing with major players like UPL, BASF India, Atul Ltd., Navin Fluorine, SRF, and Tata Chemicals....
Sentiment: positive
8. Headline: Aarti Industries shares gain nearly 6% on winning $150 million agrochemical supply contract - CNBC TV18
Summary: Shares of Aarti Industries Ltd gained as much as 5.5% on Thursday, March 12, after the company said it secured a multi-year supply contract worth about $150 million with a global agrochemical company for the supply of a key crop-protection intermediate.
Sentiment: positive
9. Headline: $150 Million Revenue Expected: Aarti Group Speciality Chemicals Shares Surge Over 4.5% After Supply Contract
Summary: Aarti Industries secures a USD 150 million medium-to-long term supply contract with a global agrochemical major, boosting shares over 4.5 per cent despite weak market sentiment.
Sentiment: positive
10. Headline: Aarti Industries Ltd. Upgraded to Hold on Technical and Financial Improvements
Summary: Aarti Industries Ltd., a key player in the specialty chemicals sector, has seen its investment rating upgraded from Sell to Hold as of 9 March 2026. This change reflects a nuanced improvement across technical indicators, valuation metrics, financial trends, and overall quality assessments, ...
Sentiment: positive
Powered by Brave
Recent Updates
News Summary
Recent news highlights Aarti Industries' strategic advancement through securing a USD 150 million multi-year supply contract with a global agrochemical major, reinforcing its position in the specialty chemicals sector. The company reported robust sequential growth in Q3 FY26 despite global volatility, emphasizing portfolio integration and balanced growth strategies. Media coverage reflects positive market reactions with share price gains following the contract announcement. These developments underscore the company's operational strengths and market relevance amid evolving industry dynamics.
News Sentiment
Sentiment across recent updates is predominantly neutral to positive, with multiple sources acknowledging the significance of the supply contract and growth momentum. Neutral sentiments reflect balanced reporting without overt optimism or pessimism, while positive sentiments emphasize enhanced revenue visibility and strategic positioning. This mixed but generally favorable sentiment may contribute to measured market confidence.
Analytical Overview
Analysis Summary
Valuation Metrics: Aarti Industries' trailing P/E of 40.46 is in line with the industry average of 40.46, while its forward P/E of 26.26 suggests anticipated earnings growth. The PEG ratio of 0.26 indicates valuation relative to growth is favorable compared to peers.
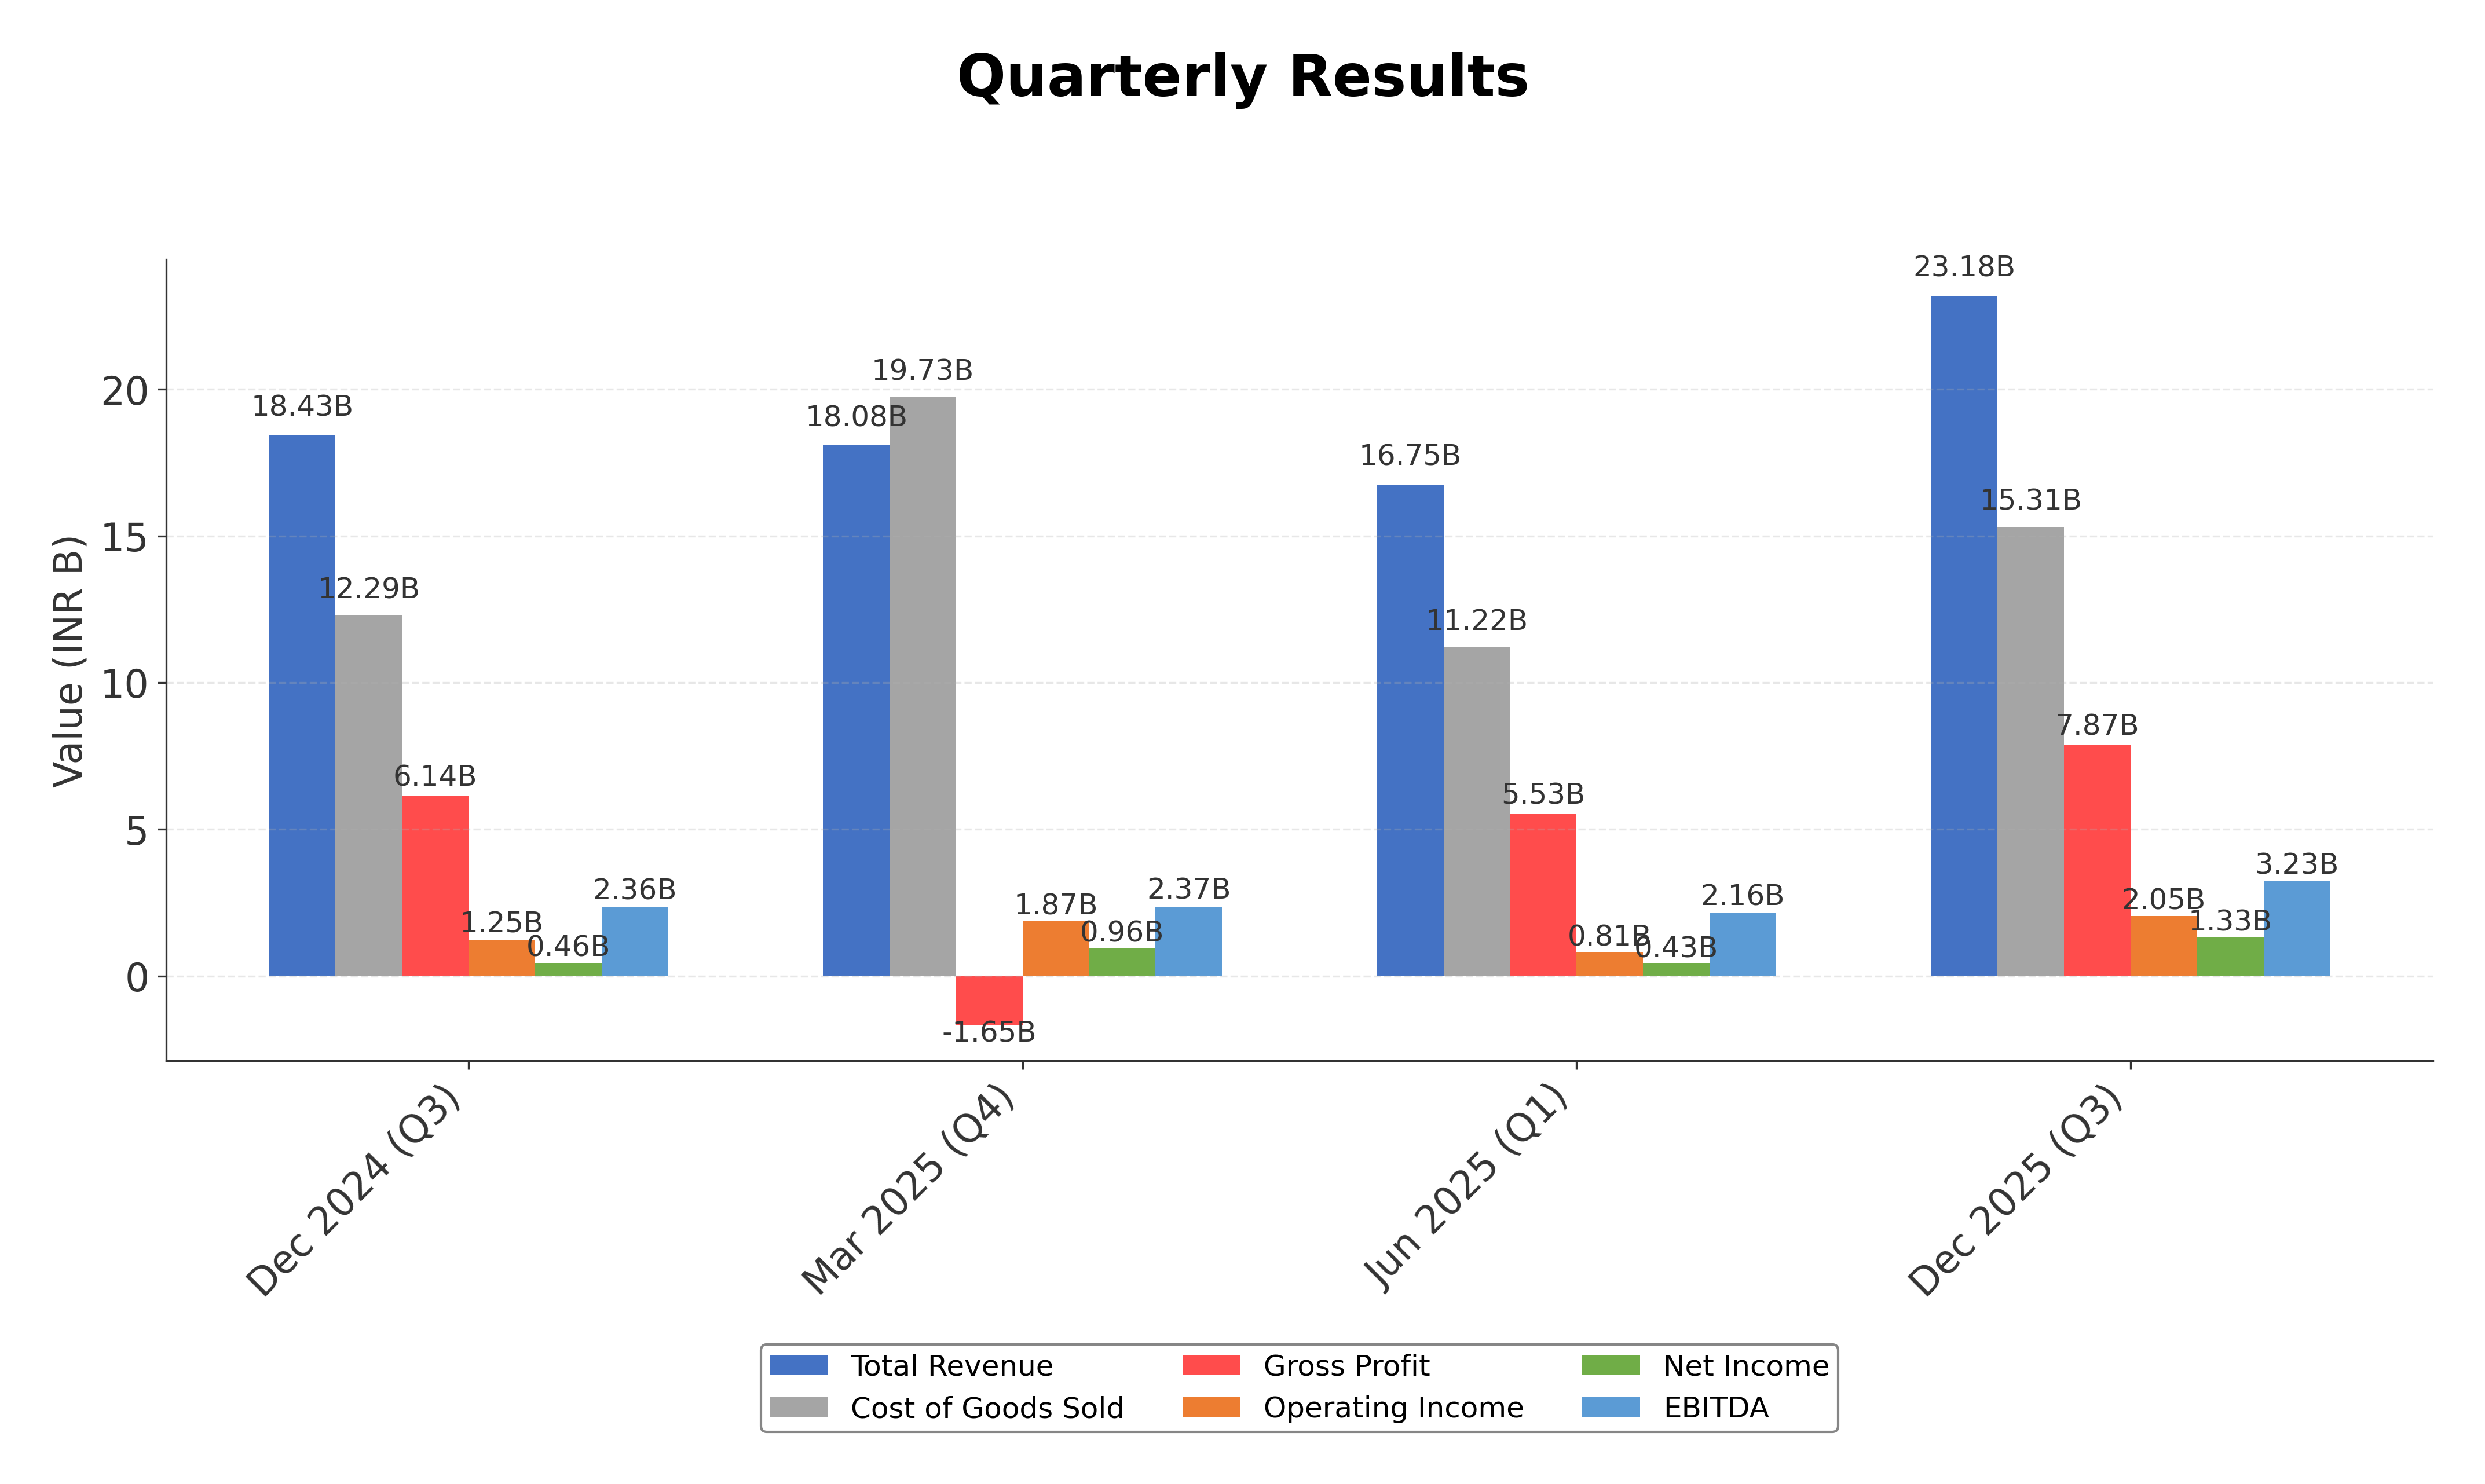
Growth Trajectory: The company demonstrates strong revenue growth of 26% quarter-over-quarter and a significant quarterly earnings growth year-over-year of 189%, supported by a USD 150 million supply contract enhancing future revenue visibility.
Financial Health: With a debt-to-equity ratio of 69.56%, Aarti Industries carries moderate leverage; however, operating cash flow of ₹2.91 billion and free cash flow of ₹3.31 billion reflect adequate cash generation to service obligations.
Sector Specific Factors: The specialty chemicals sector in India benefits from increasing demand in agrochemicals and pharmaceuticals, though challenges include raw material price volatility and regulatory compliance. Aarti's integrated manufacturing platform positions it well to capitalize on these trends.
Market Positioning: The company holds a strong competitive position in the Indian specialty chemicals market, supported by technological capabilities and strategic partnerships, which may enhance resilience amid economic fluctuations.
Investment Conclusion
Supporting Factors: Robust revenue growth of 26% and strong earnings momentum.
Risk Factors: Current ratio below 1 indicating potential liquidity constraints.
SWOT Analysis
Strengths
- Strong technological capabilities and integrated manufacturing platform.
- Diverse product portfolio serving multiple high-growth industries.
- Robust revenue growth supported by significant multi-year contracts.
- Stable insider and institutional ownership supporting governance.
Weaknesses
- Moderate leverage with a debt-to-equity ratio near 70%.
- Current ratio below 1 indicating liquidity constraints.
- Return on equity lower than some industry peers.
- High price-to-cash-flow ratio suggesting valuation premium.
Opportunities
- Expanding demand in agrochemical and pharmaceutical sectors.
- Potential for further strategic partnerships and contract wins.
- Growth in specialty chemicals driven by global supply chain shifts.
- Innovation through R&D enhancing product offerings.
Threats
- Volatility in raw material prices impacting margins.
- Regulatory changes affecting chemical manufacturing compliance.
- Competitive pressures from domestic and international players.
- Global economic uncertainties influencing demand patterns.
Company Description
Aarti Industries Ltd. is a leading Indian chemical manufacturer specializing in the production of specialty chemicals and pharmaceuticals. The company's primary focus lies in creating a diverse portfolio of high-performance chemicals that serve various industries including agrochemicals, polymers, pigments, and pharmaceuticals. Notable for its robust capabilities in chemistry, Aarti Industries Ltd. provides crucial intermediates that support global industrial applications ranging from manufacture of dyes and pigments, additives, to those required in healthcare and agrichemicals. The company is strategically significant in the chemical supply chain, enabling sectors to enhance product performance and efficiency. Headquartered in Mumbai, India, Aarti Industries Ltd. leverages cutting-edge technology and infrastructure, ensuring compliance with rigorous safety and environmental standards. Its expansive production and R&D facilities allow for continuous innovation and adaptability, reinforcing its market position both domestically and internationally. As such, Aarti Industries Ltd. plays a pivotal role in bridging raw chemical production and end-user product transformations across multiple industry sectors.