
Aarti Industries Ltd (AARTIIND)
Stock Analysis Report
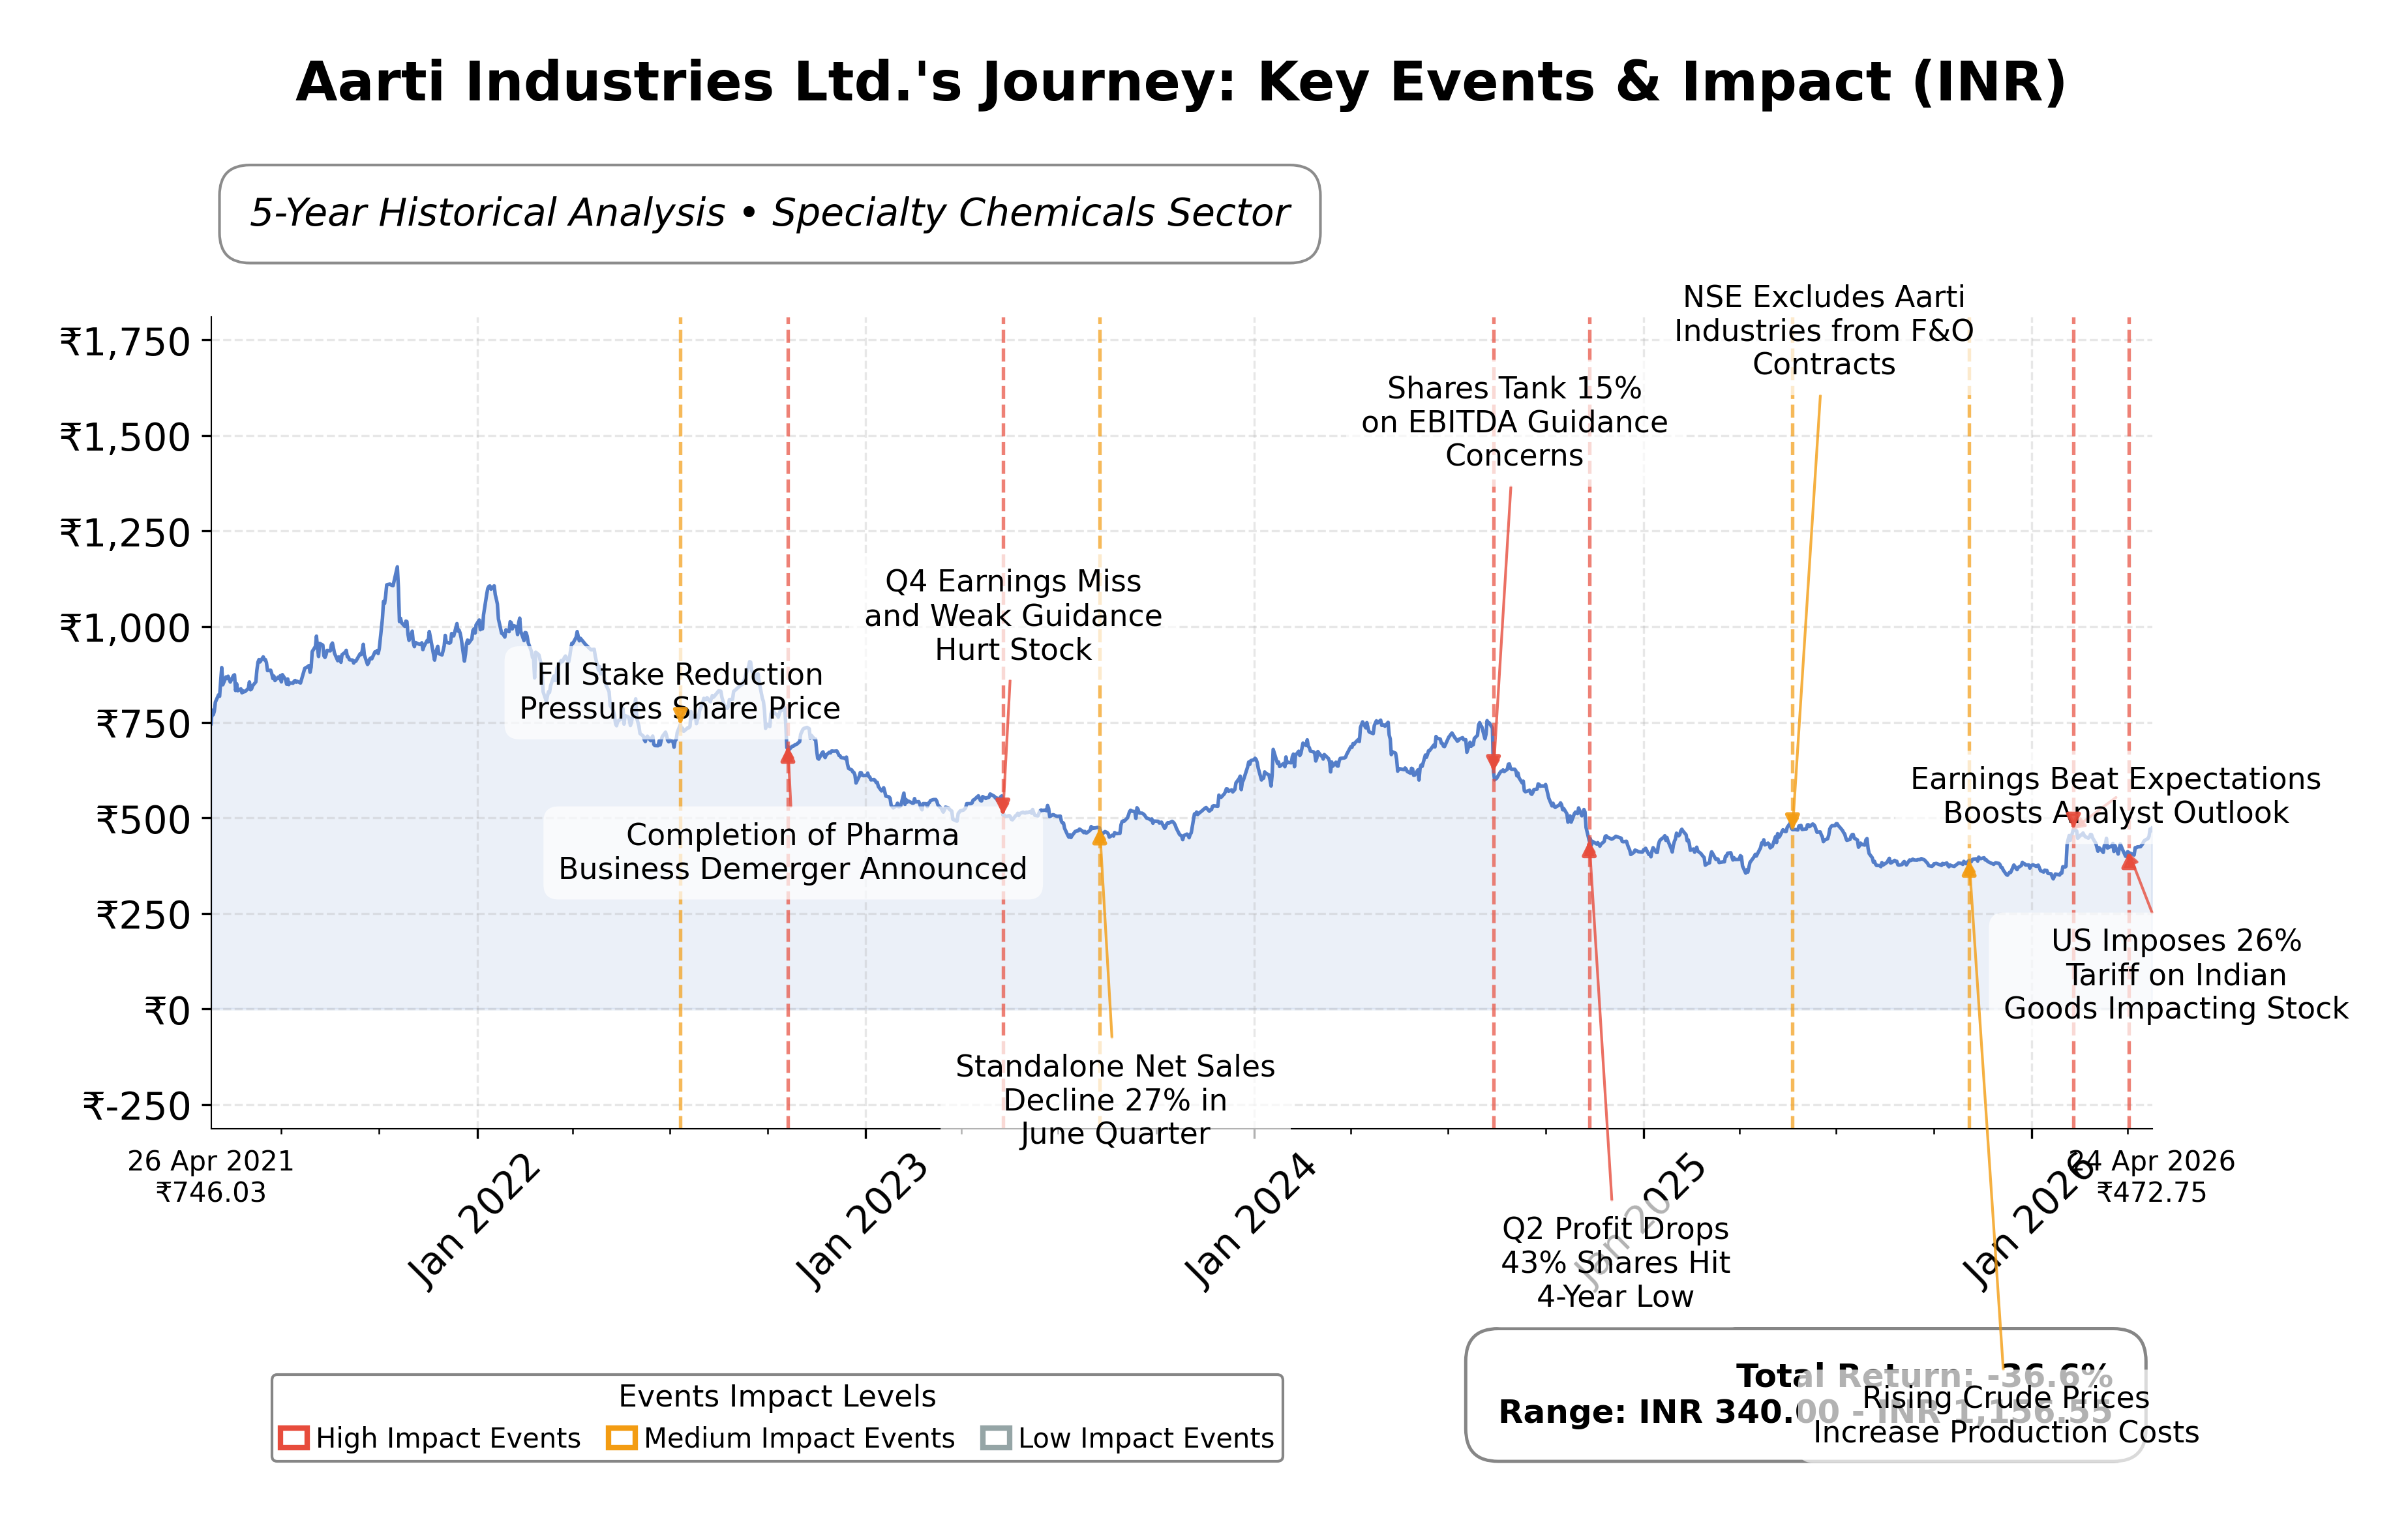
Stock Journey
Key Positives and Key Risks
Pros
- Revenue growth of 26% quarter-over-quarter demonstrates strong top-line momentum.
- Free cash flow of ₹3.31 billion indicates healthy cash generation supporting operations.
- PEG ratio of 0.29 suggests valuation is reasonable relative to growth expectations.
Cons
- Trailing P/E ratio of 45.5 is relatively high, indicating premium valuation.
- Return on equity at 5.9% is modest compared to industry peers, reflecting limited profitability.
- Current ratio of 0.83 points to potential short-term liquidity constraints.
Disclosure: This information is for general awareness and does not constitute investment advice
Report Summary
Aarti Industries Ltd. is a prominent Indian manufacturer specializing in specialty chemicals and pharmaceuticals. Listed on the NSE under the Basic Materials sector, the company operates across diverse segments including agrochemicals, polymers, pigments, and healthcare intermediates. With headquarters in Mumbai, it leverages advanced technology and robust R&D capabilities to serve both domestic and international markets, positioning itself as a key player in the global chemical supply chain.
Financially, Aarti Industries reported trailing twelve months (TTM) revenue of approximately ₹80.3 billion with a gross margin of 33.95%, operating margin of 8.84%, and net profit margin of 4.71%. The company’s return on equity (ROE) stands at 5.9%, return on assets (ROA) at 2.98%, and return on invested capital (ROIC) is reflected in an EV/EBITDA multiple of 19.46, indicating moderate profitability and operational efficiency within the specialty chemicals industry. Quarterly revenue growth was strong at 26%, and earnings per share (EPS) stood at ₹10.39.
Valuation metrics show a trailing price-to-earnings (P/E) ratio of 45.5 and a forward P/E of 30.1, with a price-to-book (P/B) ratio of 3.01. The market capitalization is approximately ₹171.6 billion, with the stock currently trading at ₹472.75, near its 52-week high of ₹495 and well above the 52-week low of ₹338.05. These figures suggest the stock is priced at a premium relative to earnings but with growth expectations priced in, supported by a PEG ratio of 0.29.
Key strengths include strong cash flow generation with operating cash flow of ₹2.91 billion and free cash flow of ₹3.31 billion, a diversified product portfolio, and strategic capacity expansions. The company maintains a manageable debt-to-equity ratio of 0.70, reflecting moderate leverage. Risks involve competitive pressures in the specialty chemicals sector, regulatory compliance challenges, and macroeconomic factors impacting raw material costs. Recent strategic actions include long-term feedstock supply contracts and capacity expansion initiatives, alongside leadership emphasizing sustainability and cost efficiency.
Technically, the stock exhibits a bullish momentum with prices above the 50-day and 200-day moving averages, supported by positive momentum indicators. Market sentiment appears cautiously optimistic, with recent news highlighting management’s focus on margin recovery and growth acceleration. Overall, the data suggests a balanced outlook where market participants may consider monitoring developments closely for further clarity on operational performance and valuation alignment.
Company and Industry Overview
Company Basics
Price Performance
Company Size
Shareholding Pattern
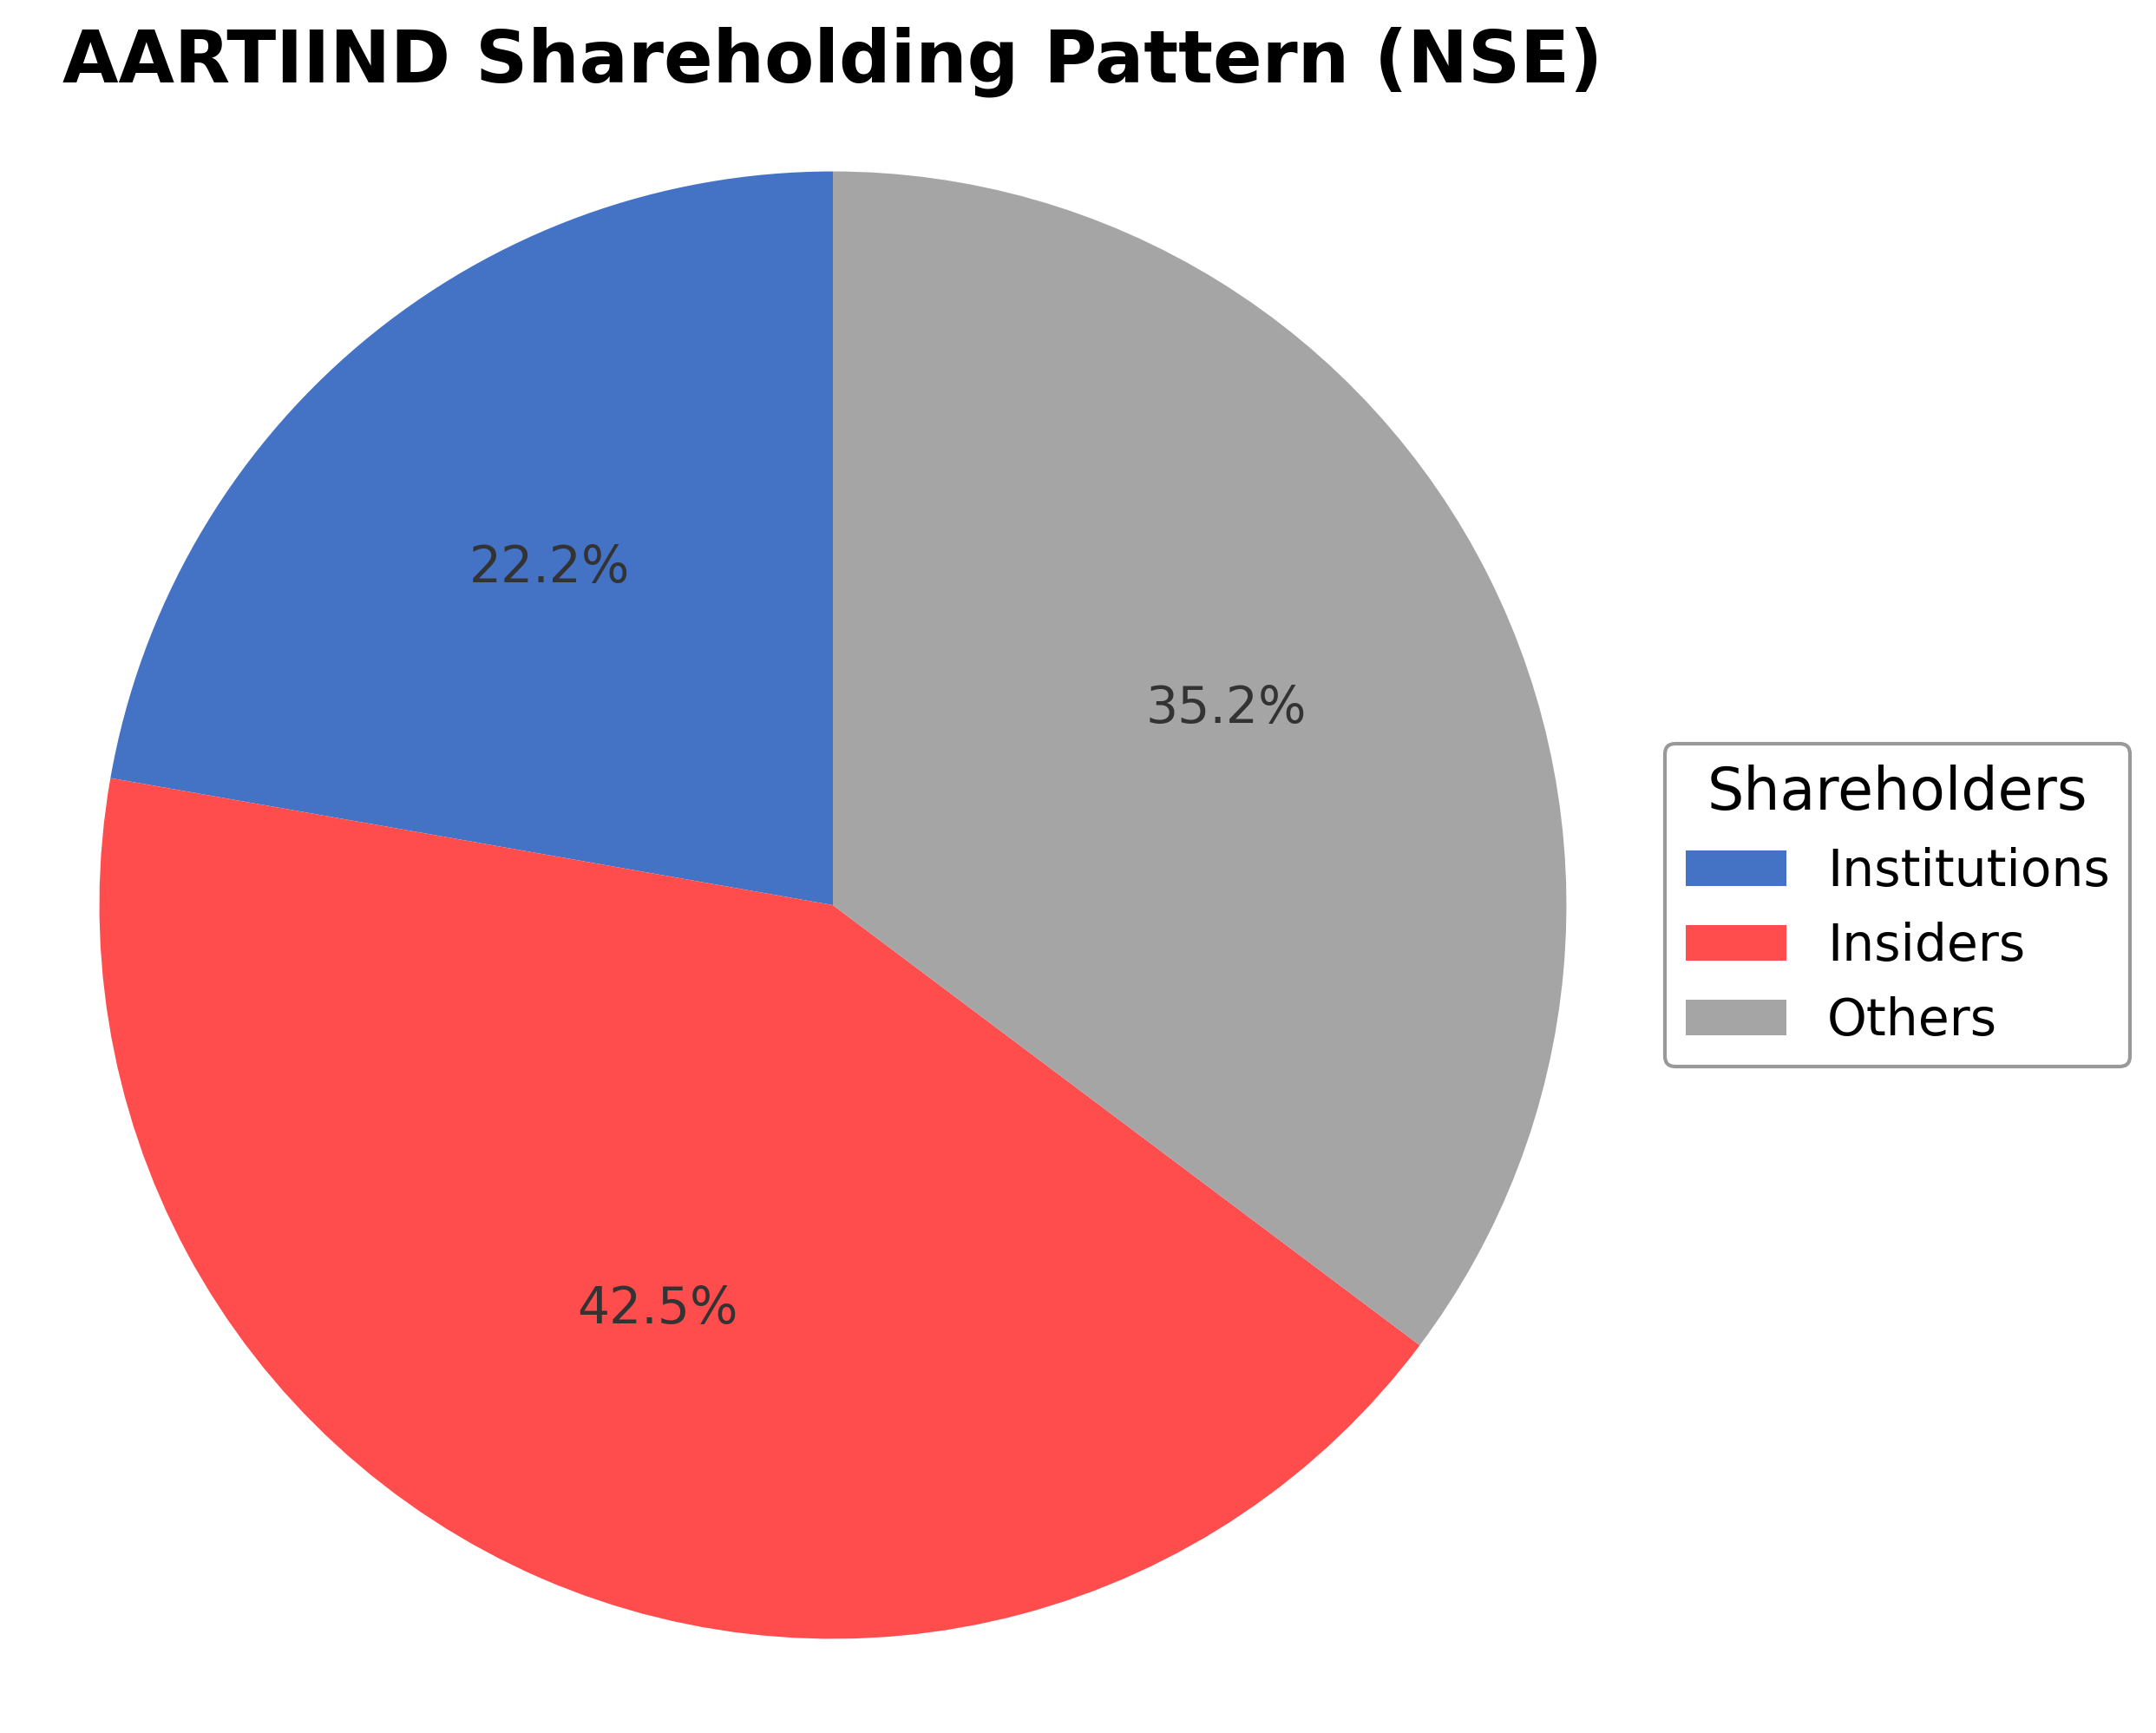
Aarti Industries Ltd. exhibits a shareholding structure with insiders holding approximately 42.53%, institutional investors controlling 22.23%, and the remaining 35.24% held by public and other shareholders. Over the past 12 to 24 months, the promoter holding has remained relatively stable, while institutional investors have shown moderate accumulation, reflecting confidence from mutual funds and asset managers. This ownership distribution suggests a balanced governance framework with significant promoter influence complemented by institutional oversight. The stable insider holding combined with growing institutional interest indicates a positive market sentiment and supports strategic continuity and potential future corporate initiatives.
Sector and Industry Analysis
The chemical sector, encompassing basic and specialty chemicals, is a significant contributor to the global manufacturing economy with a market size valued in the hundreds of billions of dollars. It has exhibited steady growth driven by demand from end-use industries such as pharmaceuticals, agrochemicals, polymers, and personal care products. Key players include large multinational corporations and diversified chemical manufacturers, with companies like Aarti Industries Ltd. operating prominently in the benzene-based intermediates segment, serving markets across the Americas, Europe, and Asia.
Industry trends highlight a shift towards sustainable and specialty chemicals, driven by innovation and increasing environmental awareness. Competitive dynamics are shaped by the need for technological advancement, scale, and integration across the value chain, creating high barriers to entry for new players. Companies differentiate themselves through R&D investment, digital transformation, and strategic partnerships, with Aarti Industries leveraging its manufacturing footprint in India and diversified product portfolio to maintain market positioning.
The regulatory landscape is characterized by stringent environmental, health, and safety standards imposed by governments worldwide, affecting production processes and product formulations. Compliance with chemical safety regulations such as REACH in Europe and EPA standards in the US is critical, influencing operational costs and market access. Ongoing regulatory developments emphasize sustainability and emissions reduction, which are expected to drive further innovation and capital expenditure within the sector.
Note: Analysis synthesized from industry research, market reports, and regulatory filings. Information is subject to change based on market conditions.
Financial Ratios Dashboard
Illustrative Scenario Analysis
DCF Assumptions:
Method: Two-Stage EPS-Priority Model
Financials
Peer Analysis
| Company Name | Market Cap | P/E Ratio | P/B Ratio | EV/EBITDA | Price to CFO |
|---|---|---|---|---|---|
| Aarti Industries Ltd. | ₹171.64B | 45.50 | 3.01 | 19.46 | 58.99 |
| Atul Ltd. | ₹196.69B | 33.10 | 3.32 | 18.37 | 41.50 |
| Jubilant Ingrevia Ltd. | ₹116.48B | 44.01 | 3.83 | 22.30 | 30.43 |
| Balaji Amines Ltd. | ₹40.52B | 28.10 | 2.15 | 18.01 | 15.31 |
| Linde India Ltd. | ₹615.45B | 104.16 | 16.11 | 73.53 | 94.89 |
| Asian Paints Ltd. | ₹2.38T | 62.89 | 12.34 | 41.05 | 50.29 |
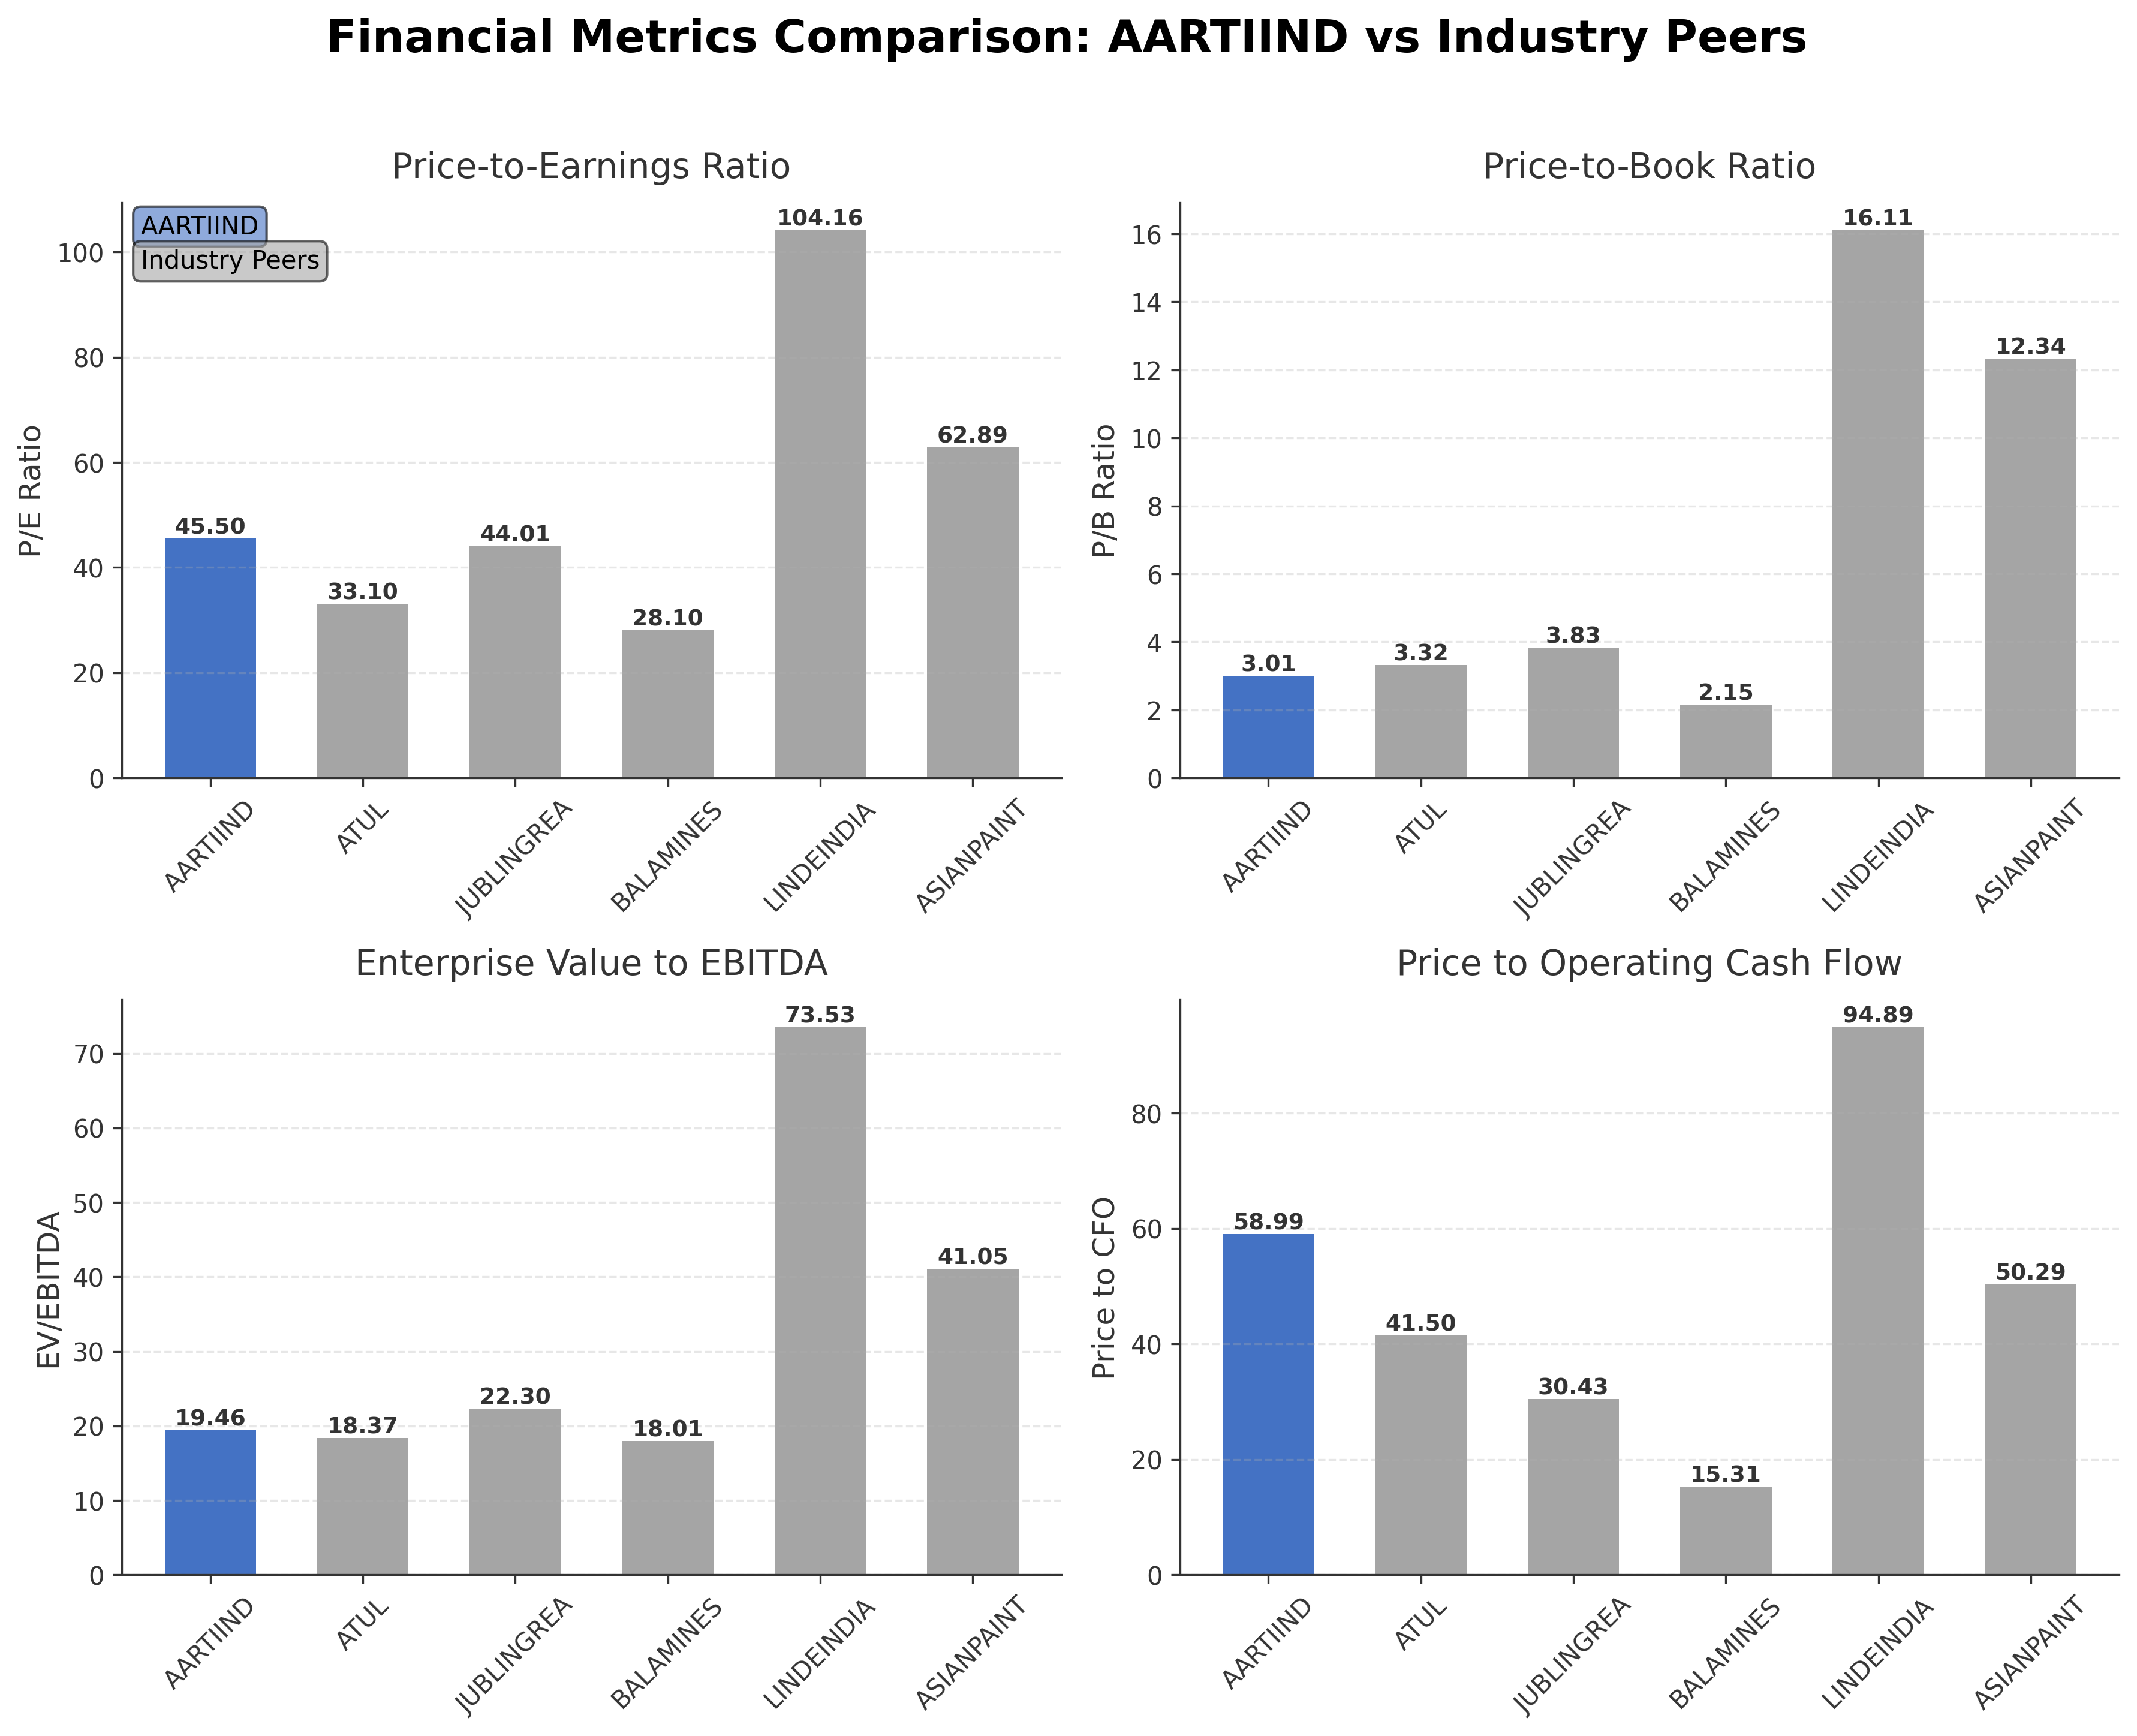
Comparison Analysis: Aarti Industries Ltd. trades at a higher P/E ratio of 45.50 compared to most regional peers such as Atul Ltd. (33.10) and Balaji Amines Ltd. (28.10), indicating relatively higher valuation expectations. Its P/B ratio of 3.01 is moderate, lower than Linde India Ltd. (16.11) and Asian Paints Ltd. (12.34), reflecting a more conservative book value pricing. The EV/EBITDA multiple of 19.46 is in line with industry standards but below the elevated multiples of Linde India and Asian Paints, suggesting balanced operational valuation. Return on equity at 6% is lower than peers like Asian Paints (18%) and Linde India (12%), highlighting potential room for profitability improvement. Overall, Aarti Industries shows competitive positioning with moderate valuation and growth metrics relative to its specialty chemicals sector peers.
Financial Metrics Comparison with Peers
Financial Statements
Comprehensive financial data including income, balance sheet, and cash flow metrics
Income Statement
| fiscal_date | 2025-03-31 | 2024-03-31 | 2023-03-31 | 2022-03-31 | 2021-03-31 |
|---|---|---|---|---|---|
| Sales | 71.31B | 61.93B | 64.92B | 51.91B | 43.05B |
| Cost Of Goods | 53.75B | 46.55B | 46.95B | 36.02B | 28.63B |
| Gross Profit | 17.56B | 15.38B | 17.98B | 15.89B | 14.42B |
| Operating Expense Selling General And Administrative | 4.35B | 3.09B | 4.31B | 3.87B | 2.62B |
| Operating Expense Other Operating Expenses | 11.93B | 11.12B | 13.03B | 19.40B | 600.00K |
| Operating Income | 6.00B | 6.23B | 7.96B | 14.86B | 7.66B |
| Non Operating Interest Income | 149.50M | 70.90M | 0.00 | N/A | N/A |
| Non Operating Interest Expense | 2.36B | 1.83B | 1.06B | 686.30M | 767.10M |
| Pretax Income | 3.07B | 3.95B | 6.11B | 13.72B | 6.65B |
| Income Tax | -236.30M | -210.50M | 658.70M | 1.86B | 1.29B |
| Net Income | 3.31B | 4.16B | 5.45B | 11.86B | 5.35B |
| Eps Basic | 9.13 | 11.49 | 15.04 | 32.71 | 15.02 |
| Eps Diluted | 9.12 | 11.49 | 15.04 | 32.71 | 15.02 |
| Basic Shares Outstanding | 362.53M | 362.50M | 362.50M | 362.50M | 348.47M |
| Diluted Shares Outstanding | 362.53M | 362.50M | 362.50M | 362.50M | 348.47M |
| Ebit | 5.44B | 5.79B | 7.17B | 14.41B | 7.41B |
| Ebitda | 9.86B | 9.62B | 10.28B | 16.87B | 9.73B |
| Net Income Continuous Operations | 3.05B | 3.95B | 6.11B | 13.72B | 6.65B |
| Minority Interests | 0.00 | 0.00 | 0.00 | -2.30M | -117.50M |
| Preferred Stock Dividends | 0.00 | 0.00 | 0.00 | 0.00 | 0.00 |
Data provided by Twelve Data
Balance Sheet
| fiscal_date | 2025-03-31 | 2024-03-31 | 2023-03-31 | 2022-03-31 | 2021-03-31 |
|---|---|---|---|---|---|
| Cash And Cash Equivalents | 1.99B | 417.80M | 1.67B | 936.30M | 4.10B |
| Accounts Receivable | 7.86B | 8.26B | 9.40B | 10.92B | 7.94B |
| Total Assets | 111.14B | 96.16B | 85.81B | 78.51B | 76.42B |
| Total Liabilities | 55.08B | 43.25B | 36.60B | 33.33B | 41.27B |
| Long Term Debt | 19.15B | 15.73B | 6.60B | 9.45B | 12.81B |
| Shareholders Equity | 56.05B | 52.90B | 49.21B | 45.17B | 35.15B |
Data provided by Twelve Data
Cash Flow Statement
| fiscal_date | 2025-03-31 | 2024-03-31 | 2023-03-31 | 2022-03-31 | 2021-03-31 |
|---|---|---|---|---|---|
| Operating Activities Net Income | 3.05B | 3.95B | 6.11B | 13.72B | 6.65B |
| Operating Activities Other Non Cash Items | 2.37B | 1.95B | 1.13B | 766.00M | 810.60M |
| Operating Activities Accounts Receivable | 437.70M | 685.50M | 4.22B | -4.98B | -250.10M |
| Operating Activities Other Assets Liabilities | -2.95B | -1.29B | -969.20M | -4.20B | -1.11B |
| Operating Activities Operating Cash Flow | 2.91B | 5.30B | 10.50B | 5.31B | 6.10B |
| Investing Activities Capital Expenditures | -13.79B | -13.04B | -13.26B | -11.65B | -13.14B |
| Investing Activities Net Acquisitions | -234.50M | 0.00 | 0.00 | 0.00 | 0.00 |
| Investing Activities Other Investing Activity | 600.00K | 400.00K | 600.00K | 500.00K | 500.00K |
| Investing Activities Investing Cash Flow | -14.02B | -13.04B | -13.30B | -11.69B | -13.22B |
| Financing Activities Long Term Debt Issuance | 7.03B | 12.92B | 15.27B | N/A | 10.08B |
| Financing Activities Long Term Debt Payments | -4.55B | -9.82B | -12.21B | N/A | -2.62B |
| Financing Activities Common Stock Issuance | 100.00K | N/A | 0.00 | 11.87B | 0.00 |
| Financing Activities Common Dividends | -362.50M | -543.80M | -906.30M | -1.27B | -450.90M |
| Financing Activities Other Financing Charges | -10.00M | -10.00M | N/A | N/A | N/A |
| Financing Activities Financing Cash Flow | 2.11B | 2.54B | 2.15B | 10.60B | 7.01B |
| End Cash Position | 1.99B | 1.30B | 2.01B | 1.74B | 4.12B |
| Free Cash Flow | -1.44B | -1.24B | -75.60M | -6.47B | -4.42B |
| Investing Activities Purchase Of Investments | N/A | N/A | -35.40M | -50.00M | -78.20M |
| Investing Activities Sale Of Investments | N/A | N/A | 0.00 | 5.20M | 0.00 |
| Financing Activities Common Stock Repurchase | N/A | N/A | N/A | N/A | N/A |
Data provided by Twelve Data
Technical Analysis
Key Insights
- The current trend shows a bullish momentum with the stock price trading above the 10-day, 50-day (₹431), and 200-day (₹396) moving averages, indicating upward price action.
- Key support levels are identified near ₹430 and ₹396, while resistance is observed close to the 52-week high of ₹495.
- The stock is positioned above major moving averages, suggesting sustained short to medium-term strength in price trends.
- Momentum indicators show RSI in a moderately strong zone, MACD indicates positive crossover, and Stochastic oscillators confirm bullish momentum.
- Multi-timeframe analysis reveals consistent upward trends on daily, weekly, and monthly charts, supporting a stable technical setup.
- Potential market scenarios include continuation of the uptrend if support levels hold, with possible consolidation near resistance before further directional moves.
Trending News
1. Headline: Why Is Aarti Industries Share Price Falling? Key Reasons 2026
Summary: Fourth, if Aarti Industries’s management provides clear and credible guidance on the margin recovery path and growth acceleration in FY27, the market could begin pricing in a recovery scenario before the numbers actually arrive. Stock markets are forward-looking, and a credible management narrative backed by improving operational data points can be enough to reverse a sentiment-driven decline. The contrarian view is that at Rs 380, some of the bad news ...
Sentiment: positive
2. Headline: Aarti Industries Limited Share Price & Analysis | MarketNetra
Summary: Aarti Industries Limited (AARTIIND) share price ₹462, fundamentals and daily price analysis. NSE-listed stock updated every trading day.
Sentiment: neutral
3. Headline: Top stocks in news: RIL, Infy, LTM, Tata Capital, Cyient, IEX, Adani Energy, Equitas SFB - BusinessToday
Summary: Stocks like Reliance, Infosys, LTM, Tata Capital, Cyient, IEX, Adani Energy Solutions, Equitas SFB, Gujarat Gas, Rolex Rings and more will be in the spotlight on Friday, April 24.
Sentiment: neutral
4. Headline: Aarti Industries Ltd. is Rated Hold by MarketsMOJO
Summary: Aarti Industries Ltd. is rated 'Hold' by MarketsMOJO, with this rating last updated on 09 Mar 2026. However, the analysis and financial metrics discussed here reflect the company’s current position as of 23 April 2026, providing investors with an up-to-date perspective on the stock’s ...
Sentiment: neutral
5. Headline: 15 bottom up stock investment ideas as smallcap, midcap shares back to pre Iran war levels - BusinessToday
Summary: While Nuvama Alternative & Quantitative ... auto ancillaries. The brokerage preferred stocks such as ACME Solar Holdings Ltd, Coforge Ltd, Page Industries Ltd, UNO Minda, NMDC Ltd, Gravita India Ltd, PG Electroplast Ltd and Aarti Industries Ltd....
Sentiment: positive
Powered by Brave
Recent Updates
News Summary
As of 2026-04-26. Recent updates for Aarti Industries Ltd. highlight the company’s strategic growth focus in FY25, emphasizing cost efficiency, capacity expansion, and sustainability initiatives as outlined by CEO Suyog Kotecha. Financial results show quarterly revenue of ₹2,250 crore and EBITDA of ₹292 crore, reflecting operational strength. The company continues to secure long-term feedstock supply contracts to support production stability. Board meetings are scheduled to consider quarterly financial results, indicating ongoing transparency and governance. Certifications including ISO standards and sustainability ratings reinforce the company’s commitment to environmental and operational excellence.
News Sentiment
The overall sentiment from recent updates is neutral to positive, driven by strategic growth initiatives and stable financial performance. Positive tones emerge from management’s focus on sustainability and capacity expansion, while neutral sentiment is maintained due to routine governance activities and scheduled financial disclosures. No significant negative developments were reported, supporting a balanced outlook grounded in operational and strategic progress.
Source List
- https://www.aarti-industries.com/investor-relations
- https://www.aarti-industries.com/investors/financial-information
- https://economictimes.indiatimes.com/aarti-industries-ltd/stocksupdate/companyid-11400.cms
- https://trendlyne.com/latest-news/14/AARTIIND/aarti-industries-ltd/
- https://www.alphaspread.com/security/nse/aartiind/investor-relations
Analytical Overview
Analysis Summary
Aarti Industries’ valuation metrics, including a trailing P/E of 45.5 and forward P/E of 30.1, are elevated relative to the industry average P/E of 45.5 but supported by a low PEG ratio of 0.29, indicating growth expectations. The company’s revenue growth of 26% quarter-over-quarter and positive cash flow trends with operating cash flow of ₹2.91 billion demonstrate a solid growth trajectory. Financial health is moderate with a debt-to-equity ratio of approximately 0.70 and free cash flow of ₹3.31 billion, suggesting manageable leverage and liquidity. Sector-specific challenges include raw material price volatility and regulatory compliance, while opportunities arise from expanding specialty chemical demand and sustainability trends. Considering India-specific factors, the company benefits from a growing domestic chemical industry and increasing export opportunities amid evolving regulatory frameworks.
Overall Business and Market Assessment
Supporting Factors: strong revenue growth at 26%, robust cash flow generation, and strategic capacity expansion initiatives
Risk Factors: No data
SWOT Analysis
Strengths
- Diverse product portfolio serving multiple industries.
- Strong revenue growth of 26% quarter-over-quarter.
- Robust cash flow generation with positive free cash flow.
- Strategic capacity expansions and sustainability focus.
Weaknesses
- Moderate return on equity at approximately 6%.
- Debt-to-equity ratio of 0.70 indicates moderate leverage.
- Current ratio below 1 at 0.83, suggesting liquidity constraints.
- Relatively high valuation multiples compared to some peers.
Opportunities
- Growing demand for specialty chemicals domestically and internationally.
- Expansion into eco-friendly and sustainable chemical solutions.
- Long-term feedstock supply contracts securing raw material availability.
- Increasing export opportunities amid global chemical industry growth.
Threats
- Volatility in raw material prices impacting margins.
- Regulatory compliance challenges in multiple jurisdictions.
- Intense competition within the specialty chemicals sector.
- Macroeconomic factors affecting industrial demand and costs.
Company Description
Aarti Industries Ltd. is a leading Indian chemical manufacturer specializing in the production of specialty chemicals and pharmaceuticals. The company's primary focus lies in creating a diverse portfolio of high-performance chemicals that serve various industries including agrochemicals, polymers, pigments, and pharmaceuticals. Notable for its robust capabilities in chemistry, Aarti Industries Ltd. provides crucial intermediates that support global industrial applications ranging from manufacture of dyes and pigments, additives, to those required in healthcare and agrichemicals. The company is strategically significant in the chemical supply chain, enabling sectors to enhance product performance and efficiency. Headquartered in Mumbai, India, Aarti Industries Ltd. leverages cutting-edge technology and infrastructure, ensuring compliance with rigorous safety and environmental standards. Its expansive production and R&D facilities allow for continuous innovation and adaptability, reinforcing its market position both domestically and internationally. As such, Aarti Industries Ltd. plays a pivotal role in bridging raw chemical production and end-user product transformations across multiple industry sectors.