


Aarti Industries Ltd (AARTIIND)
Stock Analysis Report
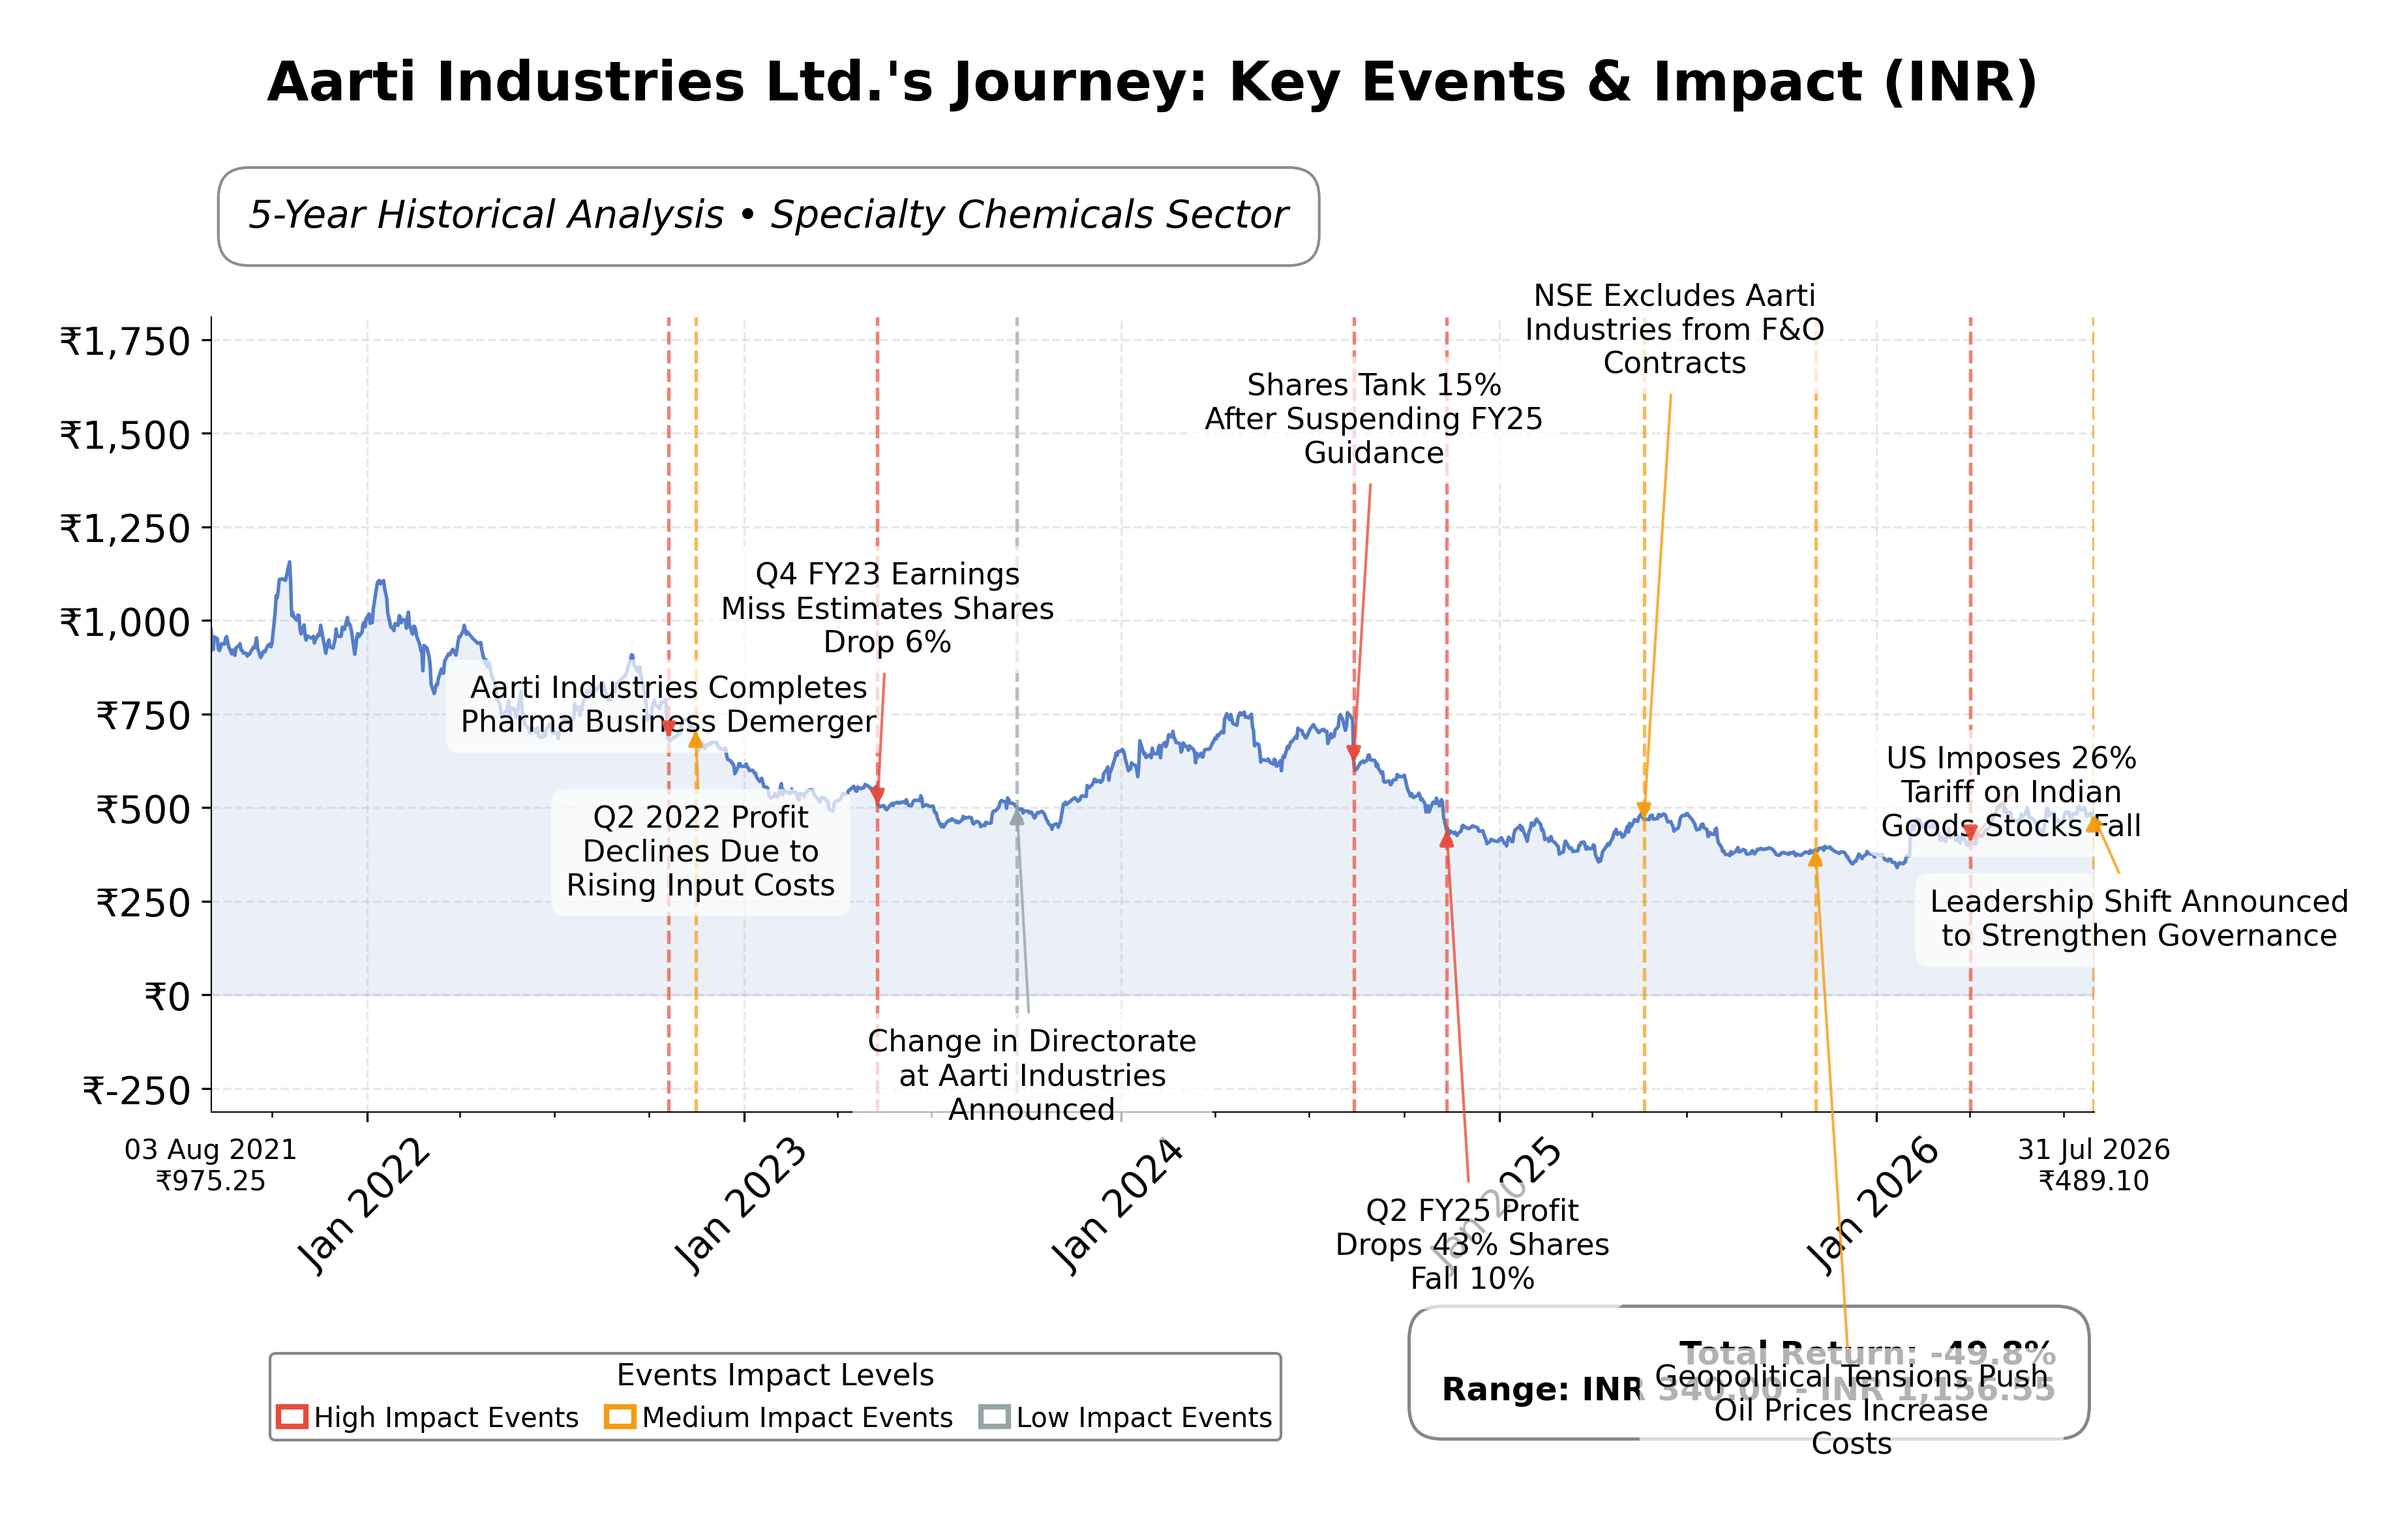
Stock Journey
Key Positives and Key Risks
Pros
- Aarti Industries’ revenue grew 13.2% year-over-year, indicating solid top-line expansion.
- The company maintains a manageable debt-to-equity ratio of 0.83, supporting financial stability.
- The forward P/E ratio of 23.75 is lower than the trailing P/E of 42.67, suggesting improved earnings expectations.
Cons
- Return on equity at 7.25% is significantly lower than industry peers, indicating less efficient capital use.
- Negative free cash flow of INR -6.46 billion reflects ongoing capital expenditure pressures.
- The current ratio of 0.83 signals potential short-term liquidity challenges.
Disclosure: This information is for general awareness and does not constitute investment advice
Report Summary
Aarti Industries Ltd. is a prominent Indian chemical manufacturer listed on the National Stock Exchange of India (NSE), operating within the Basic Materials sector and specializing in Specialty Chemicals. The company produces a diverse range of high-performance chemicals and pharmaceutical intermediates serving industries such as agrochemicals, polymers, pigments, and healthcare. Headquartered in Mumbai, Aarti Industries leverages advanced technology and extensive R&D capabilities to maintain a strong market position domestically and internationally, supplying critical chemical building blocks to various industrial customers.
Financially, the company reported trailing twelve months (TTM) revenue of approximately INR 82.86 billion with a gross margin of 40.1%, operating margin of 9.8%, and a net profit margin of 5.06%. Return on equity (ROE) stands at 7.25%, and return on assets (ROA) at 3.47%, indicating moderate profitability and asset utilization efficiency. The company’s operating cash flow totaled INR 7.81 billion TTM, although free cash flow was negative at INR -6.46 billion, reflecting ongoing capital expenditures and working capital investments.
Valuation metrics show a trailing price-to-earnings (P/E) ratio of 42.67 and a forward P/E of 23.75, with a price-to-book (P/B) ratio of 2.89 and an enterprise value to EBITDA (EV/EBITDA) of 18.80. The market capitalization is approximately INR 173.31 billion. The stock trades near INR 489, within a 52-week range of INR 338.05 to INR 523.10, suggesting it is currently closer to its upper trading band. The PEG ratio of 0.22 indicates the stock’s valuation relative to its earnings growth rate is relatively low.
Key strengths include a diversified product portfolio, strong market presence in specialty chemicals, and a solid balance sheet with total assets of INR 133 billion and manageable debt levels (debt-to-equity ratio of 0.83). Risks involve geopolitical tensions affecting supply chains, competitive pressures in the chemical industry, and margin volatility due to raw material price fluctuations. Recent strategic actions include leadership changes aimed at strengthening governance and growth, as well as a robust Q1 FY27 earnings performance with significant year-over-year revenue and profit growth despite operational headwinds.
Technically, the stock is trading above its 50-day and 200-day moving averages, with momentum indicators reflecting positive trends across multiple timeframes. Recent news highlights a strong rebound in earnings and operational resilience. Overall, the current data suggests a market environment where accumulation and monitoring of ongoing developments may be prudent, reflecting balanced opportunities and risks in the near term.
Company and Industry Overview
Company Basics
Price Performance
Company Size
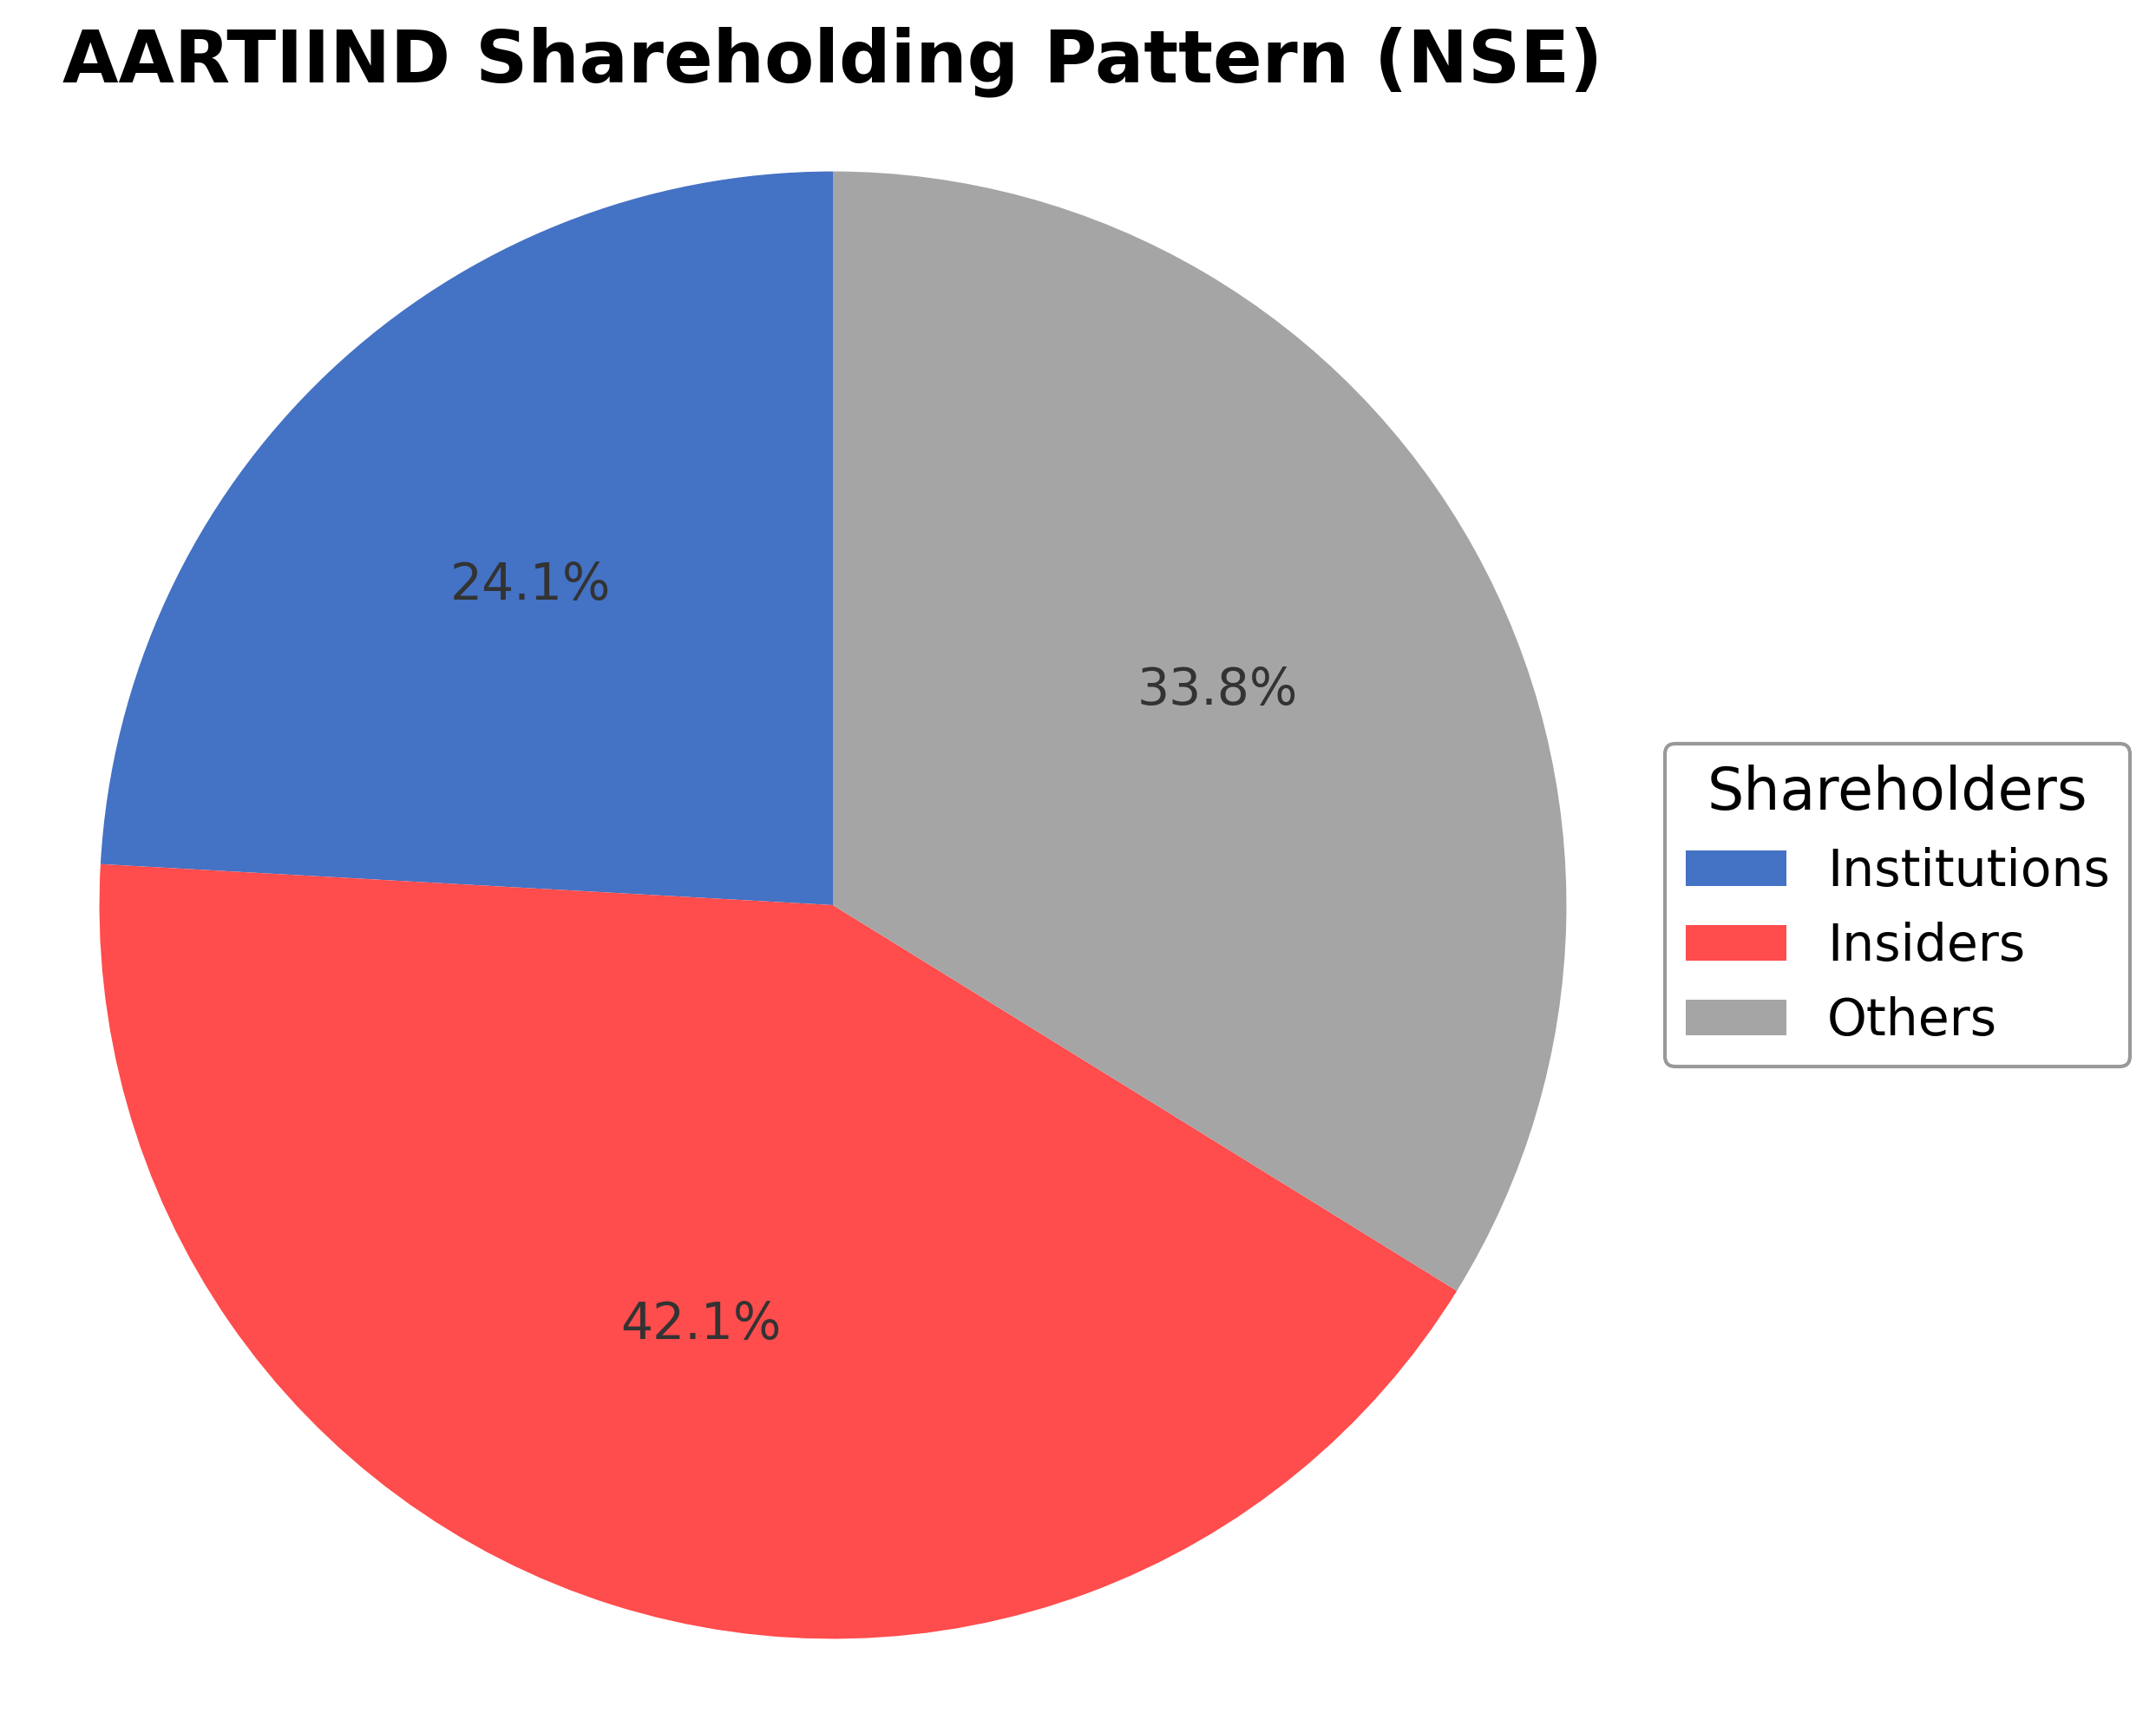
Shareholding Pattern
Sector and Industry Analysis
The specialty chemicals sector in India, including organic and inorganic chemical manufacturing, has witnessed steady growth driven by rising demand from pharmaceuticals, agrochemicals, and automotive industries. The market size is substantial, with companies like Aarti Industries, PI Industries, and Vinati Organics among the key players commanding significant market share. Growth is supported by increasing exports and domestic consumption, with the sector benefiting from India's cost competitiveness and expanding chemical value chains.
Industry trends highlight a shift towards high-value specialty chemicals with complex formulations, driven by innovation and customer-specific solutions. Barriers to entry remain high due to capital intensity, technological expertise, and stringent quality standards. Established players like Aarti Industries leverage integrated manufacturing facilities and diversified product portfolios to maintain competitive advantage, while smaller firms face challenges in scaling operations and meeting regulatory compliance.
The regulatory landscape is shaped by environmental norms, safety standards, and export-import policies impacting chemical manufacturing. Compliance with pollution control measures and hazardous waste management is critical, influencing operational costs and capacity expansions. Government initiatives promoting domestic manufacturing and export incentives provide a positive outlook, though companies must navigate evolving regulations to sustain growth and competitiveness.
Note: Analysis synthesized from industry research, market reports, and regulatory filings. Information is subject to change based on market conditions.
Financial Ratios Dashboard
Illustrative Scenario Analysis
DCF Assumptions:
Method: Two-Stage EPS-Priority Model
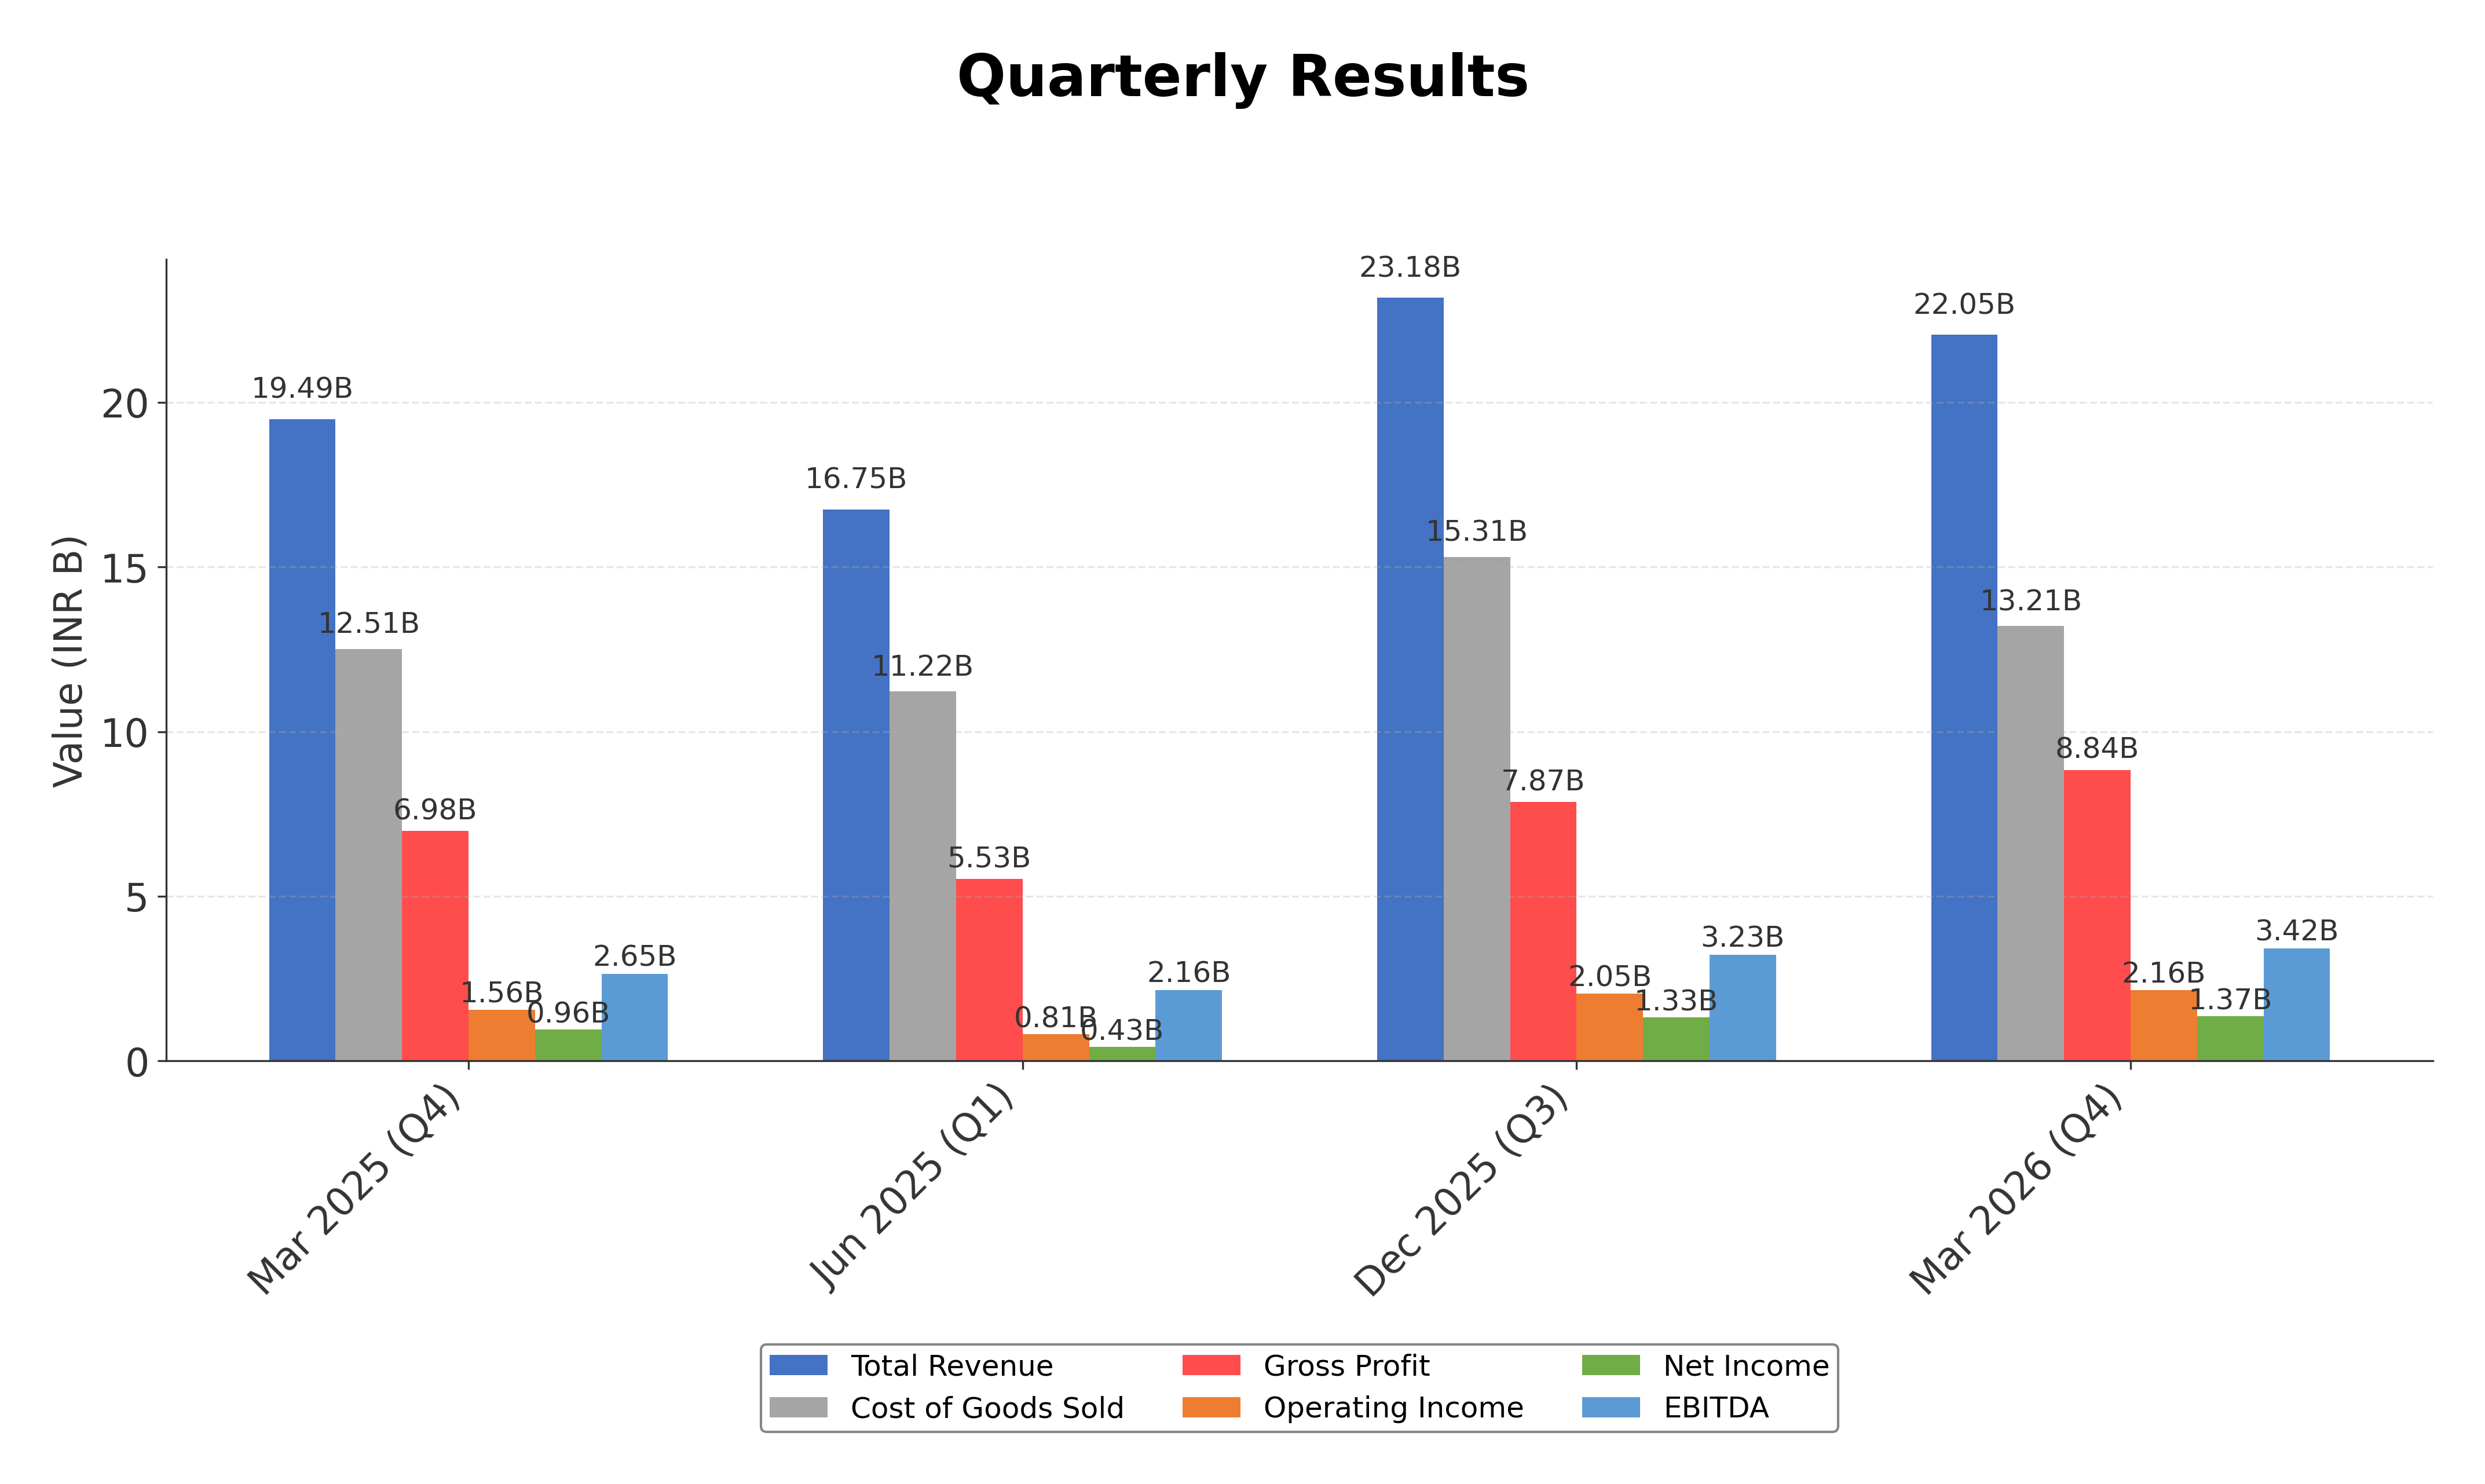
Financials
Peer Analysis
| Company Name | Market Cap | P/E Ratio | P/B Ratio | EV/EBITDA | Price to CFO |
|---|---|---|---|---|---|
| Aarti Industries Ltd. | ₹173.31B | 42.67 | 2.89 | 18.8 | 22.19 |
| Asian Paints Ltd. | ₹2.53T | 58.48 | 11.84 | 39.53 | 35.68 |
| Solar Industries India Ltd. | ₹1.67T | 99.32 | 26.66 | 64.53 | 269.54 |
| Fine Organic Industries Ltd. | ₹148.04B | 34.89 | 5.46 | 27.27 | 34.46 |
| Clean Science & Technology Ltd. | ₹76.63B | 34.12 | 4.89 | 20.78 | 27.91 |
| Berger Paints India Ltd | ₹582.07B | 51.26 | 8.32 | 32.61 | 37.8 |
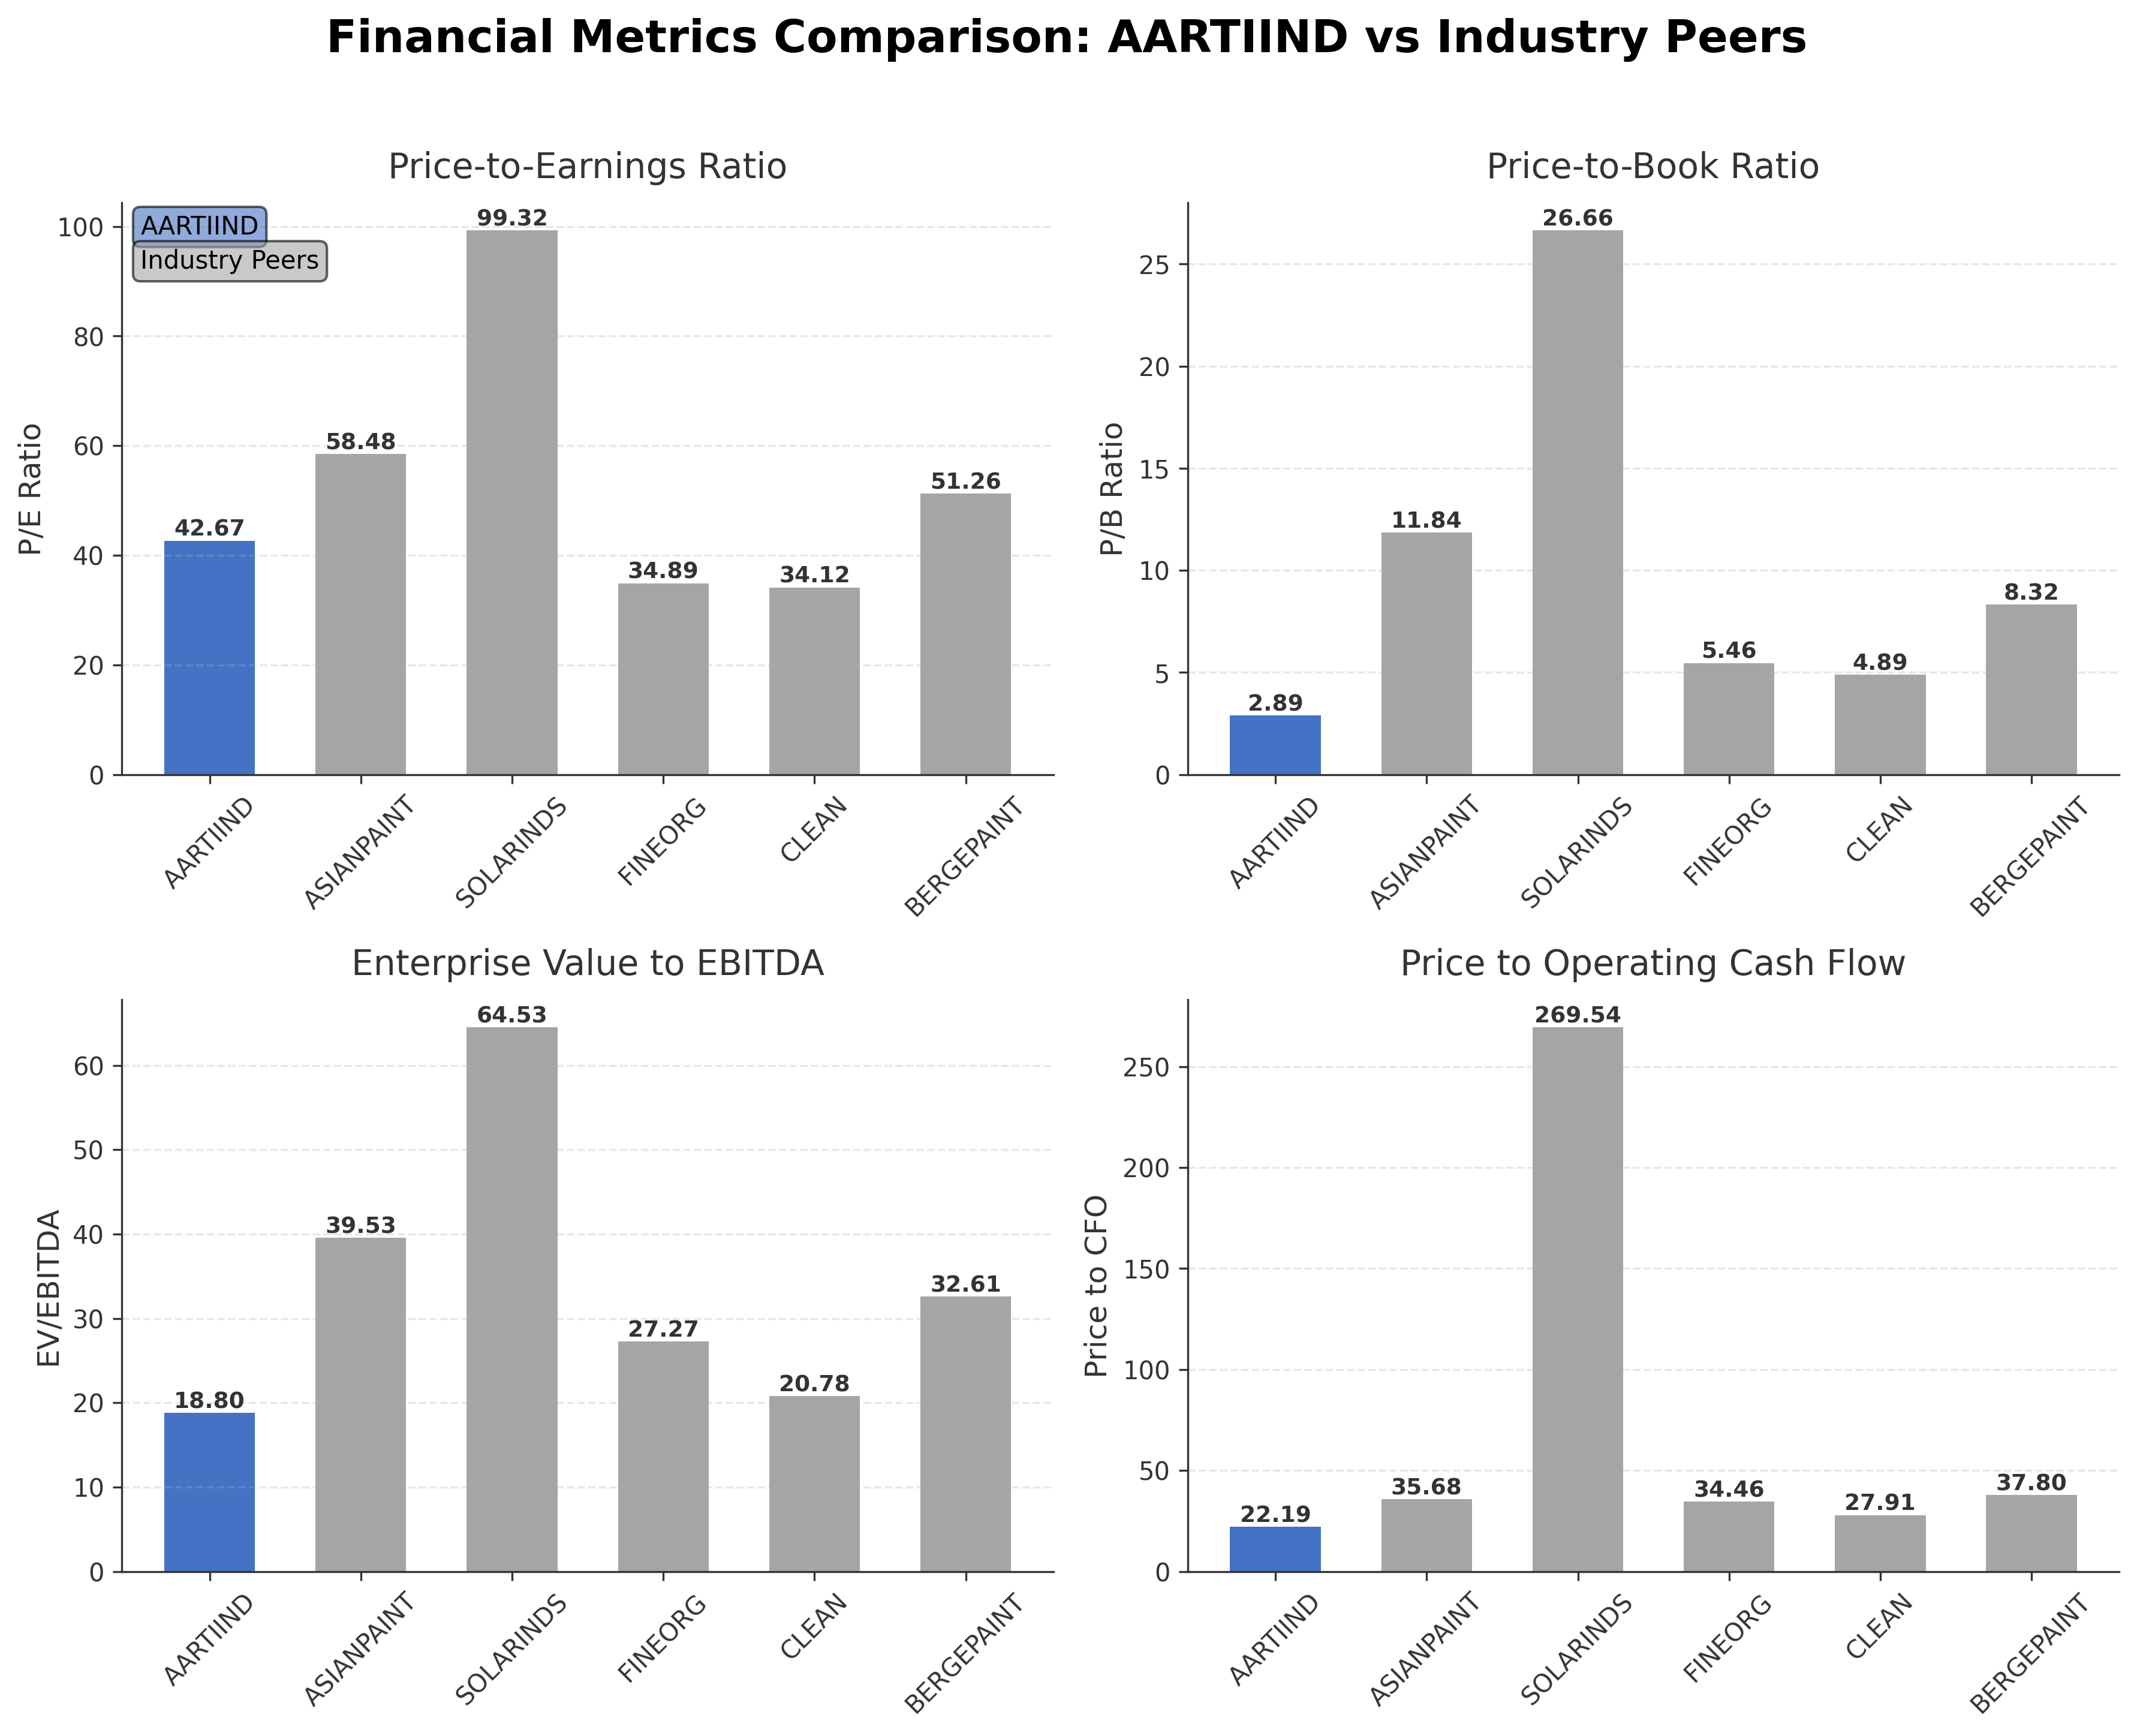
Comparison Analysis: Aarti Industries Ltd. trades at a lower market capitalization compared to major industry peers such as Asian Paints and Solar Industries India. Its P/E ratio of 42.67 is moderate relative to the higher valuations of peers like Solar Industries (99.32) and Asian Paints (58.48), indicating a more conservative earnings multiple. The company’s P/B ratio of 2.89 is significantly lower than peers, suggesting a more attractive valuation on book value basis. EV/EBITDA at 18.80 is also below the peer average, reflecting relatively better operational valuation. However, Aarti’s return on equity at 7.25% is notably lower than peer averages, highlighting potential room for improvement in profitability and capital efficiency.
Financial Metrics Comparison with Peers
Financial Statements
Comprehensive financial data including income, balance sheet, and cash flow metrics
Income Statement
| fiscal_date | 2026-03-31 | 2025-03-31 | 2024-03-31 | 2023-03-31 | 2022-03-31 |
|---|---|---|---|---|---|
| Sales | 82.86B | 72.69B | 61.93B | 64.92B | 51.91B |
| Cost Of Goods | 53.49B | 46.55B | 46.55B | 46.95B | 36.02B |
| Gross Profit | 29.37B | 26.14B | 15.38B | 17.98B | 15.89B |
| Operating Expense Other Operating Expenses | 13.64B | 11.67B | 11.12B | 13.03B | 19.40B |
| Operating Income | 6.77B | 5.66B | 6.23B | 7.96B | 14.86B |
| Non Operating Interest Expense | 3.40B | 2.75B | 1.83B | 1.06B | 686.30M |
| Pretax Income | 3.65B | 3.07B | 3.95B | 6.11B | 13.72B |
| Income Tax | -540.00M | -230.00M | -210.50M | 658.70M | 1.86B |
| Net Income | 4.19B | 3.31B | 4.16B | 5.45B | 11.86B |
| Eps Basic | 11.56 | 9.13 | 11.49 | 15.04 | 32.71 |
| Eps Diluted | 11.55 | 9.12 | 11.49 | 15.04 | 32.71 |
| Basic Shares Outstanding | 362.46M | 362.54M | 362.50M | 362.50M | 362.50M |
| Diluted Shares Outstanding | 362.46M | 362.54M | 362.50M | 362.50M | 362.50M |
| Ebit | 7.05B | 5.82B | 5.79B | 7.17B | 14.41B |
| Ebitda | 11.72B | 10.14B | 9.62B | 10.28B | 16.87B |
| Net Income Continuous Operations | 3.58B | 3.05B | 3.95B | 6.11B | 13.72B |
| Minority Interests | 0.00 | 0.00 | 0.00 | 0.00 | -2.30M |
| Preferred Stock Dividends | 0.00 | 0.00 | 0.00 | 0.00 | 0.00 |
| Operating Expense Selling General And Administrative | N/A | 4.35B | 3.09B | 4.31B | 3.87B |
| Non Operating Interest Income | N/A | 149.50M | 70.90M | 0.00 | N/A |
Data provided by Twelve Data
Balance Sheet
| fiscal_date | 2026-03-31 | 2025-03-31 | 2024-03-31 | 2023-03-31 | 2022-03-31 |
|---|---|---|---|---|---|
| Cash And Cash Equivalents | 5.83B | 1.99B | 417.80M | 1.67B | 936.30M |
| Accounts Receivable | 14.03B | 7.86B | 8.26B | 9.40B | 10.92B |
| Total Assets | 132.99B | 111.14B | 96.16B | 85.81B | 78.51B |
| Total Liabilities | 73.44B | 55.08B | 43.25B | 36.60B | 33.33B |
| Long Term Debt | 22.22B | 19.15B | 15.73B | 6.60B | 9.45B |
| Shareholders Equity | 59.55B | 56.05B | 52.90B | 49.21B | 45.17B |
Data provided by Twelve Data
Cash Flow Statement
| fiscal_date | 2026-03-31 | 2025-03-31 | 2024-03-31 | 2023-03-31 | 2022-03-31 |
|---|---|---|---|---|---|
| Operating Activities Net Income | 3.58B | 3.05B | 3.95B | 6.11B | 13.72B |
| Operating Activities Stock Based Compensation | 100.00M | 70.00M | N/A | N/A | N/A |
| Operating Activities Other Non Cash Items | 3.36B | 2.59B | 1.95B | 1.13B | 766.00M |
| Operating Activities Accounts Receivable | -6.93B | 310.00M | 685.50M | 4.22B | -4.98B |
| Operating Activities Other Assets Liabilities | -2.79B | -3.50B | -1.29B | -969.20M | -4.20B |
| Operating Activities Operating Cash Flow | 7.81B | 12.42B | 5.30B | 10.50B | 5.31B |
| Investing Activities Net Acquisitions | -640.00M | -230.00M | 0.00 | 0.00 | 0.00 |
| Investing Activities Other Investing Activity | -11.32B | -13.79B | 400.00K | 600.00K | 500.00K |
| Investing Activities Investing Cash Flow | -11.96B | -14.02B | -13.04B | -13.30B | -11.69B |
| Financing Activities Long Term Debt Issuance | 12.51B | 7.04B | 12.92B | 15.27B | N/A |
| Financing Activities Long Term Debt Payments | -2.42B | -4.55B | -9.82B | -12.21B | N/A |
| Financing Activities Common Stock Issuance | -110.00M | -100.00M | N/A | 0.00 | 11.87B |
| Financing Activities Common Dividends | -360.00M | -360.00M | -543.80M | -906.30M | -1.27B |
| Financing Activities Financing Cash Flow | 9.62B | 2.02B | 2.54B | 2.15B | 10.60B |
| End Cash Position | 5.83B | 1.99B | 1.30B | 2.01B | 1.74B |
| Free Cash Flow | 7.81B | 12.42B | -1.24B | -75.60M | -6.47B |
| Financing Activities Other Financing Charges | N/A | -10.00M | -10.00M | N/A | N/A |
| Investing Activities Capital Expenditures | N/A | N/A | -13.04B | -13.26B | -11.65B |
| Investing Activities Purchase Of Investments | N/A | N/A | N/A | -35.40M | -50.00M |
| Investing Activities Sale Of Investments | N/A | N/A | N/A | 0.00 | 5.20M |
Data provided by Twelve Data
Technical Analysis
Key Insights
- Aarti Industries is currently in an uptrend with price action maintaining above key moving averages, indicating bullish momentum.
- Immediate support levels are identified near ₹475 and ₹425, while resistance is observed around the 52-week high of ₹523.
- The stock price is trading above the 10-day (not specified), 50-day (₹474.87), and 200-day (₹424.93) moving averages, suggesting sustained positive momentum.
- Momentum indicators show RSI in a moderately strong zone without overbought conditions, MACD indicates bullish crossover, and stochastic oscillators confirm upward momentum.
- Daily, weekly, and monthly timeframes consistently show strength, with no significant bearish divergences detected.
- Current technical setup suggests potential continuation of the upward trend, with possible consolidation near resistance levels before further directional moves.
Trending News
1. Headline: Stock Market Today: All You Need To Know Before Going Into Trade On Aug 3
Summary: Stocks in the news, big brokerage calls of the day, complete trade setup and much more!
Sentiment: neutral
2. Headline: Aarti Drugs consolidated net profit declines 6.94% in the June 2026 quarter | Capital Market News - Business Standard
Summary: Home / Markets / Capital Market News / Aarti Drugs consolidated net profit declines 6.94% in the June 2026 quarter
Sentiment: negative
3. Headline: Aarti Industries Q1 Results: Earnings call audio recording uploaded
Summary: The disclosure was filed with the Listing/Compliance Department of both BSE Ltd. and the National Stock Exchange of India Limited. Raj Kumar Sarraf, Company Secretary of Aarti Industries Limited, signed the communication on July 31, 2026.
Sentiment: neutral
4. Headline: Aarti Industries Q1 FY27 slides: strong rebound amid geopolitical shift By Investing.com
Summary: Aarti Industries presented its Q1 FY27 performance update on July 31, 2026, revealing a substantial financial rebound despite significant operational headwinds. The specialty chemicals manufacturer navigated geopolitical disruptions in West Asia while delivering strong year-over-year growth across key financial metrics, though sequential volume trends highlighted ongoing market challenges. The company’s stock ...
Sentiment: positive
5. Headline: Earnings call transcript: Aarti Industries posts strong Q1 2026 gains By Investing.com
Summary: Aarti Industries said first-quarter results for fiscal 2027 were strong, with revenue rising 41% year over year to INR 2,627 crores, EBITDA increasing 79% to INR 385 crores and profit after tax climbing 66% to INR 155 crores. The company said the gains came despite geopolitical tensions, higher raw material prices and supply-chain disruptions. The stock ...
Sentiment: positive
Powered by Brave
Recent Updates
News Summary
As of August 3, 2026. Aarti Industries has recently undergone a leadership transition designed to strengthen governance and support its growth trajectory. The company reported a strong Q1 FY27 earnings performance, with significant year-over-year revenue and profit increases despite geopolitical and supply chain challenges. Investor resources and financial disclosures have been updated to reflect ongoing developments, including detailed quarterly results and sustainability certifications. The company maintains a diversified specialty chemicals portfolio with ongoing capital expenditure projects aimed at expanding capacity and product offerings.
News Sentiment
The overall sentiment from recent updates is predominantly positive, driven by strong quarterly financial results and strategic leadership changes. Positive investor communications and sustainability achievements further bolster confidence. However, some neutral tones arise from routine disclosures and the absence of major new announcements. There are no significant negative developments reported in the recent updates, indicating stable operational and governance conditions.
Source List
- https://www.alphaspread.com/security/nse/aartiind/investor-relations
Analytical Overview
Analysis Summary
Aarti Industries’ valuation metrics show a trailing P/E of 42.67 and a forward P/E of 23.75, which are below some industry peers but align closely with the specialty chemicals sector average of 42.67, indicating a fairly valued stock relative to earnings. The company’s revenue growth rate of 13.2% and positive operating cash flow trend suggest a solid growth trajectory supported by expanding product lines and market demand. Financial health is moderate with a debt-to-equity ratio of 0.83 and total cash of INR 6.09 billion, though negative free cash flow indicates ongoing investment needs. Sector-specific challenges include raw material price volatility and geopolitical risks, while opportunities arise from increasing demand for specialty chemicals in pharmaceuticals and agrochemicals. Considering India-specific factors, regulatory compliance and sustainability certifications enhance the company’s competitive positioning amid evolving environmental standards.
Overall Business and Market Assessment
Supporting Factors: robust revenue growth and improving profitability, a diversified product portfolio, and strategic leadership changes enhancing governance
Risk Factors: the company’s negative free cash flow, moderate return on equity relative to peers, and external geopolitical and raw material cost pressures
SWOT Analysis
Strengths
- Aarti Industries has a diversified portfolio of specialty chemicals serving multiple industries.
- The company maintains strong technological capabilities and extensive R&D infrastructure.
- Robust market presence in India and growing international footprint enhances competitiveness.
- Leadership changes aim to strengthen governance and support strategic growth.
Weaknesses
- Negative free cash flow indicates ongoing capital expenditure and working capital demands.
- Return on equity at 7.25% is lower than key industry peers, suggesting room for efficiency improvement.
- Current ratio below 1 (0.83) reflects potential short-term liquidity constraints.
- Profit margins are moderate, with net margin at approximately 5.06%.
Opportunities
- Growing demand for specialty chemicals in pharmaceuticals and agrochemicals sectors.
- Expansion of product offerings and capacity through ongoing capital projects.
- Increasing focus on sustainability and regulatory compliance may open new markets.
- Potential to leverage long-term supply relationships for stable revenue growth.
Threats
- Geopolitical tensions and supply chain disruptions could impact operations.
- Raw material price volatility may pressure profit margins.
- Intense competition in the specialty chemicals industry could affect market share.
- Regulatory changes in environmental and safety standards may increase compliance costs.
Company Description
Aarti Industries Ltd. is a leading Indian chemical manufacturer specializing in the production of specialty chemicals and pharmaceuticals. The company's primary focus lies in creating a diverse portfolio of high-performance chemicals that serve various industries including agrochemicals, polymers, pigments, and pharmaceuticals. Notable for its robust capabilities in chemistry, Aarti Industries Ltd. provides crucial intermediates that support global industrial applications ranging from manufacture of dyes and pigments, additives, to those required in healthcare and agrichemicals. The company is strategically significant in the chemical supply chain, enabling sectors to enhance product performance and efficiency. Headquartered in Mumbai, India, Aarti Industries Ltd. leverages cutting-edge technology and infrastructure, ensuring compliance with rigorous safety and environmental standards. Its expansive production and R&D facilities allow for continuous innovation and adaptability, reinforcing its market position both domestically and internationally. As such, Aarti Industries Ltd. plays a pivotal role in bridging raw chemical production and end-user product transformations across multiple industry sectors.