
AAPL (AAPL)
Stock Analysis Report
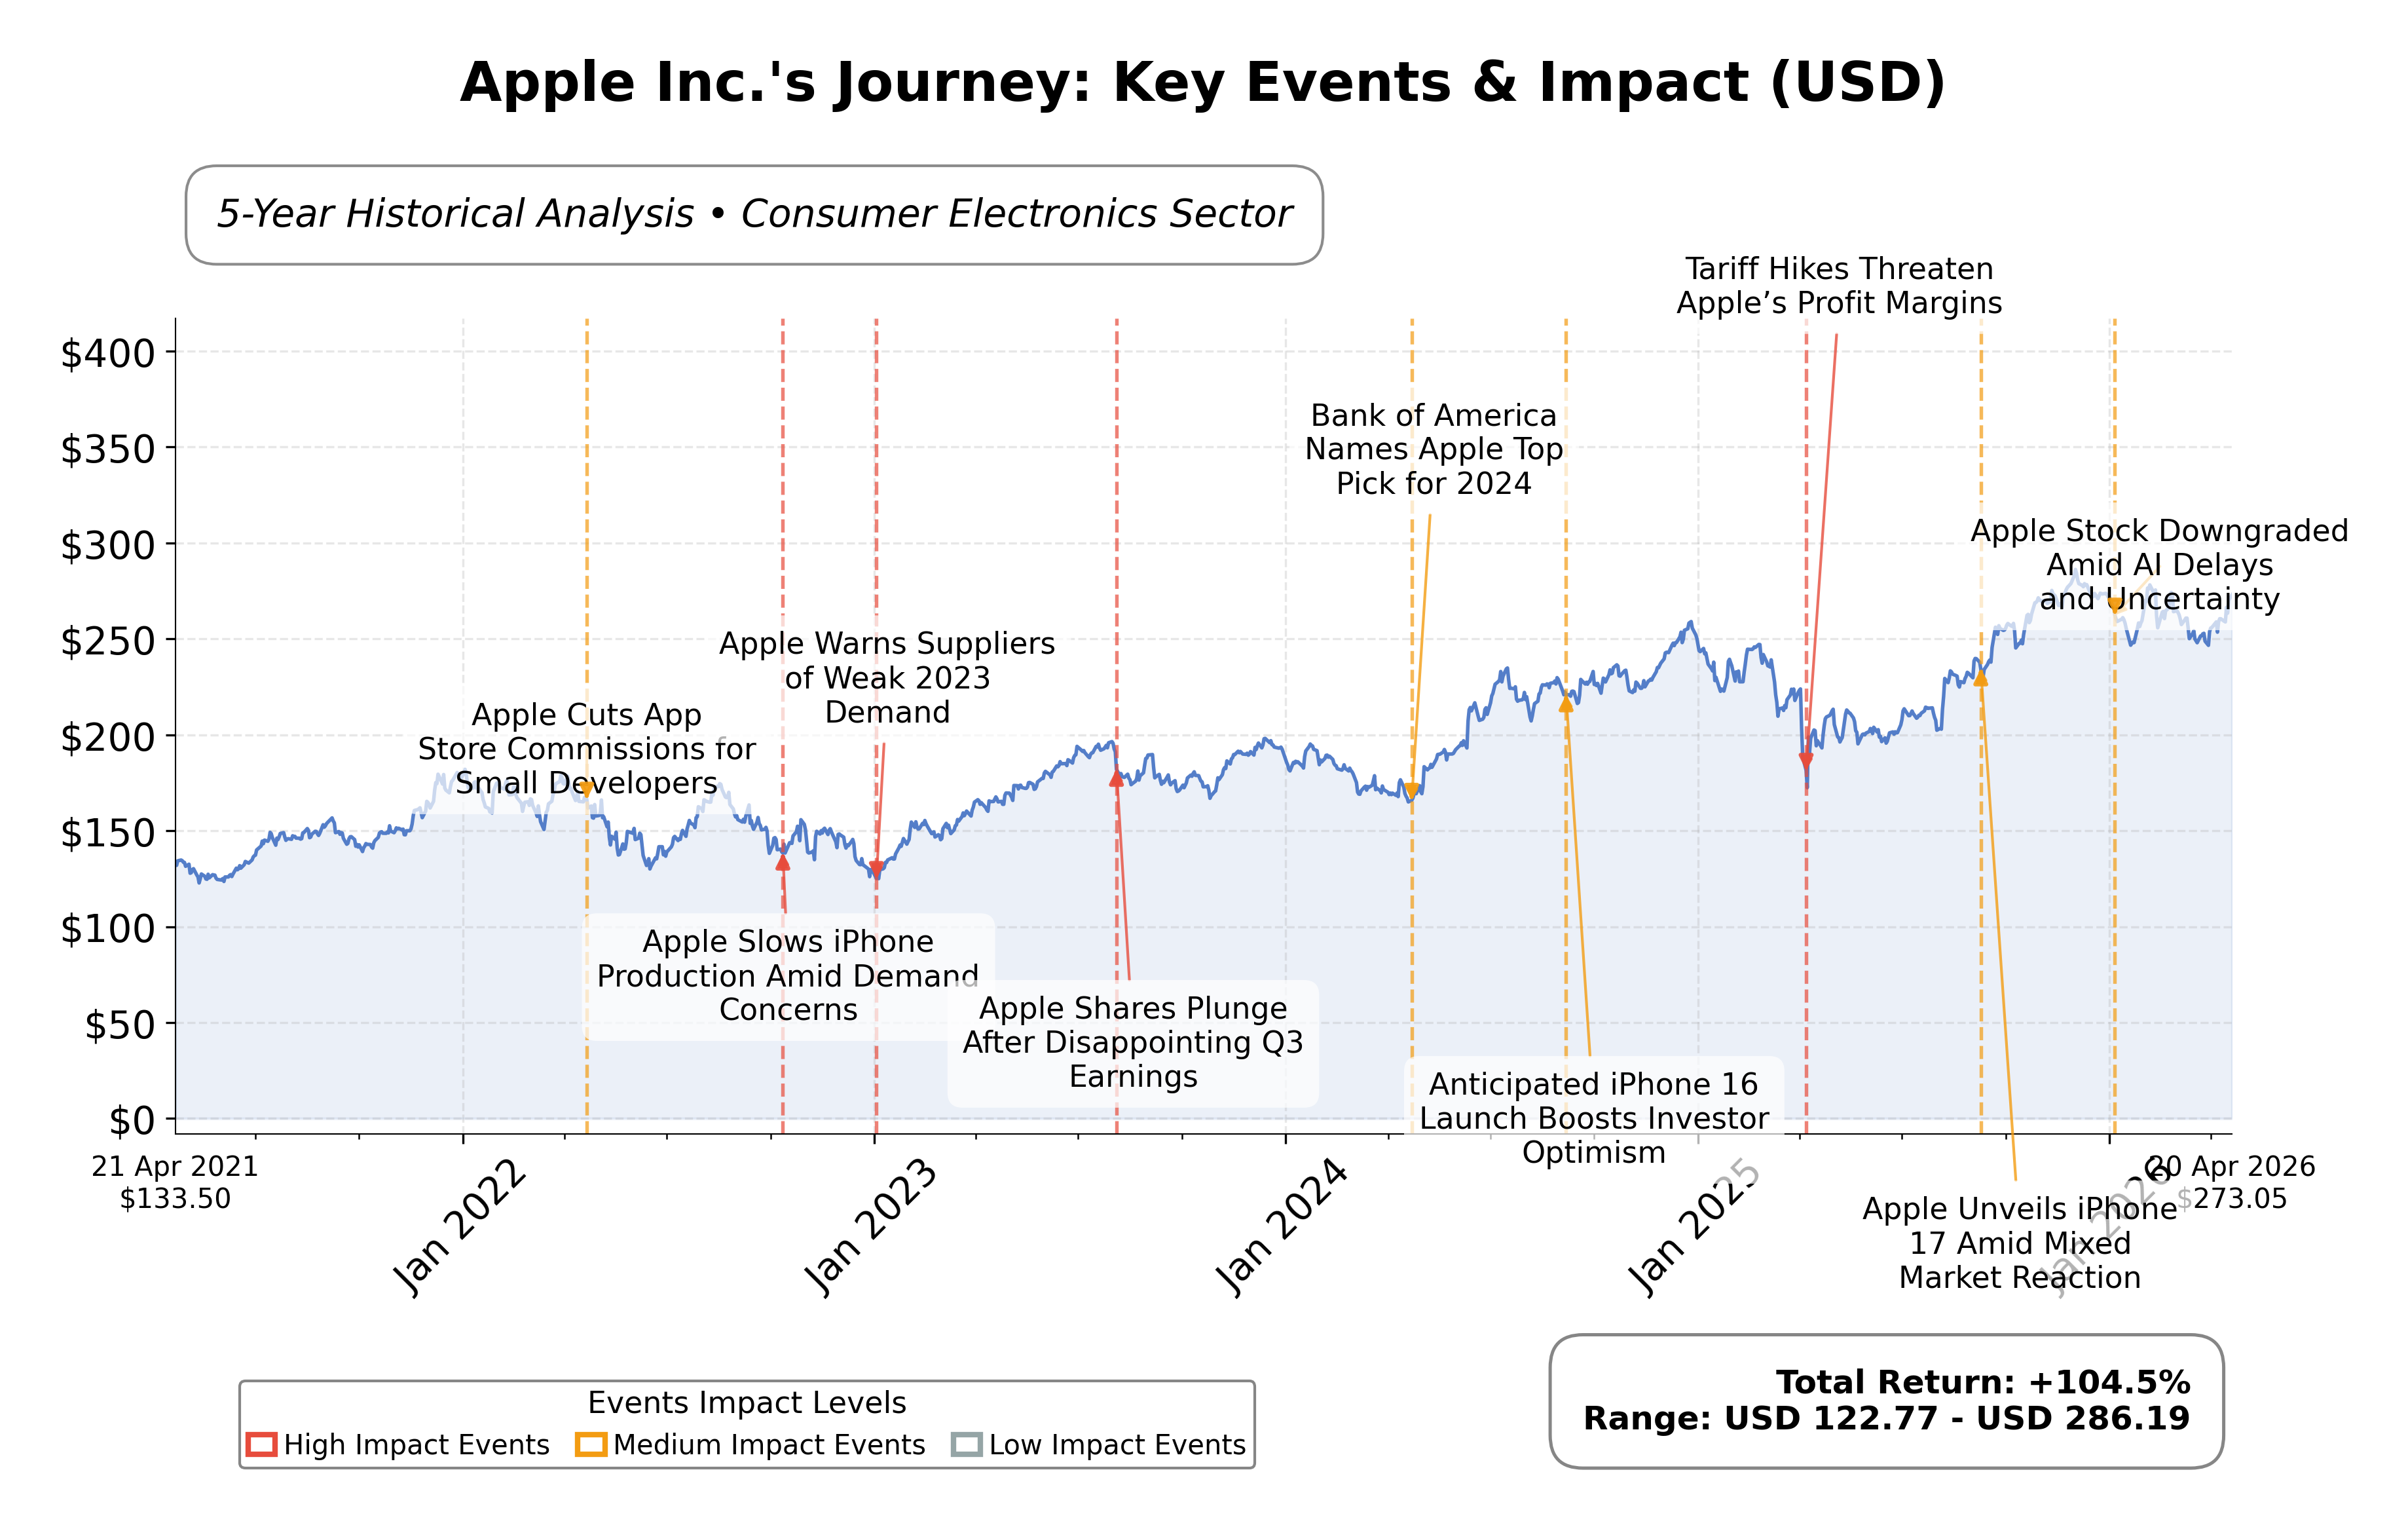
Stock Journey
Key Positives and Key Risks
Pros
- Strong free cash flow generation of $106.3 billion TTM supports financial flexibility and shareholder returns.
- Robust revenue growth of 15.7% quarterly indicates solid demand and market expansion.
- Well-managed leadership transition with experienced executive John Ternus appointed CEO ensures strategic continuity.
Cons
- High valuation multiples with a P/E ratio of 34.25 and P/B ratio of 45.05 may limit near-term price appreciation.
- Debt-to-equity ratio of 102.63% reflects relatively high leverage compared to cash reserves.
- Current ratio of 0.974 suggests tight short-term liquidity, potentially impacting operational flexibility.
Disclosure: This information is for general awareness and does not constitute investment advice
Report Summary
Apple Inc. is a leading technology company listed on the NASDAQ exchange, operating within the consumer electronics sector. The company designs, manufactures, and markets a broad range of innovative hardware products including the iPhone, Mac computers, iPad tablets, Apple Watch, and accessories such as AirPods. Additionally, Apple offers various digital services like the App Store, Apple Music, iCloud, and Apple TV+, which complement its hardware ecosystem. With a global presence and a workforce of approximately 166,000 employees, Apple holds a dominant position in the technology industry, emphasizing seamless integration across its product and service offerings.
Financially, Apple reported trailing twelve months (TTM) revenue of approximately $435.6 billion, with a gross margin of 48.16%, operating margin of 35.37%, and net profit margin of 27.04%. The company’s return on equity (ROE) stands at 1.52%, while return on assets (ROA) is 24.38%, indicating efficient use of assets to generate profits. Return on invested capital (ROIC) metrics, while not explicitly stated, can be inferred as strong given the operating margins and cash flow generation. These metrics collectively demonstrate Apple’s robust profitability and operational efficiency.
Valuation metrics show Apple’s market capitalization at roughly $3.97 trillion, with a trailing price-to-earnings (P/E) ratio of 34.25 and a forward P/E of 28.92, suggesting the market prices the stock at a premium relative to earnings. The price-to-book (P/B) ratio is notably high at 45.05, reflecting significant intangible assets and market expectations. The enterprise value to EBITDA (EV/EBITDA) ratio is 26.10, indicating a relatively high valuation compared to earnings before interest, taxes, depreciation, and amortization. The stock’s 52-week trading range spans from $189.81 to $288.62, with the current price near $272.93, positioning it closer to the upper end of its recent trading range.
Apple’s key strengths include substantial cash flow generation, with operating cash flow of approximately $135.5 billion TTM and free cash flow of $106.3 billion, alongside a manageable debt level of about $90.5 billion. The company maintains market leadership through its diversified product portfolio and integrated services ecosystem. Risks include competitive pressures in consumer electronics, regulatory scrutiny globally, and potential macroeconomic headwinds. Recent strategic developments feature a significant leadership transition with CEO Tim Cook stepping down and John Ternus appointed as successor, reflecting planned succession and continuity.
Technically, the stock shows a generally positive trend, trading above its 50-day and 200-day moving averages, with momentum indicators suggesting moderate strength. The leadership change and upcoming earnings announcements are notable catalysts. Overall, the data suggests a market environment where stakeholders may consider accumulation or monitoring for further developments, reflecting balanced conditions without explicit directional bias.
Company and Industry Overview
Company Basics
Price Performance
Company Size
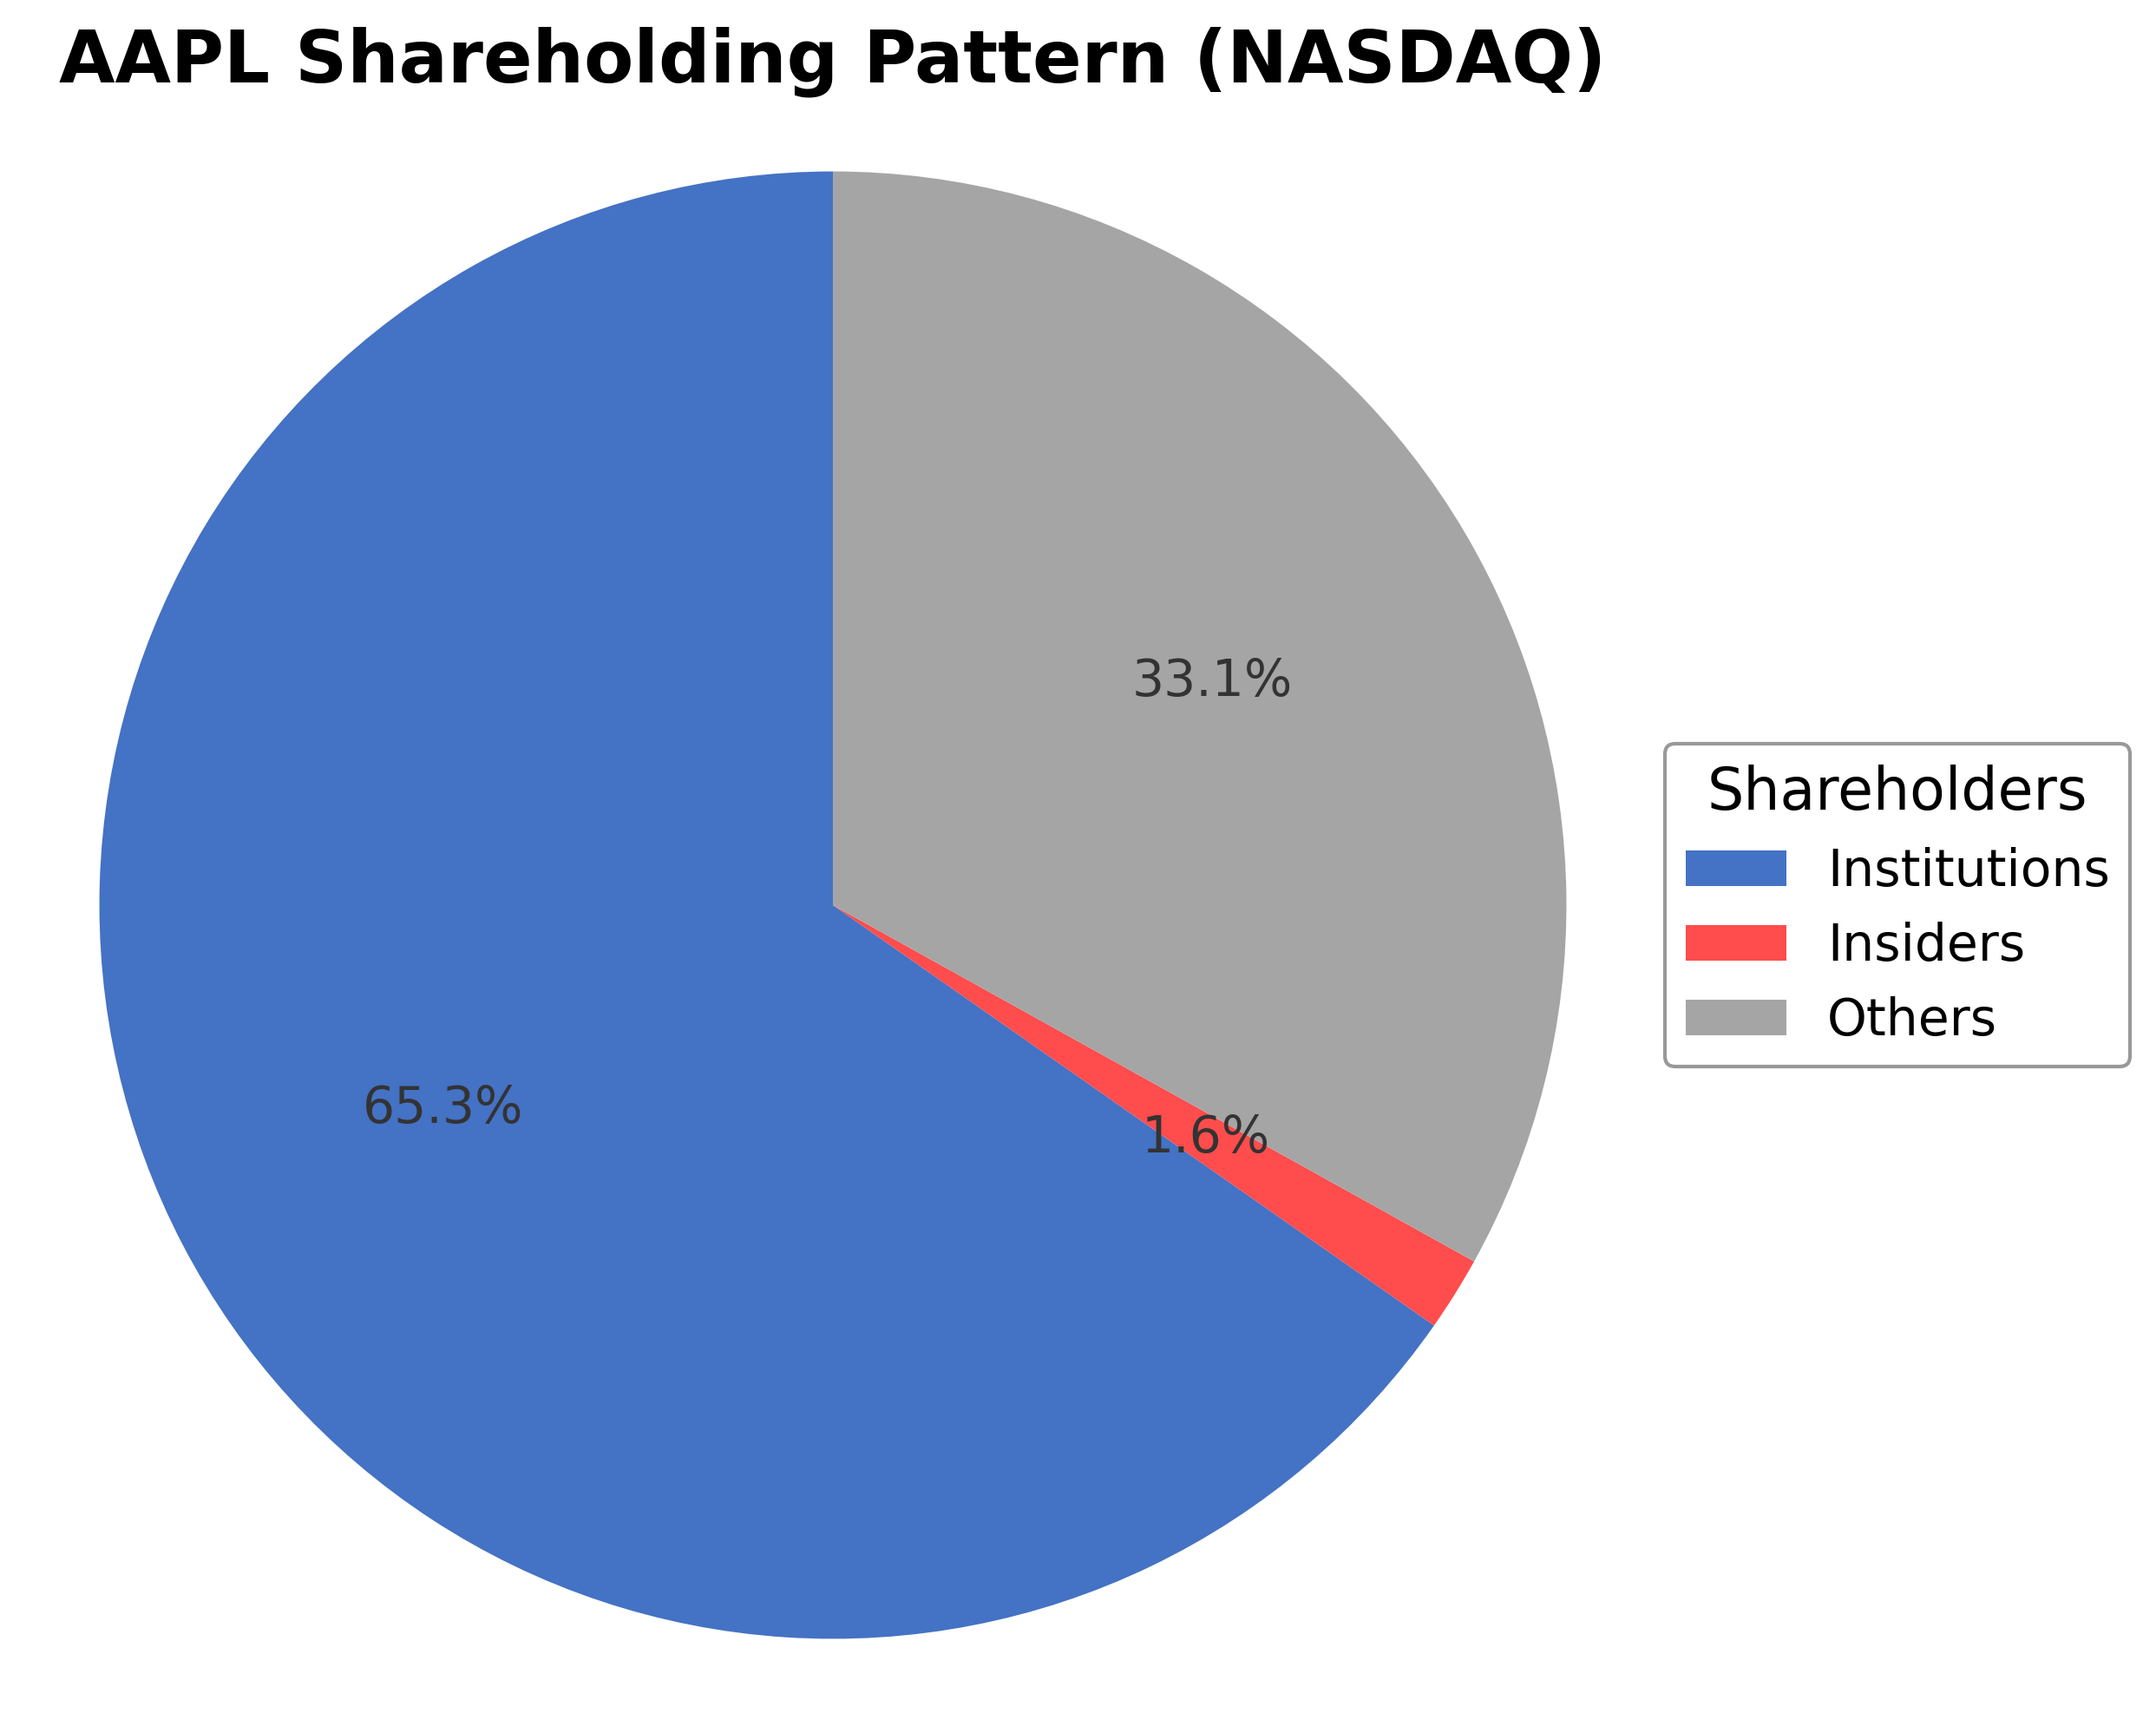
Shareholding Pattern
Sector and Industry Analysis
The computer hardware sector is a substantial and growing market, valued at approximately $674 billion in 2023 and expected to reach over $910 billion by 2028, driven by expanding personal computing needs, data center growth, and digital transformation initiatives. Leading companies include Apple, NVIDIA, and other major technology firms that supply processors, personal computers, and related hardware. Growth is fueled by increasing demand for remote work infrastructure, smart city projects, and sustainable technology solutions.
Key industry trends include the integration of artificial intelligence and machine learning into hardware design, enabling advanced applications such as autonomous vehicles and robotics. The rise of the Internet of Things (IoT) is expanding connectivity across devices, emphasizing security and interoperability. Additionally, emerging technologies like quantum computing present new opportunities, demanding innovation in chip design and materials, while competitive dynamics favor companies investing heavily in proprietary processors and AI capabilities.
Regulatory frameworks impacting the computer hardware industry focus on data privacy, cybersecurity standards, and environmental compliance, particularly regarding electronic waste and energy efficiency. Governments worldwide are implementing stricter rules to ensure hardware security and promote sustainable manufacturing practices. These regulations shape product development and supply chain management, influencing how companies innovate and compete in the global market.
Note: Analysis synthesized from industry research, market reports, and regulatory filings. Information is subject to change based on market conditions.
Financial Ratios Dashboard
Illustrative Scenario Analysis
DCF Assumptions:
Method: Two-Stage EPS-Priority Model
Financials
Peer Analysis
| Company Name | Market Cap | P/E Ratio | P/B Ratio | EV/EBITDA | Price to CFO |
|---|---|---|---|---|---|
| Apple Inc. | $3.97T | 34.25 | 45.05 | 26.10 | 29.32 |
| Sony Group Corporation - Sponsored American Depositary Receipt | $128.20B | 16.69 | 2.53 | 0.03 | 9.90 |
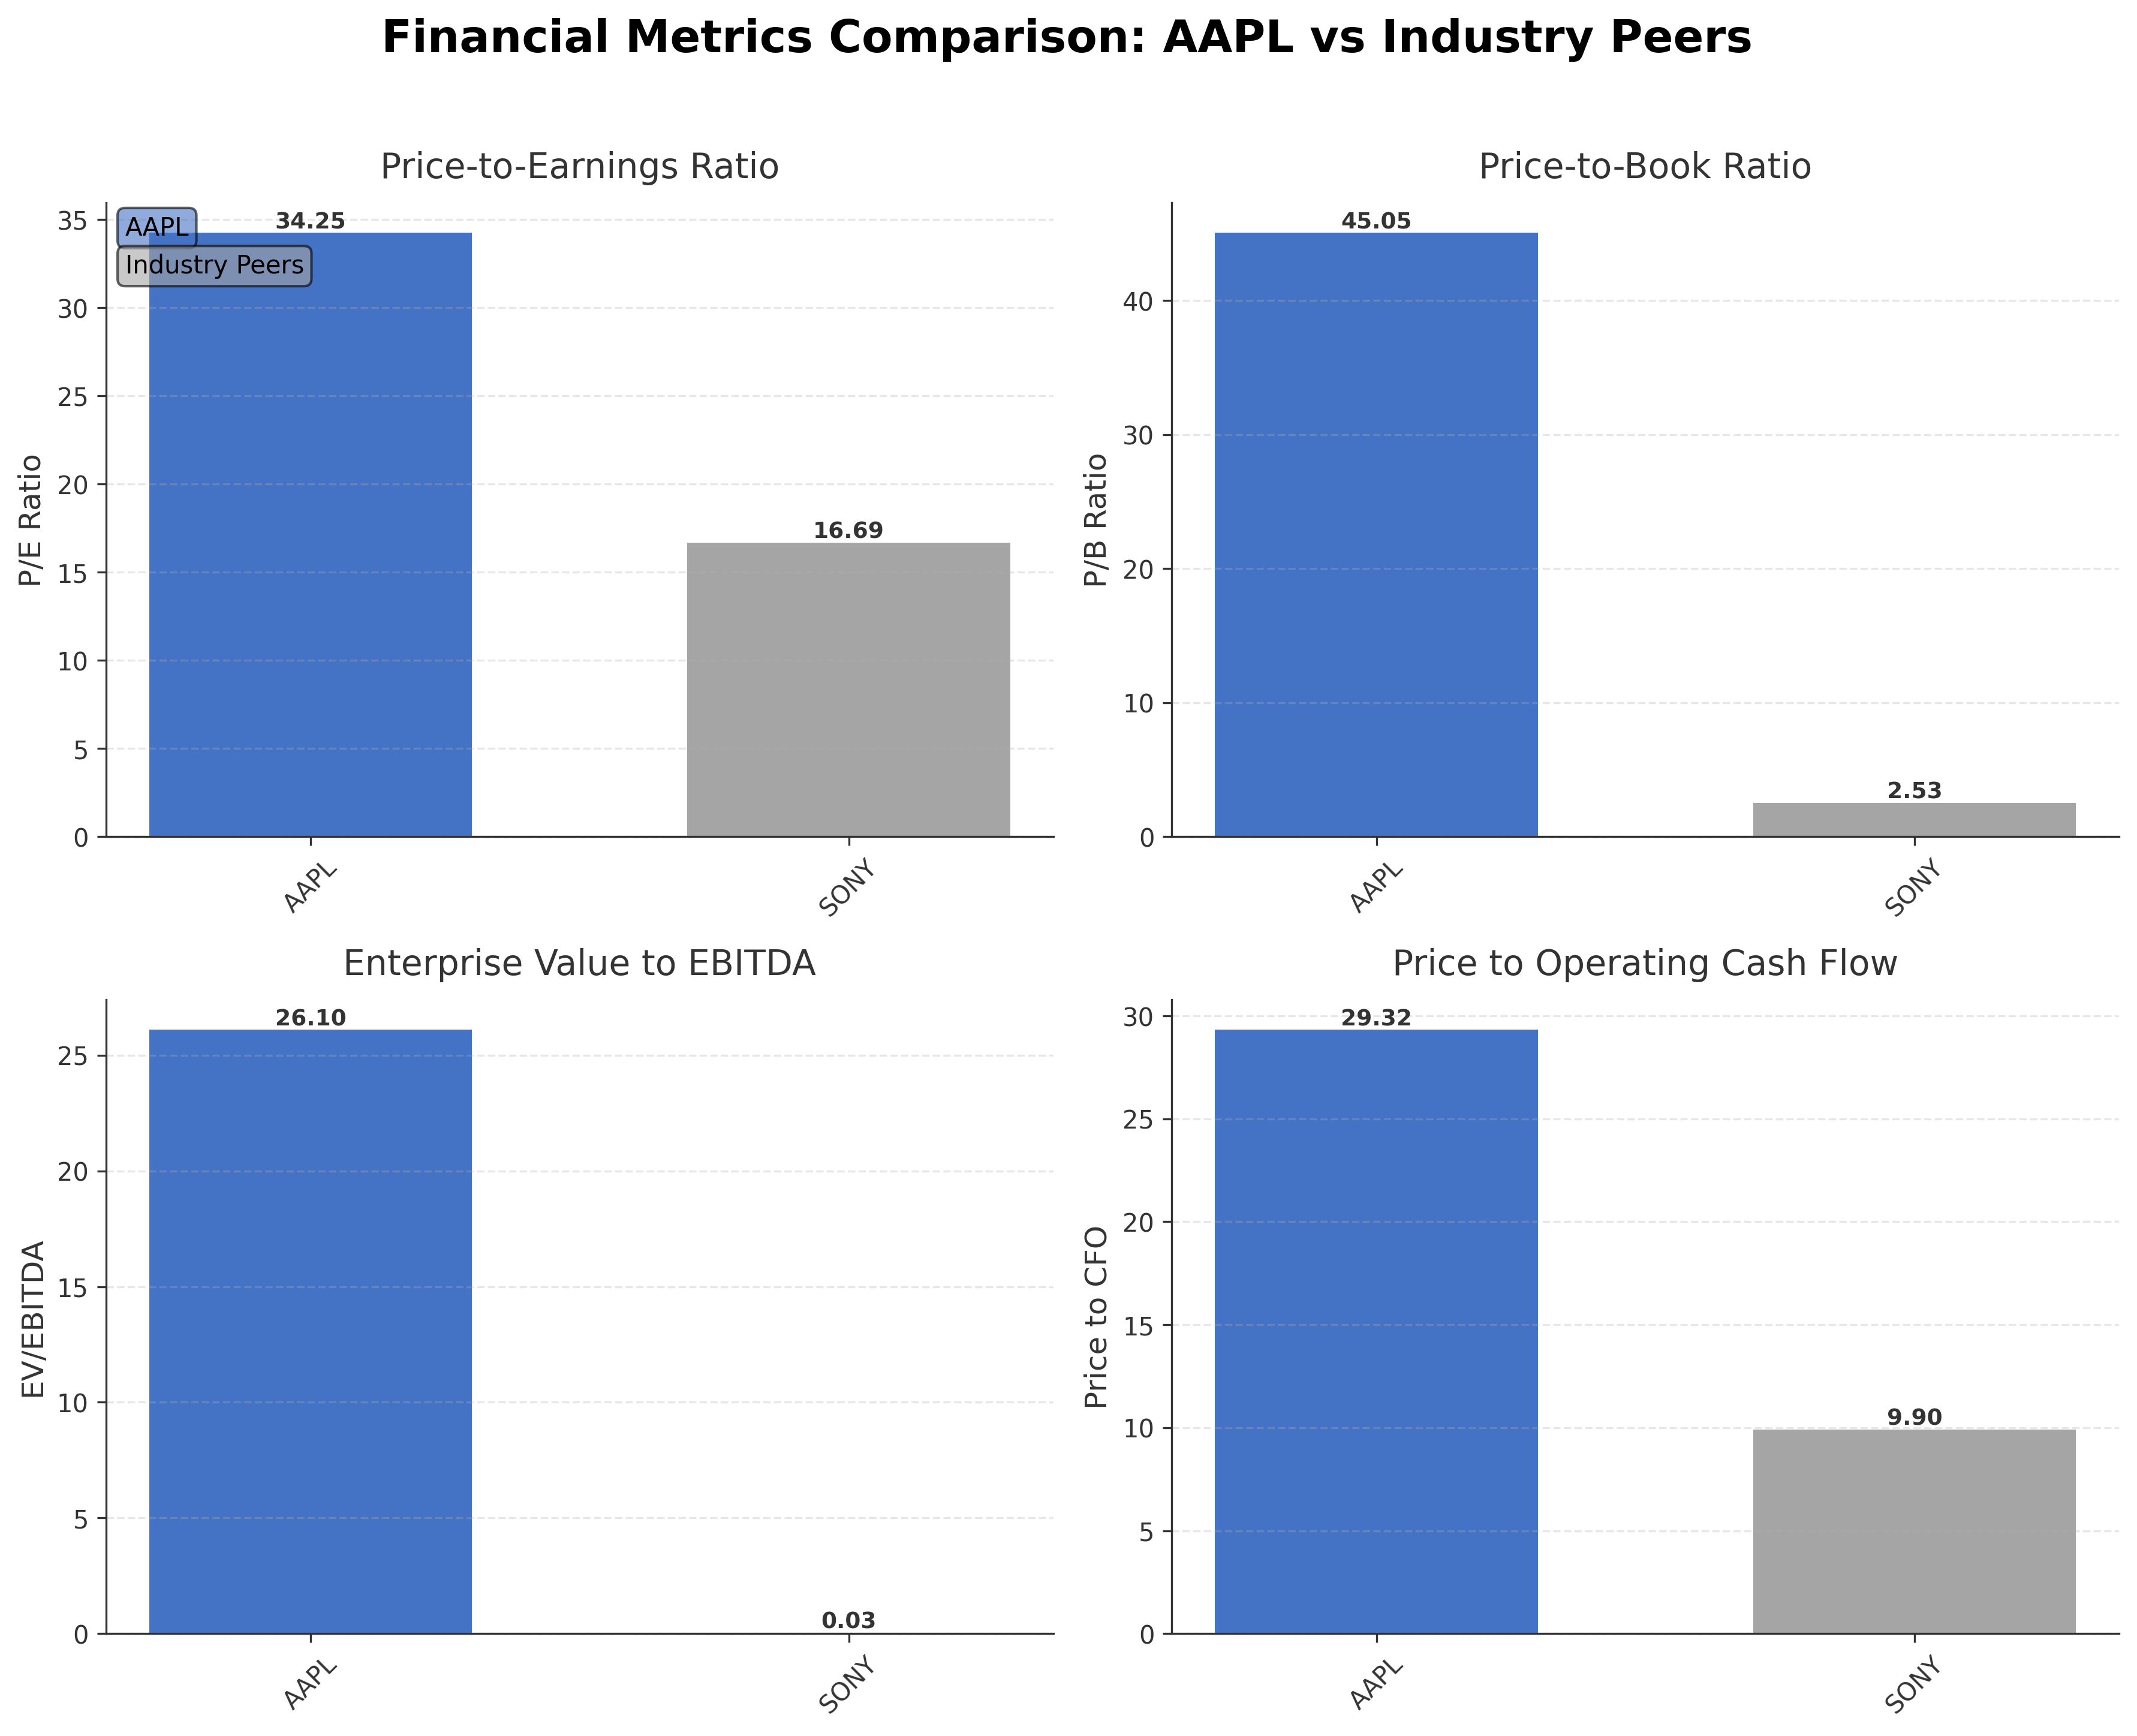
Comparison Analysis: Apple Inc. significantly outpaces its peer Sony Group Corporation in market capitalization, with a valuation of approximately $3.97 trillion versus Sony's $128.20 billion. Apple's P/E ratio of 34.25 is notably higher than Sony's 16.69, reflecting premium market expectations for growth and profitability. The P/B ratio for Apple is substantially elevated at 45.05 compared to Sony's 2.53, indicating a market premium on Apple's intangible assets and brand value. Apple's EV/EBITDA ratio of 26.10 also exceeds Sony's minimal 0.03, suggesting a higher valuation relative to earnings. Return on equity for Apple at 1.52% surpasses Sony's 0.15%, highlighting stronger profitability. Overall, Apple demonstrates superior scale and financial metrics, though at a higher valuation multiple relative to its regional industry peer.
Financial Metrics Comparison with Peers
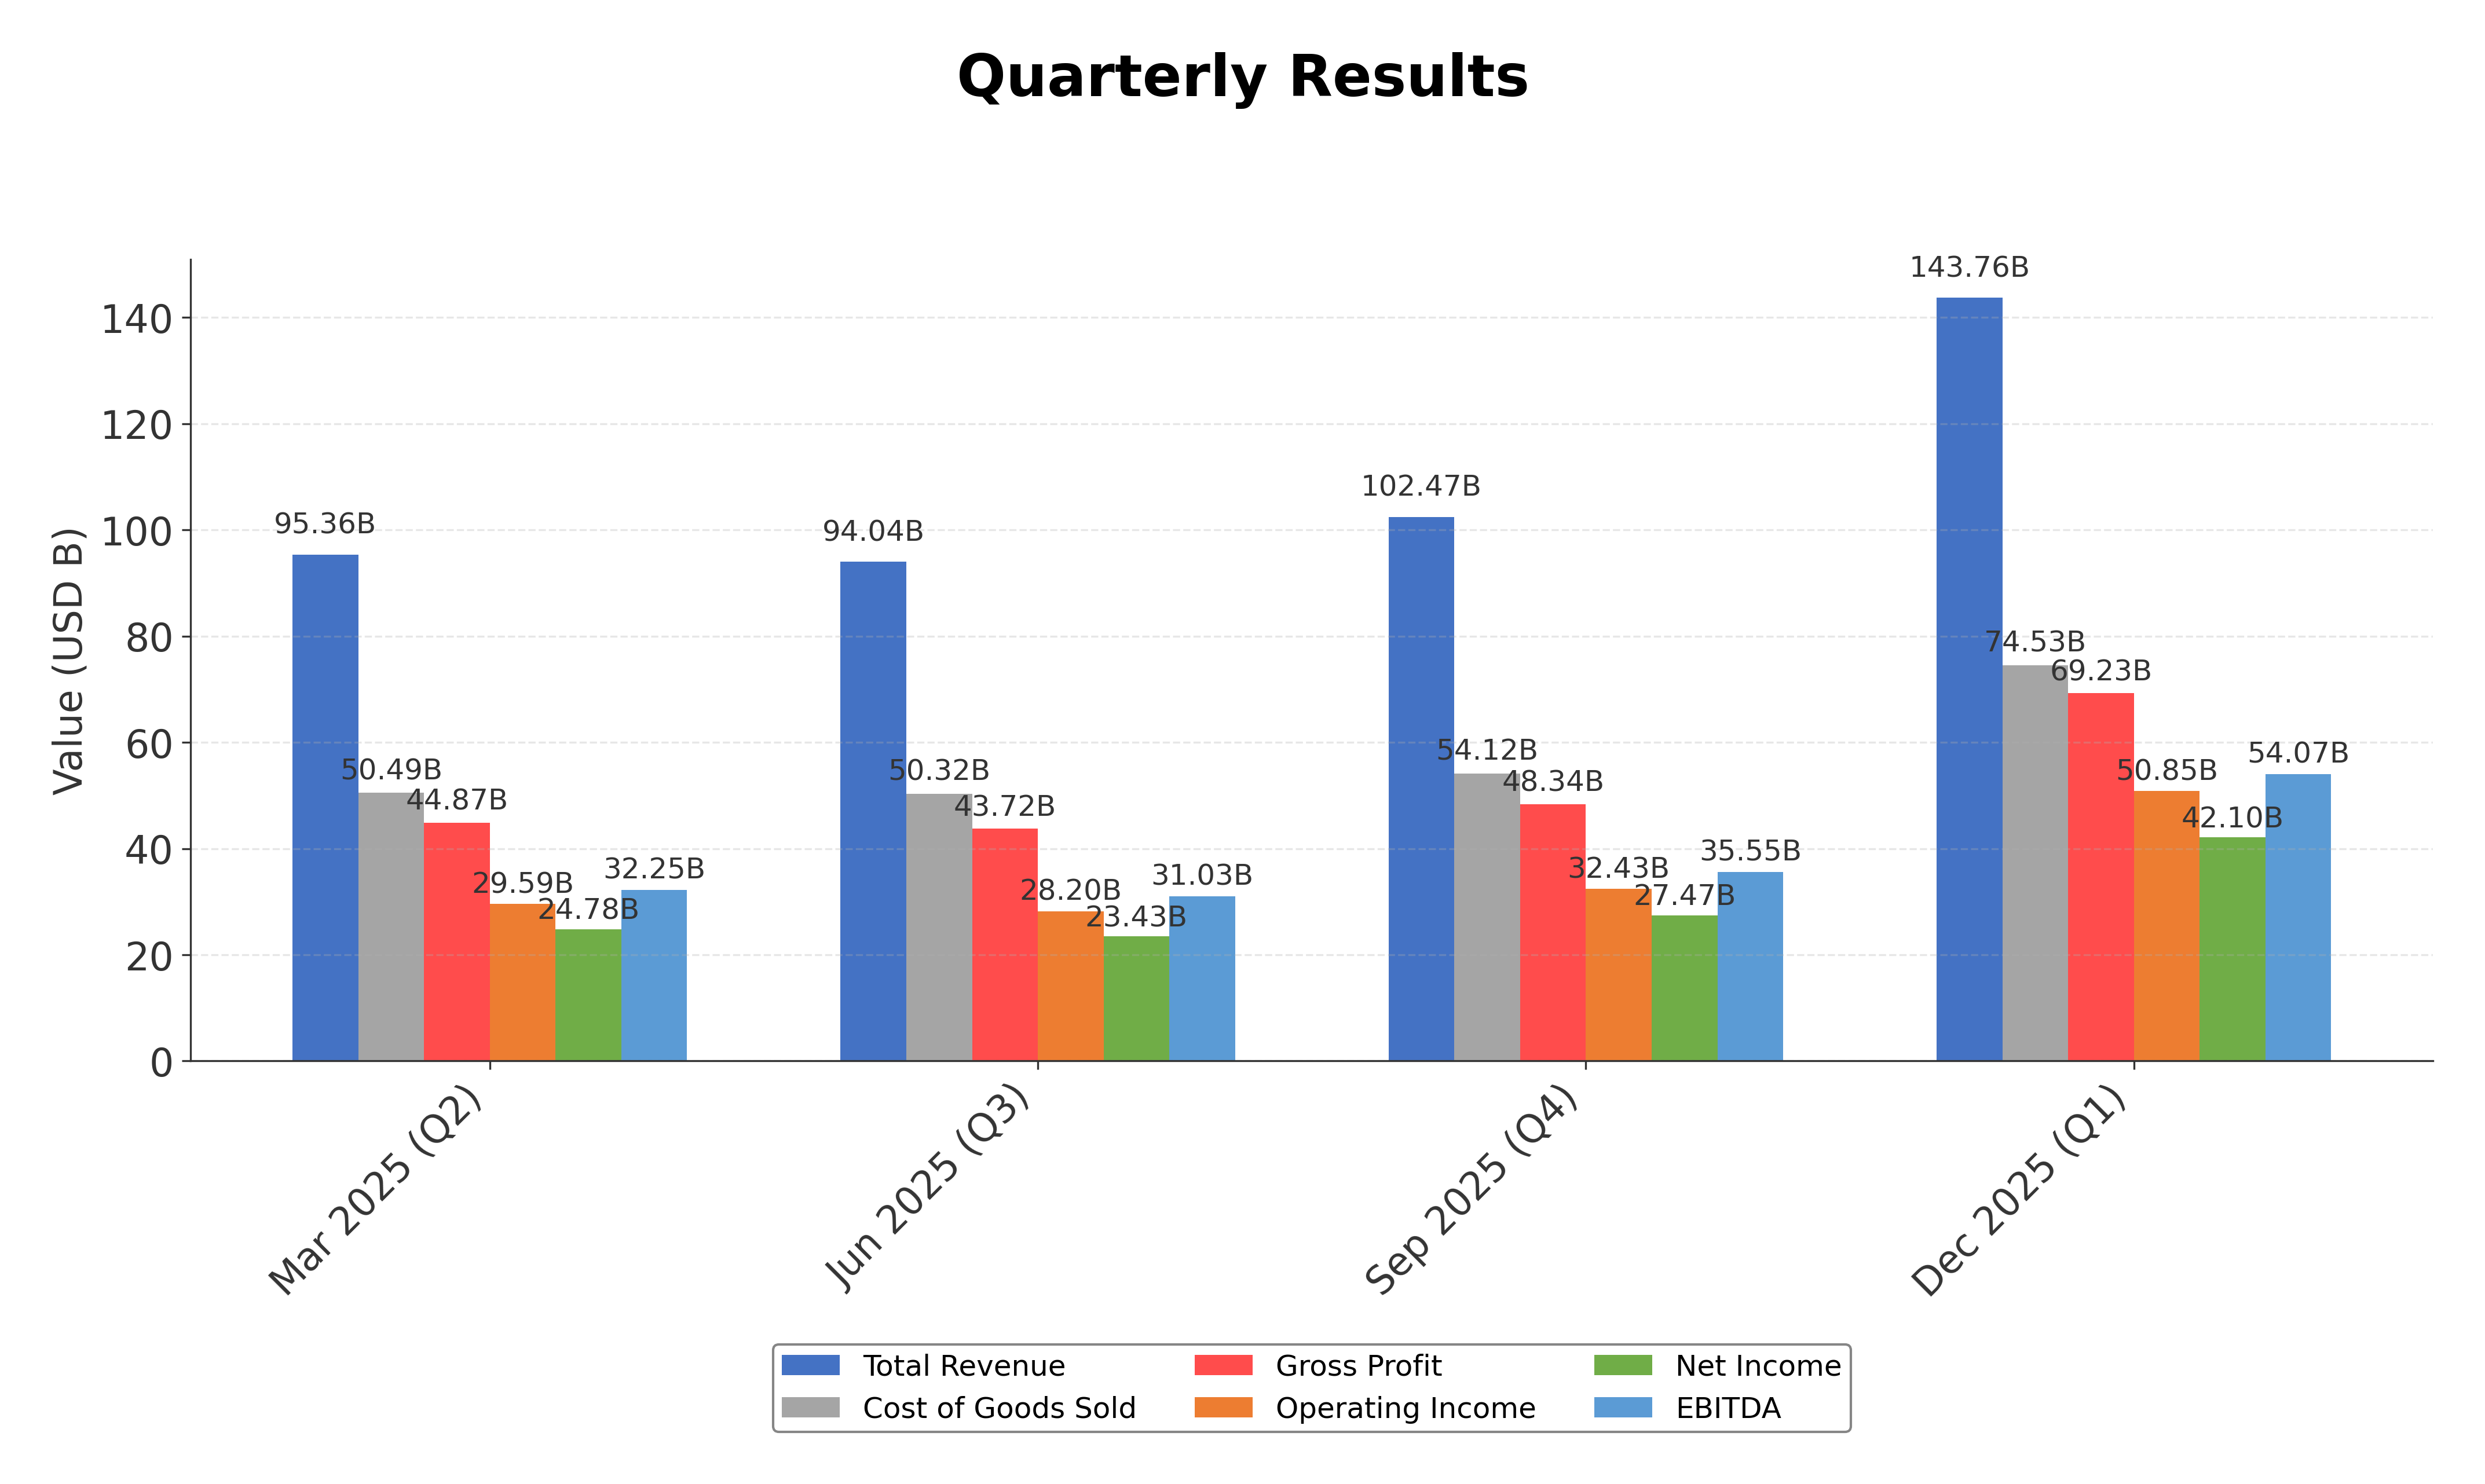
Financial Statements
Comprehensive financial data including income, balance sheet, and cash flow metrics
Income Statement
| fiscal_date | 2025-09-30 | 2024-09-30 | 2023-09-30 | 2022-09-30 | 2021-09-30 |
|---|---|---|---|---|---|
| Sales | 416.16B | 391.04B | 383.29B | 394.33B | 365.82B |
| Cost Of Goods | 220.96B | 210.35B | 214.14B | 223.55B | 212.98B |
| Gross Profit | 195.20B | 180.68B | 169.15B | 170.78B | 152.84B |
| Operating Expense Research And Development | 34.55B | 31.37B | 29.91B | 26.25B | 21.91B |
| Operating Expense Selling General And Administrative | 27.60B | 26.10B | 24.93B | 25.09B | 21.97B |
| Operating Income | 133.05B | 123.22B | 114.30B | 119.44B | 108.95B |
| Other Income Expense | -321.00M | 269.00M | -565.00M | -334.00M | 60.00M |
| Pretax Income | 132.73B | 123.48B | 113.74B | 119.10B | 109.21B |
| Income Tax | 20.72B | 29.75B | 16.74B | 19.30B | 14.53B |
| Net Income | 112.01B | 93.74B | 97.00B | 99.80B | 94.68B |
| Eps Basic | 7.49 | 6.11 | 6.16 | 6.15 | 5.67 |
| Eps Diluted | 7.46 | 6.08 | 6.13 | 6.11 | 5.61 |
| Basic Shares Outstanding | 14.95B | 15.34B | 15.74B | 16.22B | 16.70B |
| Diluted Shares Outstanding | 14.95B | 15.34B | 15.74B | 16.22B | 16.70B |
| Ebit | 133.05B | 123.22B | 114.30B | 119.44B | 111.85B |
| Ebitda | 144.75B | 134.66B | 125.82B | 130.54B | 123.14B |
| Net Income Continuous Operations | 112.01B | 93.74B | 97.00B | 99.80B | 94.68B |
| Non Operating Interest Income | N/A | N/A | 3.75B | 2.83B | 2.84B |
| Non Operating Interest Expense | N/A | N/A | 3.93B | 2.93B | 2.65B |
Data provided by Twelve Data
Balance Sheet
| fiscal_date | 2025-09-30 | 2024-09-30 | 2023-09-30 | 2022-09-30 | 2021-09-30 |
|---|---|---|---|---|---|
| Cash And Cash Equivalents | 35.93B | 29.94B | 29.96B | 23.65B | 34.94B |
| Accounts Receivable | 39.78B | 33.41B | 29.51B | 28.18B | 26.28B |
| Total Assets | 359.24B | 364.98B | 352.58B | 352.75B | 351.00B |
| Total Liabilities | 285.51B | 308.03B | 290.44B | 302.08B | 287.91B |
| Long Term Debt | 78.33B | 85.75B | 95.28B | 109.71B | 119.38B |
| Shareholders Equity | 73.73B | 56.95B | 62.15B | 50.67B | 63.09B |
Data provided by Twelve Data
Cash Flow Statement
| fiscal_date | 2025-09-30 | 2024-09-30 | 2023-09-30 | 2022-09-30 | 2021-09-30 |
|---|---|---|---|---|---|
| Operating Activities Net Income | 112.01B | 93.74B | 97.00B | 99.80B | 94.68B |
| Operating Activities Depreciation | 11.70B | 11.45B | 11.52B | 11.10B | 11.28B |
| Operating Activities Stock Based Compensation | 12.86B | 11.69B | 10.83B | 9.04B | 7.91B |
| Operating Activities Other Non Cash Items | -89.00M | -2.27B | -2.23B | 1.01B | -4.92B |
| Operating Activities Accounts Receivable | -7.03B | -5.14B | -417.00M | -9.34B | -14.03B |
| Operating Activities Accounts Payable | 902.00M | 6.02B | -1.89B | 9.45B | 12.33B |
| Operating Activities Other Assets Liabilities | -18.87B | 2.77B | -4.27B | 1.57B | -1.53B |
| Operating Activities Operating Cash Flow | 111.48B | 118.25B | 110.54B | 123.52B | 100.94B |
| Investing Activities Capital Expenditures | -12.71B | -9.45B | -10.96B | -10.71B | -11.09B |
| Investing Activities Purchase Of Investments | -24.41B | -48.66B | -29.51B | -76.92B | -109.56B |
| Investing Activities Sale Of Investments | 53.80B | 62.35B | 45.51B | 67.36B | 106.48B |
| Investing Activities Other Investing Activity | -1.48B | -1.31B | -1.34B | -2.09B | -385.00M |
| Investing Activities Investing Cash Flow | 15.20B | 2.94B | 3.71B | -22.66B | -14.58B |
| Financing Activities Long Term Debt Issuance | 4.48B | 0.00 | 5.23B | 5.46B | 20.39B |
| Financing Activities Long Term Debt Payments | -10.93B | -9.96B | -11.15B | -9.54B | -8.75B |
| Financing Activities Short Term Debt Issuance | -2.03B | 3.96B | -3.98B | 3.96B | 1.02B |
| Financing Activities Common Stock Repurchase | -90.71B | -94.95B | -77.55B | -89.40B | -85.97B |
| Financing Activities Common Dividends | -15.42B | -15.23B | -15.03B | -14.84B | -14.47B |
| Financing Activities Other Financing Charges | -6.07B | -5.80B | -6.01B | -6.38B | -5.58B |
| Financing Activities Financing Cash Flow | -120.69B | -121.98B | -108.49B | -110.75B | -92.25B |
| End Cash Position | 35.93B | 29.94B | 30.74B | 24.98B | 35.93B |
| Income Tax Paid | 43.37B | 26.10B | 18.68B | 19.57B | 25.39B |
| Free Cash Flow | 98.77B | 108.81B | 99.58B | 111.44B | 92.95B |
| Interest Paid | N/A | N/A | 3.80B | 2.87B | 2.69B |
| Operating Activities Deferred Taxes | N/A | N/A | N/A | 895.00M | -4.77B |
| Investing Activities Net Acquisitions | N/A | N/A | N/A | -306.00M | -33.00M |
| Financing Activities Common Stock Issuance | N/A | N/A | N/A | N/A | 1.10B |
Data provided by Twelve Data
Technical Analysis
Key Insights
- The current trend for Apple’s stock price is upward, trading near the 52-week high with positive price momentum observed.
- Key support levels are identified around $260.69 (50-day moving average) and $251.83 (200-day moving average), with resistance near the recent high of $288.62.
- The stock price is above its 10-day, 50-day, and 200-day moving averages, indicating a bullish medium- to long-term trend.
- Momentum indicators show the Relative Strength Index (RSI) in a moderate range, MACD suggests positive momentum, and Stochastic oscillators are not in overbought territory.
- Multi-timeframe analysis across daily, weekly, and monthly charts confirms a consistent upward trend with no immediate reversal signals.
- Potential market scenarios include continuation of the bullish trend if support levels hold, or consolidation near resistance if profit-taking intensifies.
Trending News
1. Headline: Apple, Amazon, Avis, Blackberry, And Trade Desk: Why These 5 Stocks Are On Investors' Radars Today - Appl - Benzinga
Summary: AAPL, AMZN, CAR, BB, TTD were among the stocks seen trending among investors on Monday, April 20, 2026.
Sentiment: neutral
2. Headline: Tim Cook is stepping down as Apple's CEO. Investors are $4 trillion richer because of him.
Summary: Tim Cook turned Apple into a $4 trillion behemoth during its 15 years as CEO.
Sentiment: positive
3. Headline: Who is John Ternus, the incoming CEO of Apple? | CNN Business
Summary: Apple veteran John Ternus will take over the $4 trillion company as CEO come September 1.
Sentiment: neutral
4. Headline: Stocks making the biggest moves after hours: Amazon, Apple, Steel Dynamics and more
Summary: See which stocks are posting big moves after the bell.
Sentiment: neutral
5. Headline: Stocks to watch on Monday after hours: AAPL, AMZN, STLD | Seeking Alpha
Summary: Apr 20, 2026, 5:01 PM ETApple Inc. (AAPL) Stock, STLD Stock, AMZN StockANTHROBy: Jason Capul, SA News Editor ... Follow us on Google for the latest stock newsFollow Seeking Alpha on Google for the latest stock news ... Wall Street finished lower on Monday as hopes for a potential U.S.-Iran peace deal dimmed, with rising tensions in the Middle East dampening investor sentiment. Here are the 3 stocks to watch on Monday after hours: Apple ...
Sentiment: negative
Powered by Brave
Recent Updates
News Summary
As of April 20, 2026. Apple announced a major leadership transition with Tim Cook stepping down as CEO after 15 years and moving to the role of executive chairman. John Ternus, a longtime Apple executive with 25 years of experience, will assume the CEO position effective September 1, 2026. The transition follows a carefully planned succession process approved unanimously by the board. Cook will continue to support the company during the transition and focus on global policy engagement. Analysts have noted the timing coincides with Apple's strategic push into artificial intelligence, with confidence expressed in Ternus's ability to lead the company forward. The leadership change is a significant corporate event with potential implications for Apple's strategic direction and market perception.
News Sentiment
The overall sentiment from recent updates is cautiously positive, driven primarily by the orderly and well-communicated leadership transition from Tim Cook to John Ternus. Positive tones stem from Cook’s legacy of growth and innovation and the confidence expressed by the board and analysts in Ternus’s capabilities. Neutral sentiments prevail in coverage focusing on the transition details and background on the new CEO. Negative sentiment is limited and relates mainly to market uncertainties and geopolitical factors impacting broader market conditions rather than company-specific issues. The balanced sentiment reflects a stable outlook as Apple prepares for its next phase of leadership.
Source List
Analytical Overview
Analysis Summary
Apple’s valuation metrics, including a trailing P/E of 34.25 and forward P/E of 28.92, are elevated relative to the consumer electronics industry average P/E of 34.25, indicating the market prices in premium growth expectations. The company’s revenue growth rate of 15.7% quarterly and strong operating cash flow of $135.5 billion TTM demonstrate a solid growth trajectory supported by robust cash generation. Financial health is sound, with total debt of approximately $90.5 billion balanced against cash reserves of $66.9 billion and a current ratio near 0.97, reflecting manageable leverage and liquidity. Sector-specific opportunities include expansion in AI and services, while challenges involve competitive pressures and potential regulatory scrutiny. Market positioning is strong with a diversified product ecosystem and significant brand loyalty.
Overall Business and Market Assessment
Supporting Factors: Apple’s substantial free cash flow generation of $106.3 billion TTM, strong revenue growth of 15.7%, and a well-executed leadership transition ensuring strategic continuity
Risk Factors: No data
SWOT Analysis
Strengths
- Strong brand recognition and loyal customer base worldwide.
- Robust cash flow generation supporting innovation and shareholder returns.
- Diversified product and services ecosystem enhancing revenue stability.
- Experienced management team with a clear succession plan.
Weaknesses
- High valuation multiples may limit near-term upside potential.
- Dependence on iPhone sales for a significant portion of revenue.
- Relatively high debt-to-equity ratio of 102.63%.
- Current ratio below 1 indicating tight short-term liquidity.
Opportunities
- Expansion into artificial intelligence and advanced chip technologies.
- Growth in subscription-based services and digital content.
- Increasing penetration in emerging markets.
- Potential new product categories and innovations.
Threats
- Intense competition in consumer electronics and technology sectors.
- Regulatory scrutiny and geopolitical risks affecting global operations.
- Supply chain disruptions impacting product availability.
- Macroeconomic uncertainties influencing consumer spending.
Company Description
Apple Inc. is a leading technology company renowned for designing, manufacturing, and marketing innovative hardware and software products for consumers and businesses worldwide. Its flagship product, the iPhone, accounts for the majority of sales, serving as the central hub of an expansive ecosystem that includes Mac computers, iPad tablets, Apple Watch wearables, and accessories like AirPods. Apple Inc. also offers a suite of services such as the App Store, Apple Music, iCloud, Apple TV+, and Apple Fitness+, providing digital content, cloud storage, and subscription-based platforms. Operating in the consumer electronics industry within the technology sector, the company employs approximately 166,000 people and maintains a broad global presence through online stores, retail outlets, and partnerships with carriers and resellers. With a substantial market capitalization reflecting its scale, Apple Inc. plays a pivotal role in shaping consumer technology trends, emphasizing seamless integration across devices and services to enhance user experience and productivity.