
AAPL (AAPL)
Stock Analysis Report
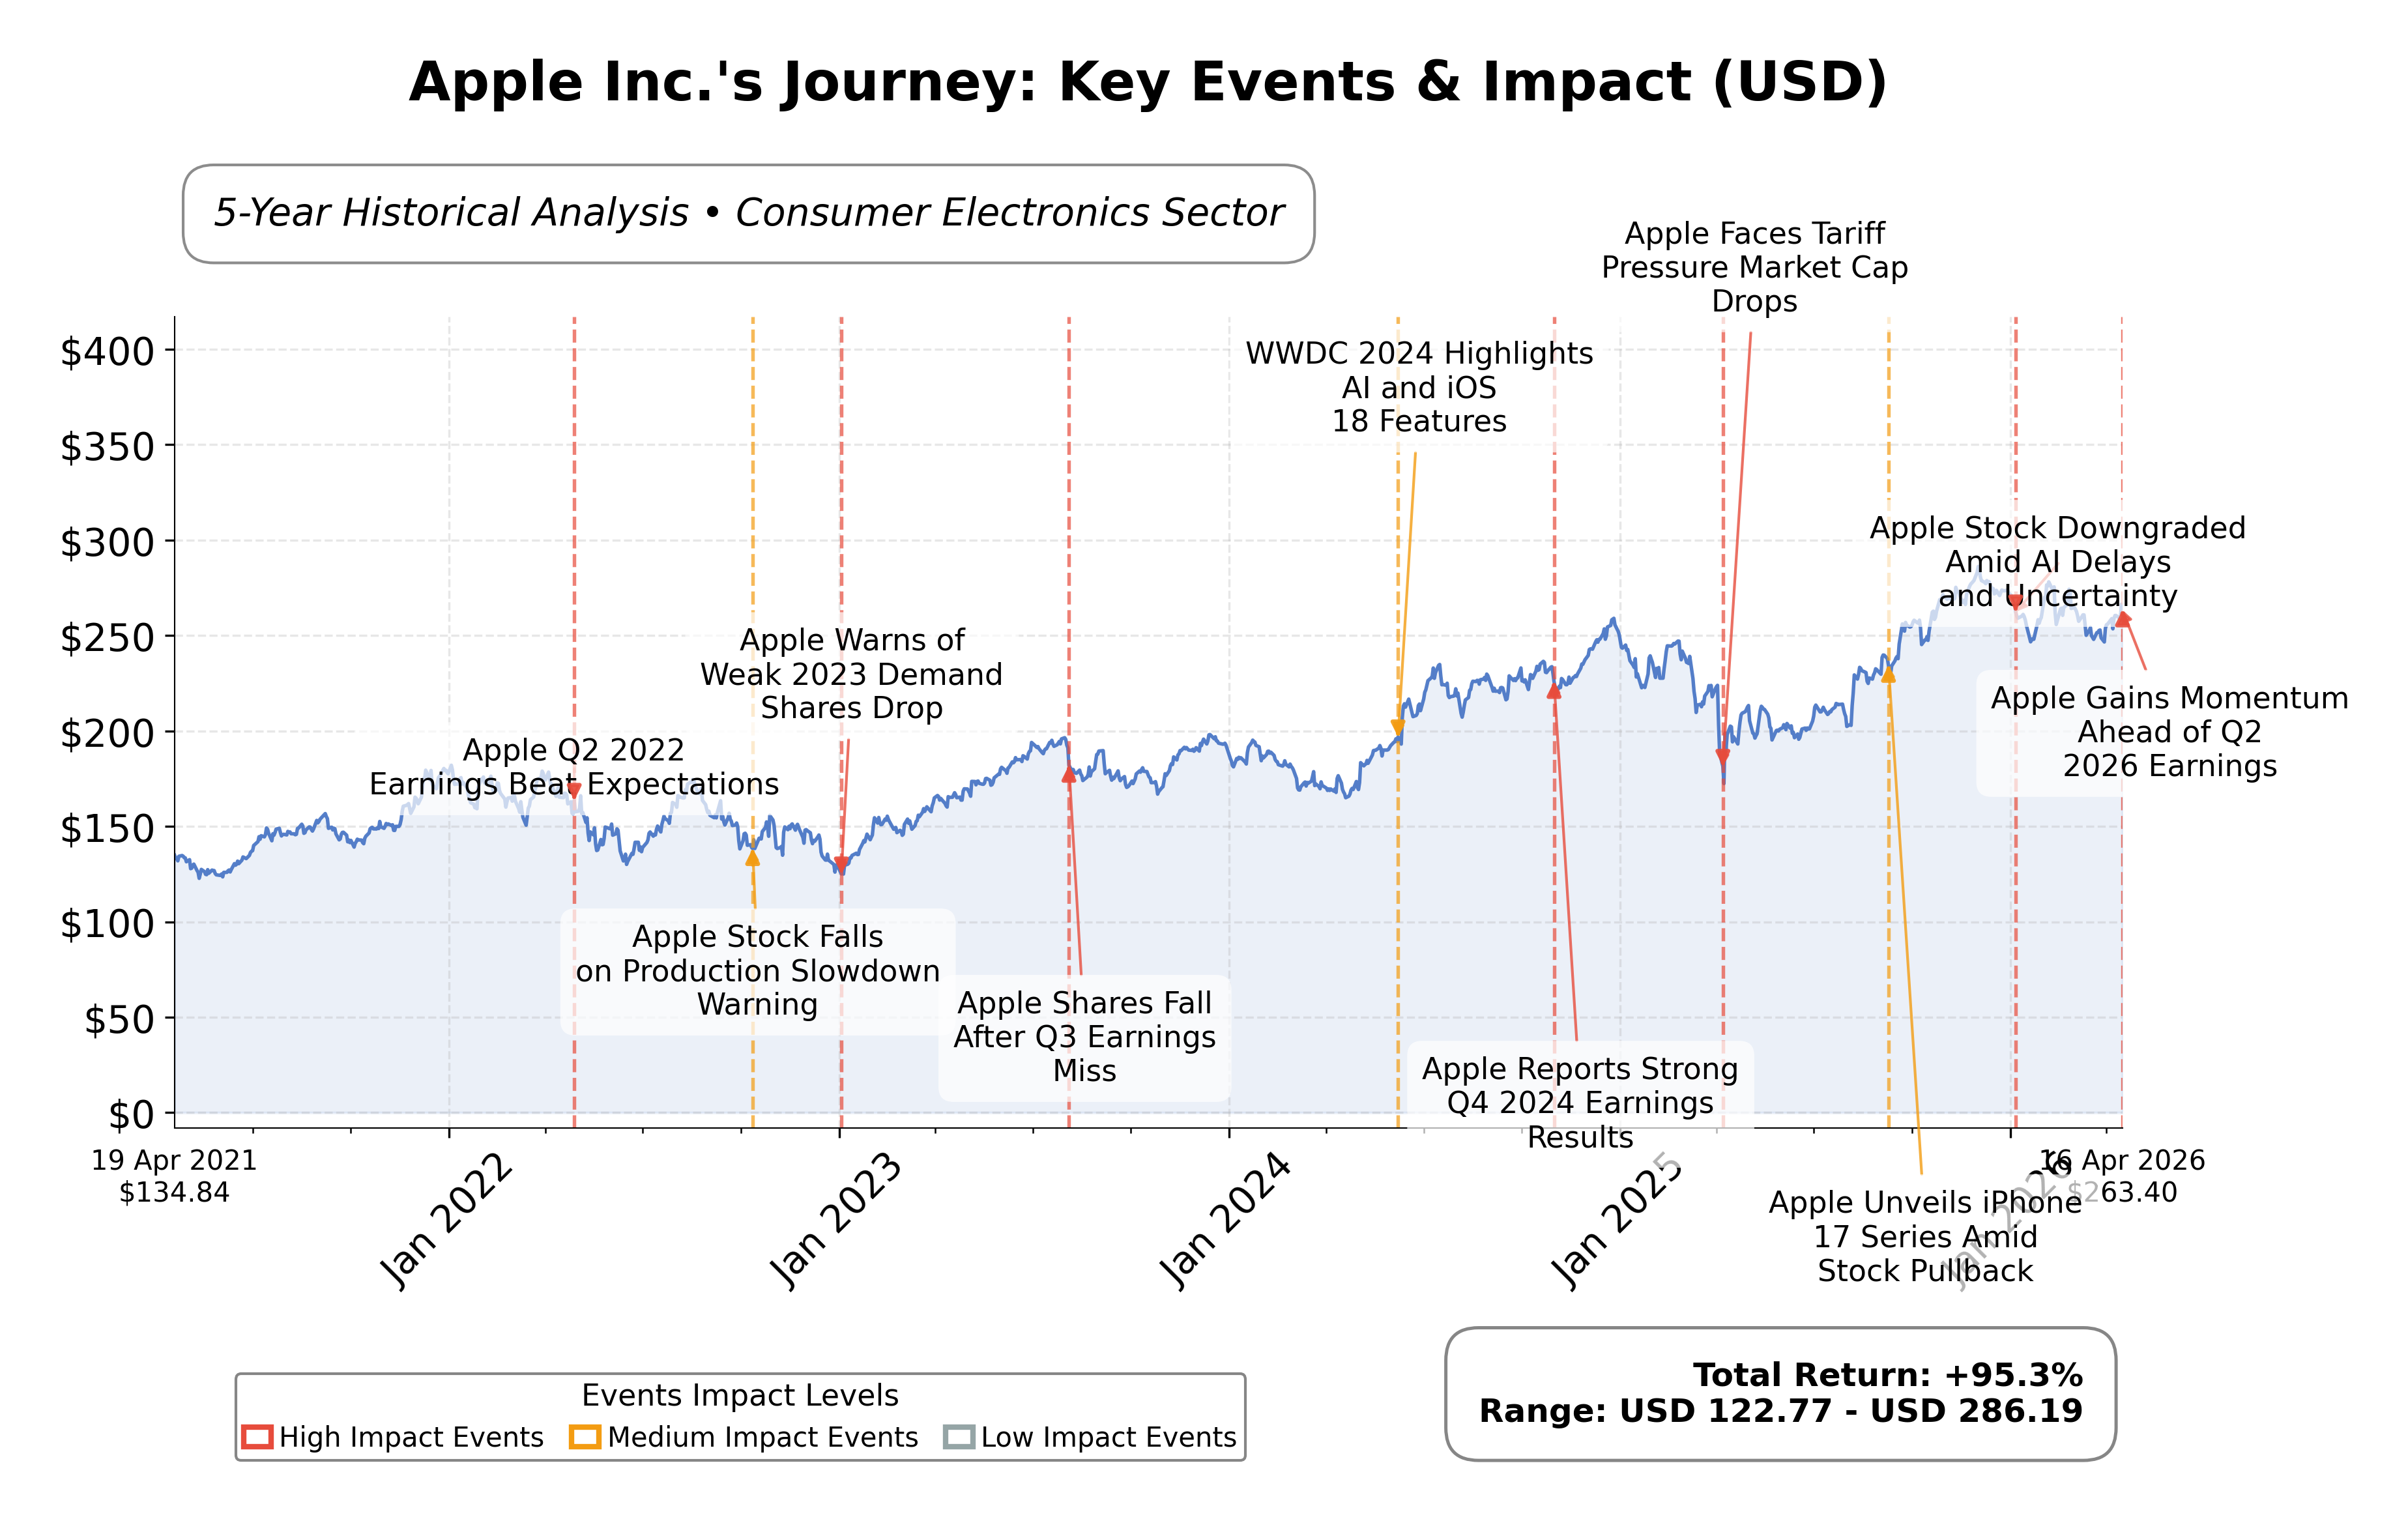
Stock Journey
Key Positives and Key Risks
Pros
- Free cash flow of $106.3 billion demonstrates strong cash generation capacity supporting financial flexibility.
- Revenue growth of 15.7% year-over-year indicates a robust growth trajectory.
- Market capitalization of $3.83 trillion reflects dominant industry positioning and scale.
Cons
- Price-to-book ratio of 43.43 suggests the stock is trading at a significant premium relative to book value.
- Current ratio of 0.974 indicates tight liquidity, potentially constraining short-term financial flexibility.
- Debt-to-equity ratio of 102.63% reflects a relatively high leverage level that may increase financial risk.
Disclosure: This information is for general awareness and does not constitute investment advice
Report Summary
Apple Inc. operates as a leading technology company listed on the NASDAQ exchange within the Technology sector, specializing in consumer electronics. The company designs, manufactures, and markets a broad range of products including the iPhone, Mac computers, iPad tablets, Apple Watch, and accessories such as AirPods. Additionally, Apple provides various digital services like the App Store, Apple Music, iCloud, and subscription platforms, positioning itself as a dominant player in the consumer electronics industry with a global footprint and a comprehensive ecosystem.
Financially, Apple reported trailing twelve-month revenue of approximately $435.6 billion with a gross margin of 48.16%, an operating margin of 35.37%, and a net profit margin of 27.04%, indicating strong profitability and operational efficiency. The company’s return on equity (ROE) stands at 1.52%, and return on assets (ROA) at 24.38%, reflecting effective asset utilization and shareholder value creation. Operating cash flow for the trailing twelve months reached $135.5 billion, with free cash flow at $106.3 billion, underscoring robust cash generation capabilities.
Apple’s valuation metrics show a trailing price-to-earnings (P/E) ratio of 33.02 and a forward P/E of 27.93, with a price-to-book (P/B) ratio of 43.43 and an enterprise value to EBITDA (EV/EBITDA) multiple of 25.17. The company’s market capitalization is approximately $3.83 trillion, with a current stock price near $263.36, trading within a 52-week range of $189.81 to $288.62. These figures suggest that the stock is priced at a premium relative to traditional valuation benchmarks, reflecting expectations of sustained growth and market leadership.
Key strengths include Apple’s substantial free cash flow, low debt-to-equity ratio near 102.63%, and dominant market position supported by a loyal customer base and integrated product ecosystem. Risks involve regulatory scrutiny, competitive pressures in technology and consumer electronics, and macroeconomic factors such as input cost inflation and global supply chain challenges. Recent strategic moves include new partnerships and product platform launches, alongside leadership changes such as the retirement of a senior marketing executive.
Technically, Apple’s stock shows a positive trend with price levels above its 50-day and 200-day moving averages, supported by momentum indicators signaling moderate strength. Recent news presents a mixed sentiment with both positive developments and some concerns. Overall, the data suggests a balanced environment where market participants may consider monitoring developments closely while assessing valuation and growth prospects.
Company and Industry Overview
Company Basics
Price Performance
Company Size
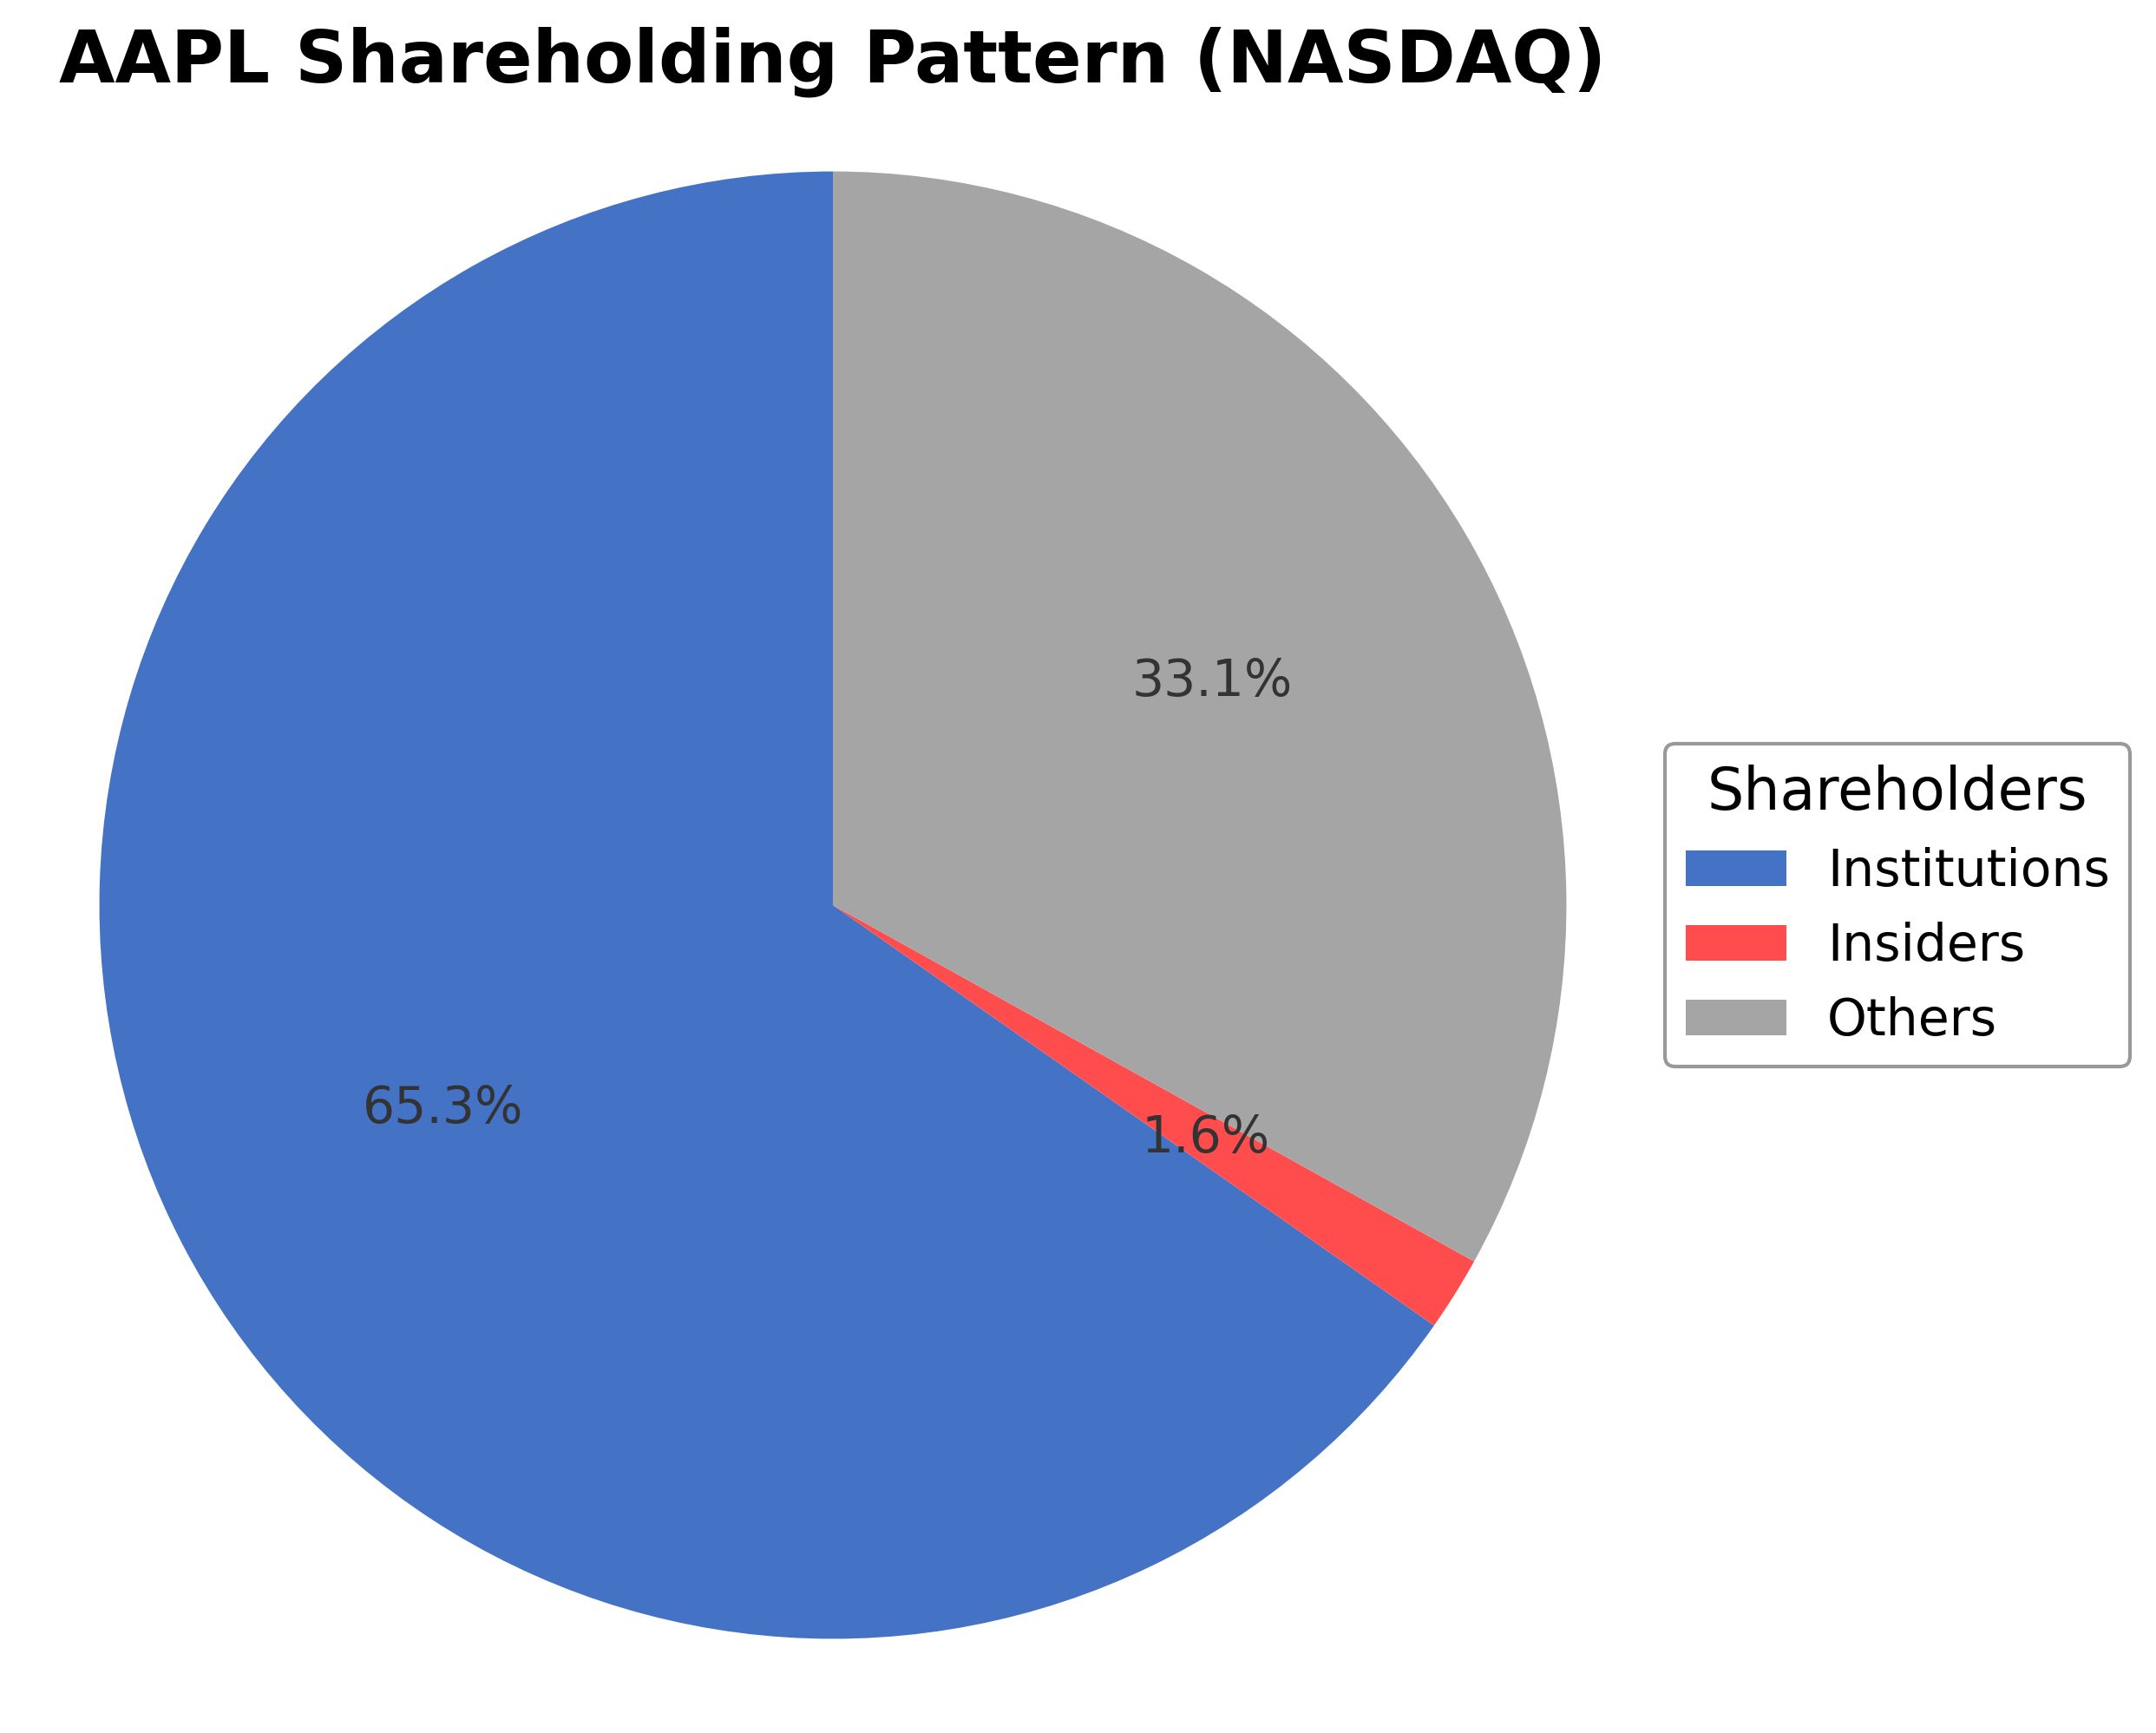
Shareholding Pattern
Sector and Industry Analysis
The technology sector, particularly the hardware and consumer electronics segment, is a multi-trillion dollar market characterized by steady growth driven by innovation and consumer demand for connected devices. Major players include Apple, Samsung, Microsoft, and Google, each competing across hardware, software, and services. The sector benefits from rapid technological advancements and increasing integration of digital ecosystems, fueling expansion in areas like smartphones, wearables, and computing devices.
Within the hardware industry, trends emphasize ecosystem integration, proprietary chip development, and expansion into services such as streaming and augmented reality. Companies like Apple leverage their software and hardware synergy to create high switching costs and brand loyalty, establishing significant competitive moats. Barriers to entry remain high due to capital intensity, supply chain complexity, and the necessity for continuous innovation, while partnerships with contract manufacturers and semiconductor firms are critical for scale and efficiency.
Regulatory scrutiny in the technology sector is intensifying, focusing on data privacy, antitrust concerns, and supply chain security. Governments worldwide are implementing stricter rules on user data protection and competition to curb monopolistic practices. For hardware companies, compliance with export controls and environmental regulations also shapes operational strategies, impacting product design and market access. The evolving regulatory environment demands ongoing adaptation to maintain compliance and competitive positioning.
Note: Analysis synthesized from industry research, market reports, and regulatory filings. Information is subject to change based on market conditions.
Financial Ratios Dashboard
Illustrative Scenario Analysis
DCF Assumptions:
Method: Two-Stage EPS-Priority Model
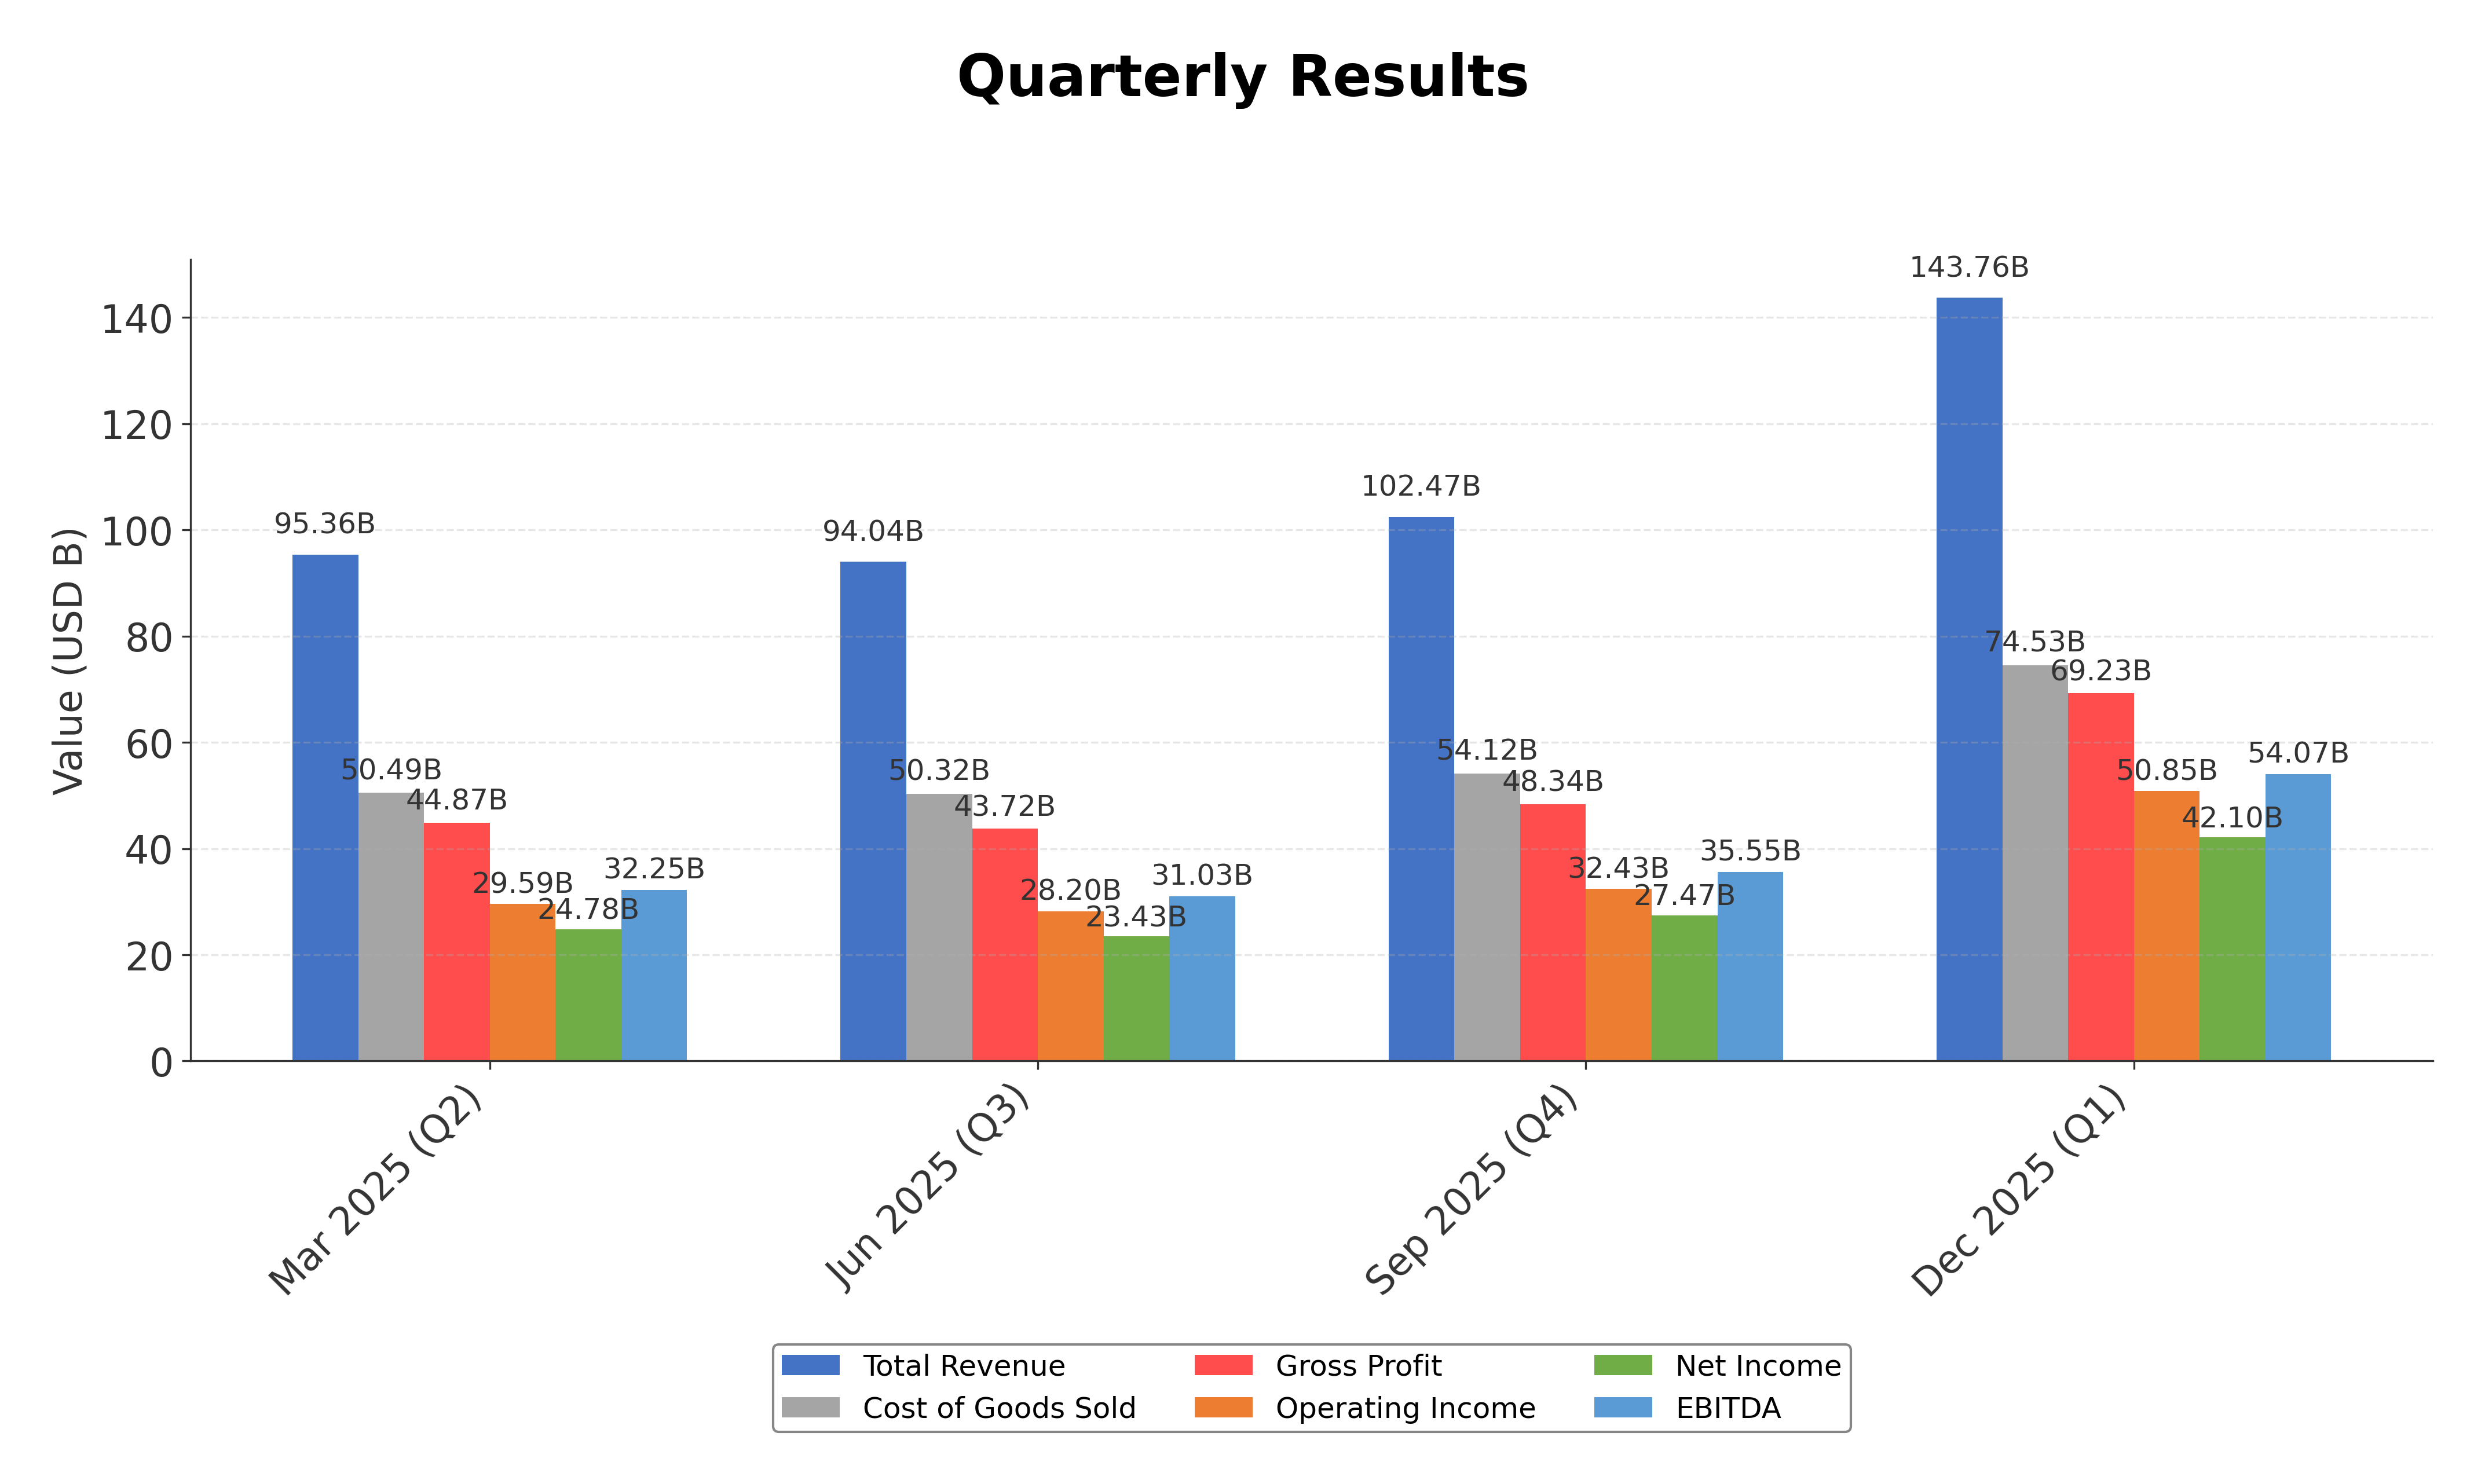
Financials
Peer Analysis
| Company Name | Market Cap | P/E Ratio | P/B Ratio | EV/EBITDA | Price to CFO |
|---|---|---|---|---|---|
| Apple Inc. | $3.83T | 33.02 | 43.43 | 25.17 | 28.26 |
| Sony Group Corporation - Sponsored American Depositary Receipt | $124.34B | 16.19 | 2.44 | 0.03 | 9.60 |
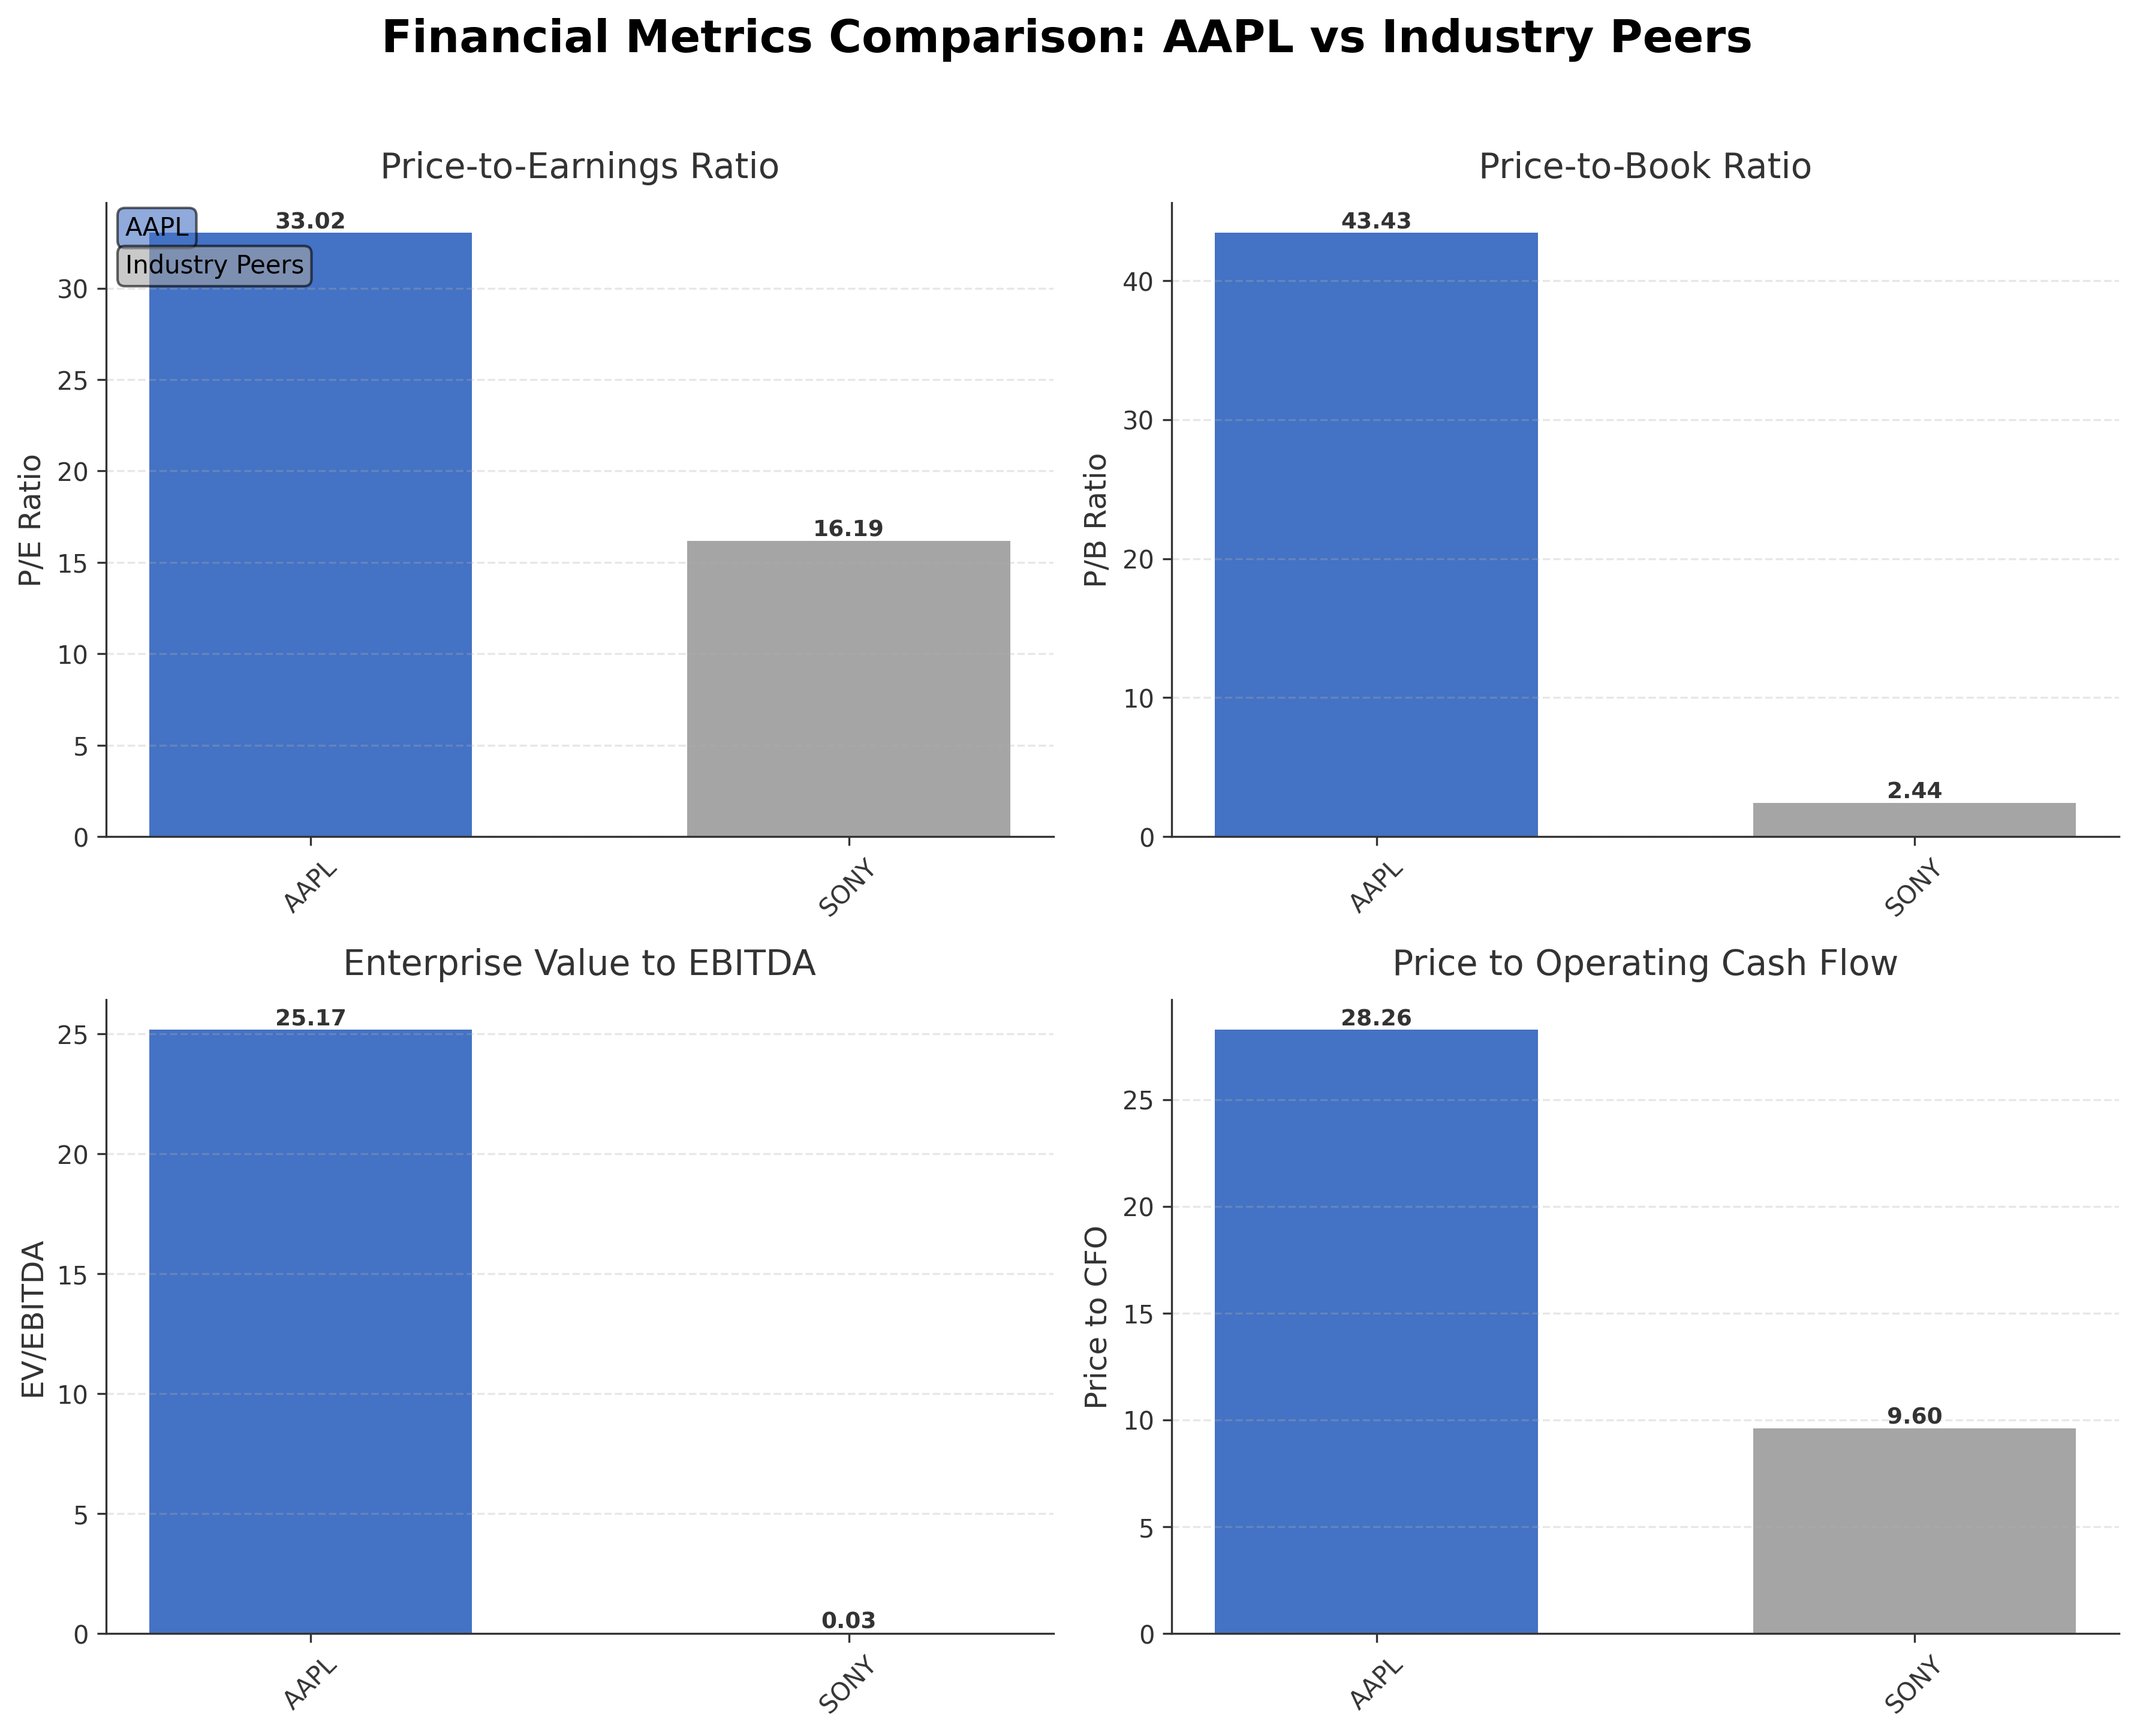
Comparison Analysis: Apple Inc. significantly outpaces its peer Sony Group Corporation in market capitalization, with a valuation of $3.83 trillion compared to Sony's $124.34 billion. Apple’s P/E ratio of 33.02 is more than double Sony’s 16.19, reflecting higher growth expectations or premium valuation. The price-to-book ratio for Apple at 43.43 far exceeds Sony’s 2.44, indicating a substantial premium on Apple’s equity. Enterprise value to EBITDA is also markedly higher for Apple at 25.17 versus Sony’s 0.03, suggesting stronger earnings relative to enterprise value. Return on equity for Apple at 1.52% is notably higher than Sony’s 0.15%, highlighting greater shareholder returns. Overall, Apple demonstrates superior scale and profitability metrics but trades at a premium relative to its industry peer.
Financial Metrics Comparison with Peers
Financial Statements
Comprehensive financial data including income, balance sheet, and cash flow metrics
Income Statement
| fiscal_date | 2025-09-30 | 2024-09-30 | 2023-09-30 | 2022-09-30 | 2021-09-30 |
|---|---|---|---|---|---|
| Sales | 416.16B | 391.04B | 383.29B | 394.33B | 365.82B |
| Cost Of Goods | 220.96B | 210.35B | 214.14B | 223.55B | 212.98B |
| Gross Profit | 195.20B | 180.68B | 169.15B | 170.78B | 152.84B |
| Operating Expense Research And Development | 34.55B | 31.37B | 29.91B | 26.25B | 21.91B |
| Operating Expense Selling General And Administrative | 27.60B | 26.10B | 24.93B | 25.09B | 21.97B |
| Operating Income | 133.05B | 123.22B | 114.30B | 119.44B | 108.95B |
| Other Income Expense | -321.00M | 269.00M | -565.00M | -334.00M | 60.00M |
| Pretax Income | 132.73B | 123.48B | 113.74B | 119.10B | 109.21B |
| Income Tax | 20.72B | 29.75B | 16.74B | 19.30B | 14.53B |
| Net Income | 112.01B | 93.74B | 97.00B | 99.80B | 94.68B |
| Eps Basic | 7.49 | 6.11 | 6.16 | 6.15 | 5.67 |
| Eps Diluted | 7.46 | 6.08 | 6.13 | 6.11 | 5.61 |
| Basic Shares Outstanding | 14.95B | 15.34B | 15.74B | 16.22B | 16.70B |
| Diluted Shares Outstanding | 14.95B | 15.34B | 15.74B | 16.22B | 16.70B |
| Ebit | 133.05B | 123.22B | 114.30B | 119.44B | 111.85B |
| Ebitda | 144.75B | 134.66B | 125.82B | 130.54B | 123.14B |
| Net Income Continuous Operations | 112.01B | 93.74B | 97.00B | 99.80B | 94.68B |
| Non Operating Interest Income | N/A | N/A | 3.75B | 2.83B | 2.84B |
| Non Operating Interest Expense | N/A | N/A | 3.93B | 2.93B | 2.65B |
Source: Financial statements and regulatory filings
Balance Sheet
| fiscal_date | 2025-09-30 | 2024-09-30 | 2023-09-30 | 2022-09-30 | 2021-09-30 |
|---|---|---|---|---|---|
| Cash And Cash Equivalents | 35.93B | 29.94B | 29.96B | 23.65B | 34.94B |
| Accounts Receivable | 39.78B | 33.41B | 29.51B | 28.18B | 26.28B |
| Total Assets | 359.24B | 364.98B | 352.58B | 352.75B | 351.00B |
| Total Liabilities | 285.51B | 308.03B | 290.44B | 302.08B | 287.91B |
| Long Term Debt | 78.33B | 85.75B | 95.28B | 109.71B | 119.38B |
| Shareholders Equity | 73.73B | 56.95B | 62.15B | 50.67B | 63.09B |
Source: Financial statements and regulatory filings
Cash Flow Statement
| fiscal_date | 2025-09-30 | 2024-09-30 | 2023-09-30 | 2022-09-30 | 2021-09-30 |
|---|---|---|---|---|---|
| Operating Activities Net Income | 112.01B | 93.74B | 97.00B | 99.80B | 94.68B |
| Operating Activities Depreciation | 11.70B | 11.45B | 11.52B | 11.10B | 11.28B |
| Operating Activities Stock Based Compensation | 12.86B | 11.69B | 10.83B | 9.04B | 7.91B |
| Operating Activities Other Non Cash Items | -89.00M | -2.27B | -2.23B | 1.01B | -4.92B |
| Operating Activities Accounts Receivable | -7.03B | -5.14B | -417.00M | -9.34B | -14.03B |
| Operating Activities Accounts Payable | 902.00M | 6.02B | -1.89B | 9.45B | 12.33B |
| Operating Activities Other Assets Liabilities | -18.87B | 2.77B | -4.27B | 1.57B | -1.53B |
| Operating Activities Operating Cash Flow | 111.48B | 118.25B | 110.54B | 123.52B | 100.94B |
| Investing Activities Capital Expenditures | -12.71B | -9.45B | -10.96B | -10.71B | -11.09B |
| Investing Activities Purchase Of Investments | -24.41B | -48.66B | -29.51B | -76.92B | -109.56B |
| Investing Activities Sale Of Investments | 53.80B | 62.35B | 45.51B | 67.36B | 106.48B |
| Investing Activities Other Investing Activity | -1.48B | -1.31B | -1.34B | -2.09B | -385.00M |
| Investing Activities Investing Cash Flow | 15.20B | 2.94B | 3.71B | -22.66B | -14.58B |
| Financing Activities Long Term Debt Issuance | 4.48B | 0.00 | 5.23B | 5.46B | 20.39B |
| Financing Activities Long Term Debt Payments | -10.93B | -9.96B | -11.15B | -9.54B | -8.75B |
| Financing Activities Short Term Debt Issuance | -2.03B | 3.96B | -3.98B | 3.96B | 1.02B |
| Financing Activities Common Stock Repurchase | -90.71B | -94.95B | -77.55B | -89.40B | -85.97B |
| Financing Activities Common Dividends | -15.42B | -15.23B | -15.03B | -14.84B | -14.47B |
| Financing Activities Other Financing Charges | -6.07B | -5.80B | -6.01B | -6.38B | -5.58B |
| Financing Activities Financing Cash Flow | -120.69B | -121.98B | -108.49B | -110.75B | -92.25B |
| End Cash Position | 35.93B | 29.94B | 30.74B | 24.98B | 35.93B |
| Income Tax Paid | 43.37B | 26.10B | 18.68B | 19.57B | 25.39B |
| Free Cash Flow | 98.77B | 108.81B | 99.58B | 111.44B | 92.95B |
| Interest Paid | N/A | N/A | 3.80B | 2.87B | 2.69B |
| Operating Activities Deferred Taxes | N/A | N/A | N/A | 895.00M | -4.77B |
| Investing Activities Net Acquisitions | N/A | N/A | N/A | -306.00M | -33.00M |
| Financing Activities Common Stock Issuance | N/A | N/A | N/A | N/A | 1.10B |
Source: Financial statements and regulatory filings
Technical Analysis
Key Insights
- The current trend for Apple’s stock is upward, with price action showing higher highs and higher lows over recent weeks.
- Key support levels are identified near $250 and $260, while resistance is observed around the 52-week high near $288.62.
- The stock price is trading above the 10-day, 50-day (approximately $260.80), and 200-day (approximately $250.33) moving averages, indicating bullish momentum.
- Momentum indicators show the RSI in a moderate range, suggesting neither overbought nor oversold conditions; MACD remains positive but with narrowing histogram bars.
- Daily and weekly timeframes confirm the uptrend, while monthly charts reflect longer-term strength with occasional consolidation phases.
- Potential scenarios include continuation of the upward trend if support holds, or a pullback towards the 50-day moving average if resistance near $288.62 proves strong.
Trending News
1. Headline: Apple stock sees stunning Wall Street twist before earnings | AAPL - TheStreet
Summary: Bank of America thinks that Apple will announce another big buyback and a dividend increase, which will give investors even more reason to be positive. For shareholders, the report is not just another analyst note. This shows that one big Wall Street firm thinks Apple stock might still have ...
Sentiment: positive
2. Headline: Tech stocks today: Tesla, Apple lead 'Magnificent 7' stocks lower, TSMC sends bullish signal on AI demand
Summary: On Thursday, Tesla (TSLA) stock fell, reversing some of its 8% gain from Wednesday’s session after shares were buoyed by CEO Elon Musk teasing the company’s AI5 chip. Speaking of AI chips, Taiwan Semiconductor Manufacturing Company (TSM) released its latest quarterly earnings on Thursday. A sizable 58% increase in first quarter profits and comments by the company’s CEO sent a strong signal that AI demand remains robust. Other news ...
Sentiment: negative
3. Headline: Top BofA Analyst Raises Apple Stock (AAPL) Price Target Ahead of Q2 Earnings - TipRanks.com
Summary: Apple (AAPL) stock is down 2% year-to-date due to concerns about higher input costs, tariffs, and the impact of macro uncertainty on consumer spending. Nonetheless, ahead of Apple’s Q2 FY26 earnings, AAPL bulls are optimistic about the stock, citing several positives, including a loyal iPhone ...
Sentiment: negative
4. Headline: Apple, Google List ‘Nudify’ Apps Despite Bans, Report Finds - Bloomberg
Summary: Apple Inc. and Google have continued to offer mobile apps that let users make nonconsensual sexualized images of people despite their policies prohibiting such content, according to a report published Wednesday by the Tech Transparency Project.
Sentiment: neutral
5. Headline: Apple (AAPL) Stock Trades Up, Here Is Why - StockStory
Summary: What Happened? Shares of iPhone and iPad maker Apple (NASDAQ:AAPL) jumped 2.6% in the afternoon session after news broke about a major new partnership to upg...
Sentiment: positive
Recent Updates
News Summary
Recent news about Apple Inc. highlights a mix of corporate developments and market activity. The company released its 2026 environmental progress report, emphasizing sustainability efforts. Leadership changes include the retirement of the marketing chief responsible for Apple Watch, AirPods, and health initiatives, signaling potential shifts in strategic focus. Market activity shows some institutional selling, with YHB Investment Advisors reducing its stake by 2.9%. Additionally, Apple introduced a lower-cost MacBook option, expanding its product accessibility. These themes collectively reflect ongoing innovation, evolving leadership, and active market participation, impacting Apple's positioning and investor sentiment.
News Sentiment
Sentiment across recent updates is generally neutral to mildly positive, with sustainability reporting and product expansion viewed favorably. Leadership retirement and institutional selling introduce cautious undertones, while no significant negative regulatory or operational issues were reported. Overall, the sentiment suggests steady confidence tempered by typical market adjustments and corporate transitions.
Analytical Overview
Analysis Summary
Apple’s valuation metrics, including a trailing P/E of 33.02 and forward P/E of 27.93, are elevated relative to the consumer electronics industry average P/E of 33.02, indicating pricing consistent with expected growth. Revenue growth of 15.7% year-over-year and strong operating cash flow trends demonstrate a solid growth trajectory supported by robust free cash flow generation. Financial health is reflected in a debt-to-equity ratio of approximately 102.63% and a current ratio near 0.974, indicating manageable leverage and liquidity levels. Sector-specific challenges include regulatory scrutiny and supply chain constraints, while opportunities arise from expanding services and ecosystem integration. Market positioning and competitive advantages are strong, supported by a loyal customer base and diversified product portfolio.
Overall Business and Market Assessment
Supporting Factors: Apple’s substantial free cash flow exceeding $106 billion, consistent revenue growth of 15.7%, and dominant market presence
Risk Factors: No data
SWOT Analysis
Strengths
- Apple maintains a strong brand with a loyal global customer base.
- The company generates substantial free cash flow exceeding $106 billion annually.
- Robust product ecosystem integrates hardware and services effectively.
- Market capitalization of $3.83 trillion reflects industry leadership.
Weaknesses
- High price-to-book ratio at 43.43 indicates premium valuation.
- Current ratio below 1 at 0.974 suggests tight short-term liquidity.
- Debt-to-equity ratio over 100% reflects significant leverage.
- Dependence on iPhone sales for majority of revenue.
Opportunities
- Expansion of services segment including subscription platforms.
- New product launches and strategic partnerships to drive growth.
- Increasing demand for wearable and health-related technology.
- Potential to capture market share in emerging markets.
Threats
- Regulatory scrutiny related to app policies and privacy concerns.
- Competitive pressures from other technology and consumer electronics firms.
- Supply chain disruptions impacting product availability.
- Macroeconomic factors such as inflation and tariffs affecting costs.
Company Description
Apple Inc. is a leading technology company renowned for designing, manufacturing, and marketing innovative hardware and software products for consumers and businesses worldwide. Its flagship product, the iPhone, accounts for the majority of sales, serving as the central hub of an expansive ecosystem that includes Mac computers, iPad tablets, Apple Watch wearables, and accessories like AirPods. Apple Inc. also offers a suite of services such as the App Store, Apple Music, iCloud, Apple TV+, and Apple Fitness+, providing digital content, cloud storage, and subscription-based platforms. Operating in the consumer electronics industry within the technology sector, the company employs approximately 166,000 people and maintains a broad global presence through online stores, retail outlets, and partnerships with carriers and resellers. With a substantial market capitalization reflecting its scale, Apple Inc. plays a pivotal role in shaping consumer technology trends, emphasizing seamless integration across devices and services to enhance user experience and productivity.