
360 One Wam Ltd (360ONE)
Stock Analysis Report
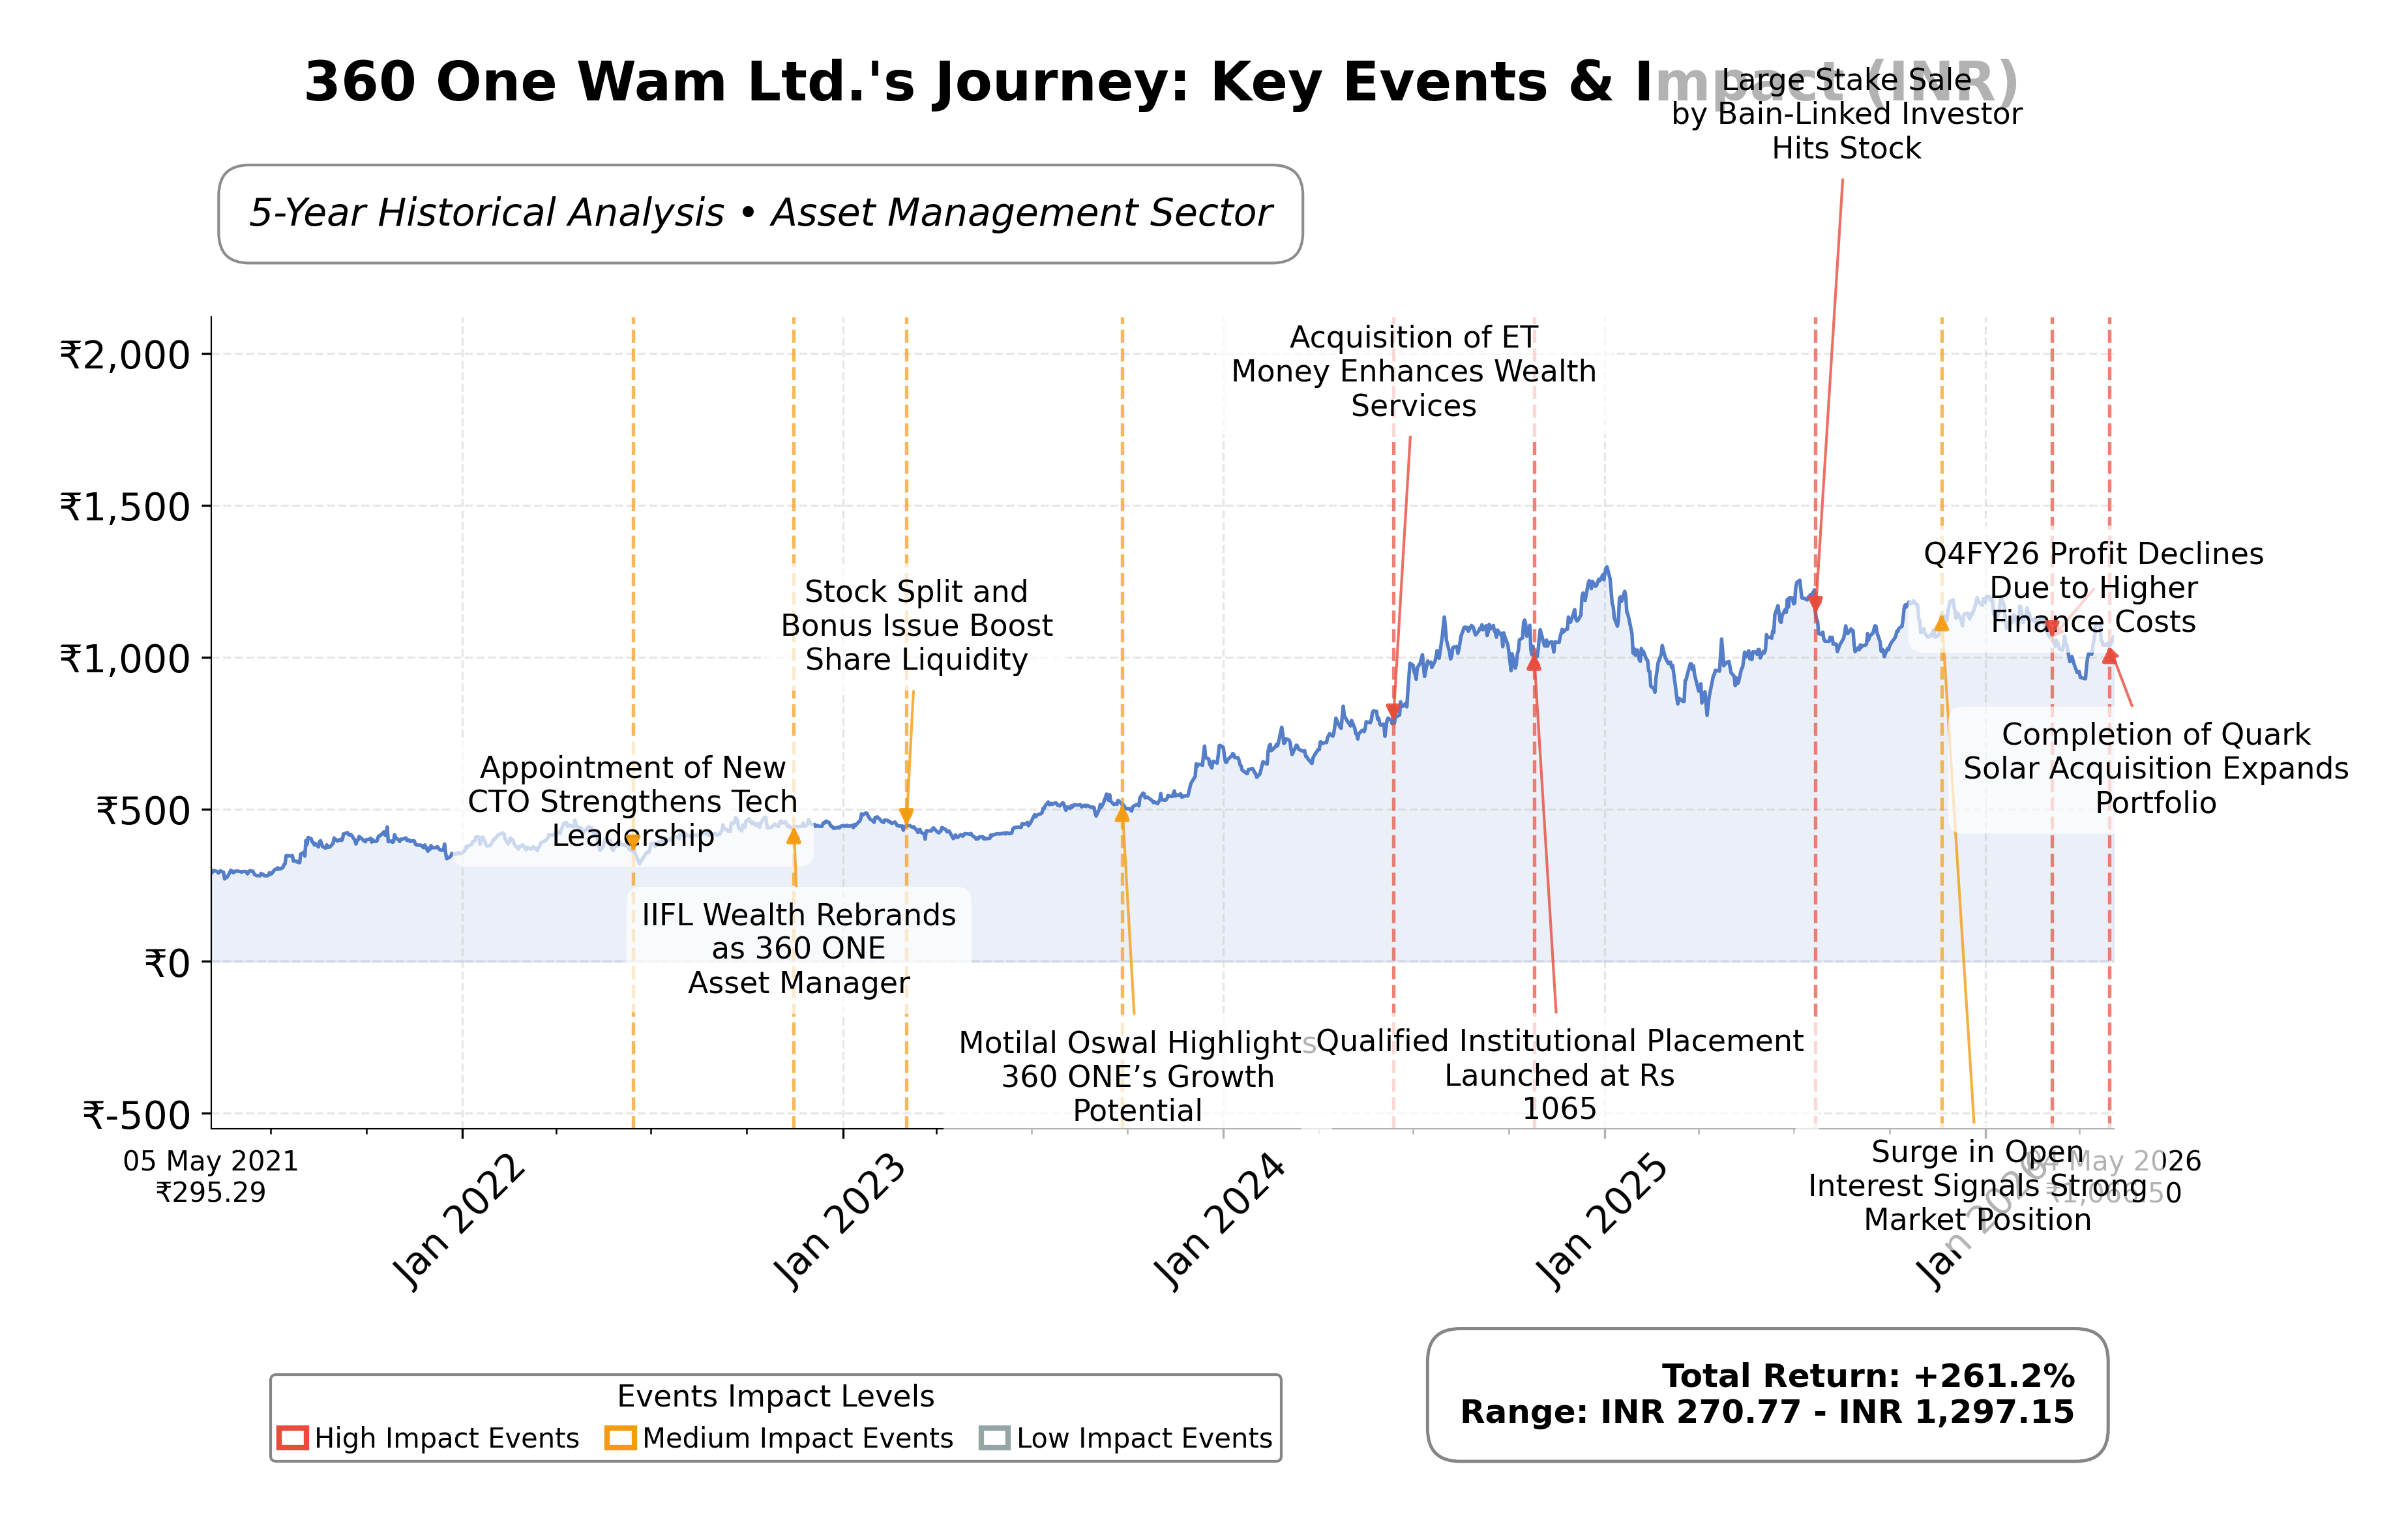
Stock Journey
Key Positives and Key Risks
Pros
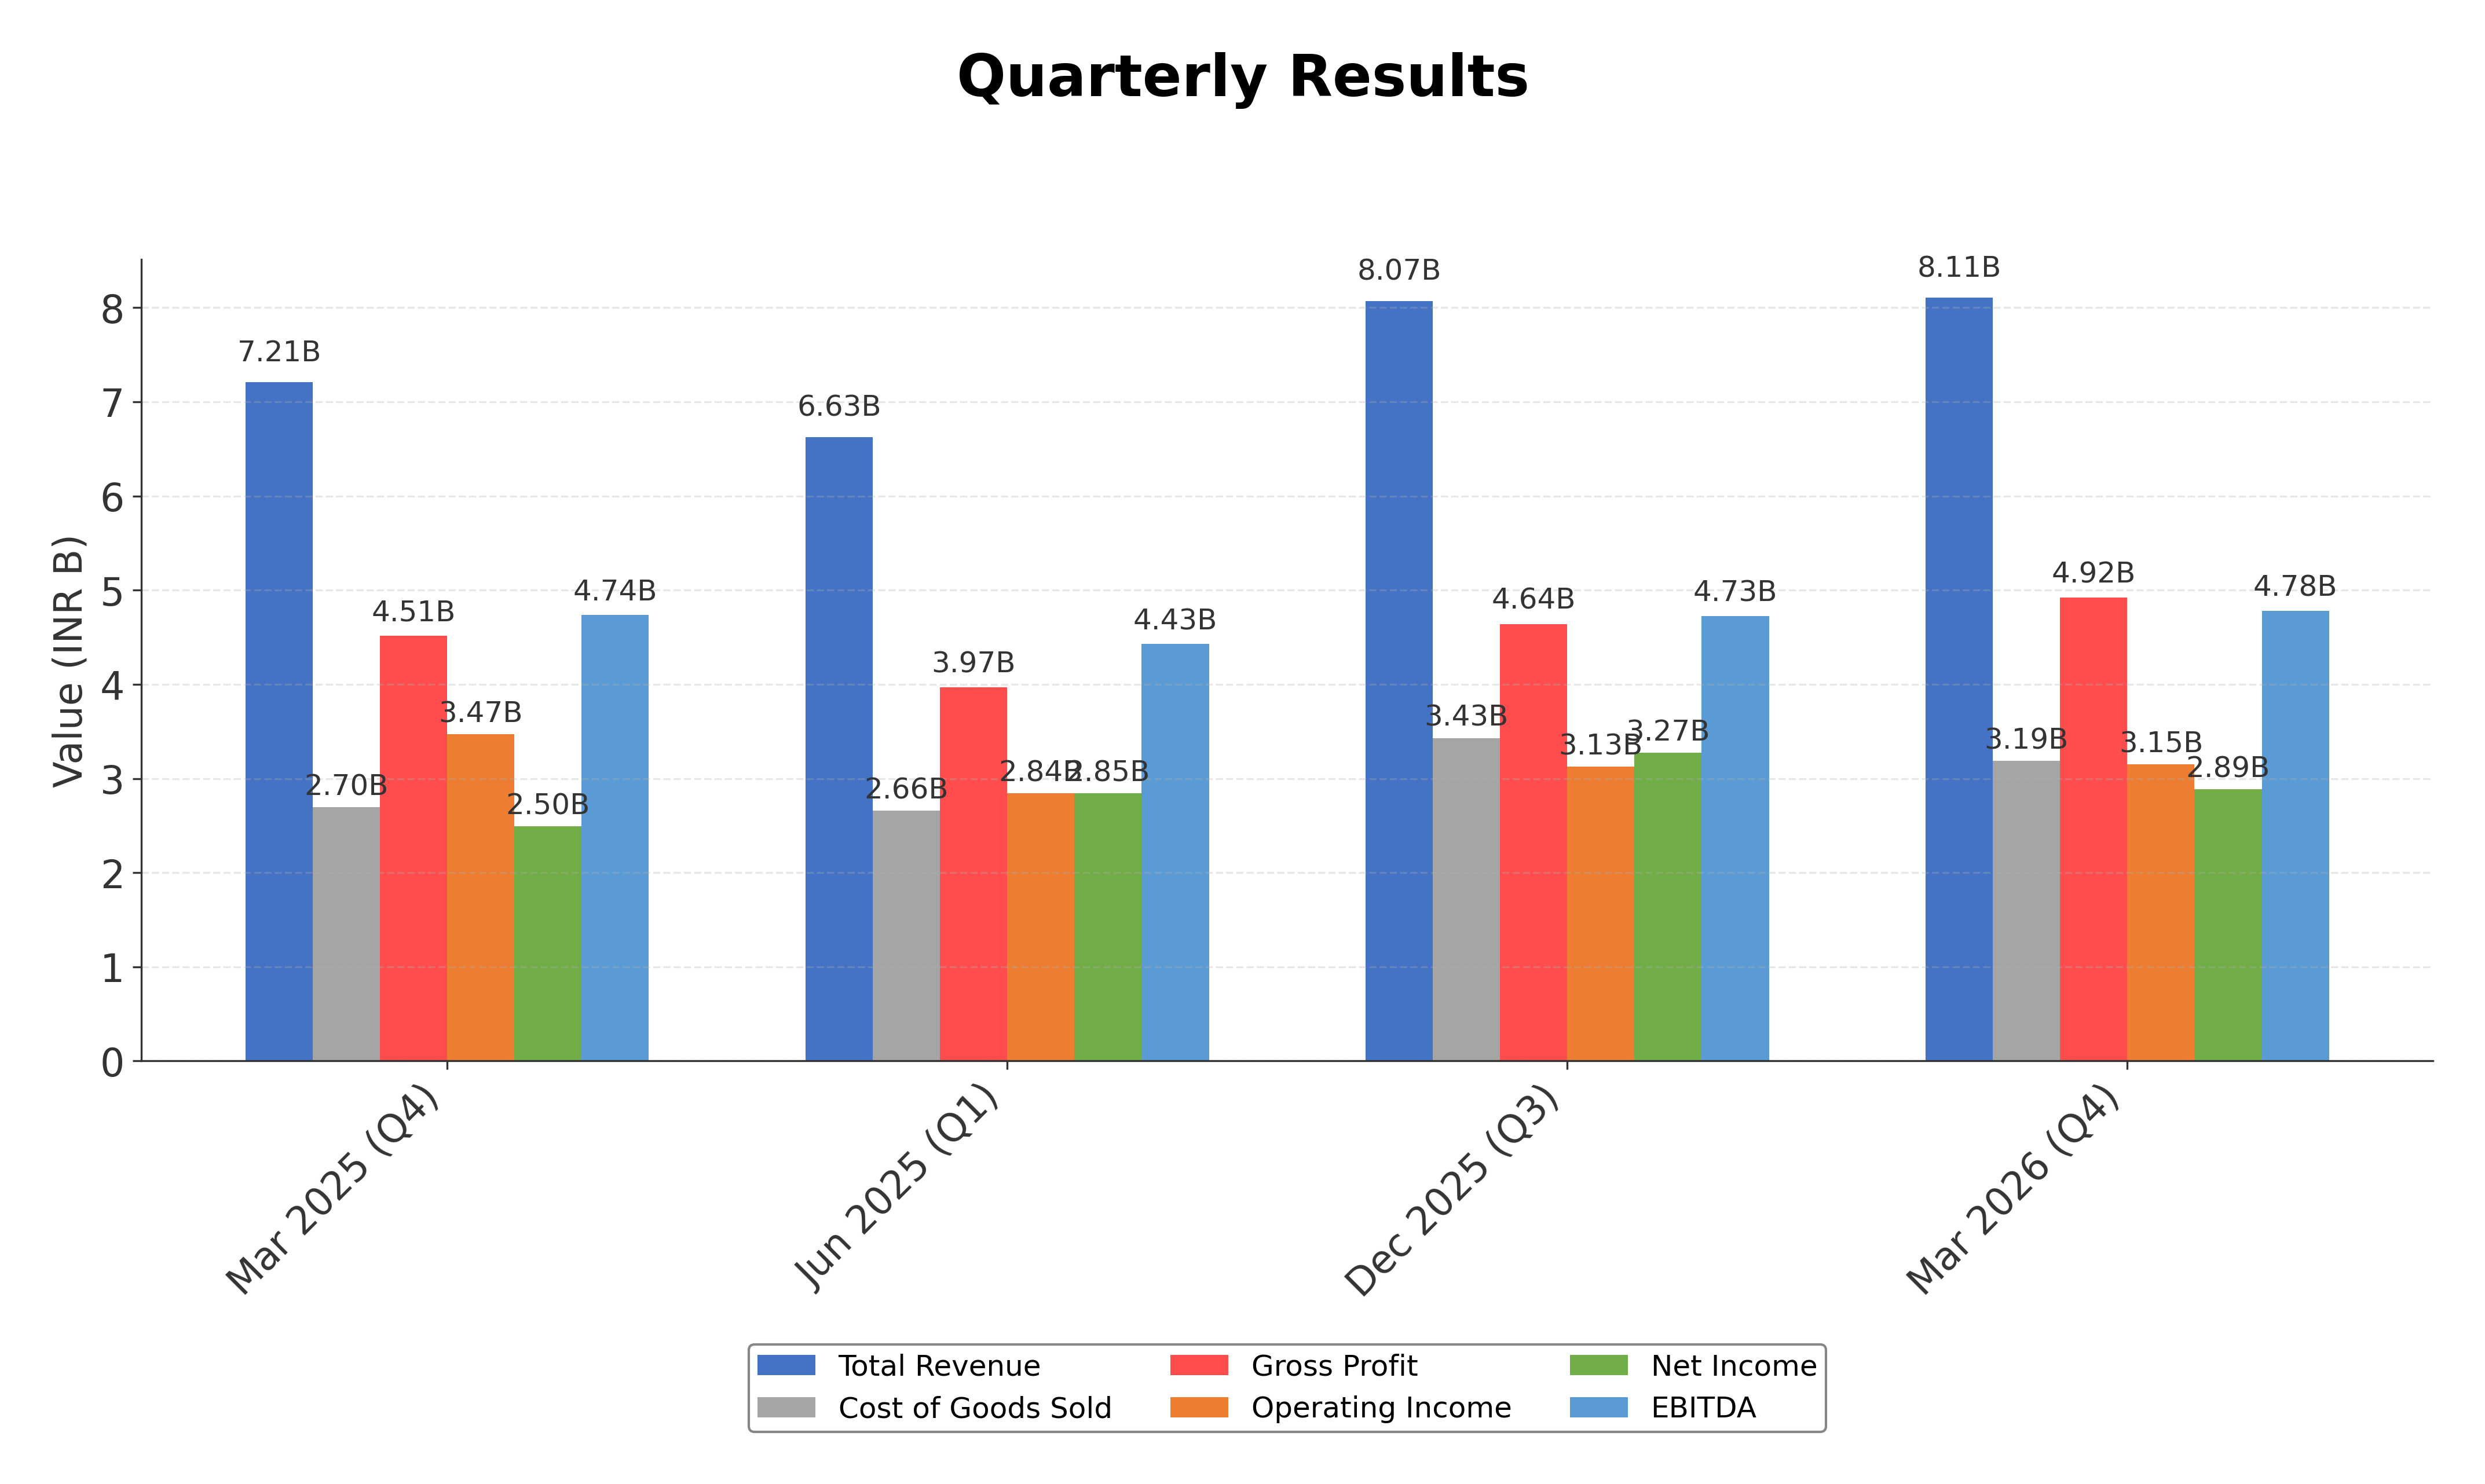
- Revenue growth of 26.9% quarter-over-quarter demonstrates strong top-line momentum.
- Net profit margin of 27.2% indicates robust profitability and operational efficiency.
- Return on equity of 14.4% exceeds peer averages, reflecting effective capital utilization.
Cons
- Debt-to-equity ratio of 161.98 signals high leverage and potential financial risk.
- Negative operating cash flow despite positive free cash flow suggests cash management challenges.
- Stock trades at a premium with a trailing P/E of 35.64, which may limit valuation upside.
Disclosure: This information is for general awareness and does not constitute investment advice
Report Summary
360 One Wam Ltd. operates as a leading financial services company specializing in wealth and asset management solutions in India. Listed on the NSE under the Financial Services sector, the company caters primarily to high-net-worth individuals and institutional clients. Its business segments include portfolio management, investment advisory, and wealth planning across diverse asset classes such as real estate, equities, fixed income, and alternative investments. The company leverages research-driven insights and client-centric approaches to maintain a significant presence in the asset management industry.
Financially, 360 One Wam Ltd. reported trailing twelve months (TTM) revenue of approximately ₹44.77 billion with a robust gross margin of 60.7% and an operating margin of 57.7%. The net profit margin stands at 27.2%, reflecting strong profitability. The company’s return on equity (ROE) is 14.4%, and return on assets (ROA) is 7.1%, indicating efficient use of equity and assets to generate earnings. The return on invested capital (ROIC) is consistent with these metrics, underscoring operational efficiency.
Valuation metrics show a trailing P/E ratio of 35.6 and a forward P/E of 25.0, suggesting that the stock trades at a premium relative to earnings expectations. The price-to-book ratio is 4.29, and the enterprise value to EBITDA ratio is 19.99, reflecting a valuation above industry averages. The market capitalization is approximately ₹420 billion, with the stock price currently at ₹1,073, situated between its 52-week low of ₹882.6 and high of ₹1,273.8. This positioning indicates moderate price volatility within the past year.
The company’s strengths include strong cash reserves of ₹14.8 billion, a high current ratio of 13.0 indicating liquidity, and a diversified asset management portfolio. However, the company carries significant debt of ₹159.3 billion, with a debt-to-equity ratio of 162, posing leverage risks. Recent strategic actions include the acquisition of Quark Solar Private Limited, enhancing its alternative asset management capabilities, and an employee stock option allotment, reflecting internal growth initiatives. Regulatory compliance has been maintained with recent disclosures on promoter encumbrances.
Technically, the stock shows a stable trend with price levels above the 50-day moving average but below the 200-day moving average, indicating mixed momentum. Recent news highlights both positive developments in revenue guidance and challenges from mark-to-market losses impacting profits. Overall, market conditions suggest a balanced outlook with factors supporting both accumulation and cautious monitoring.
Company and Industry Overview
Company Basics
Price Performance
Company Size
Shareholding Pattern
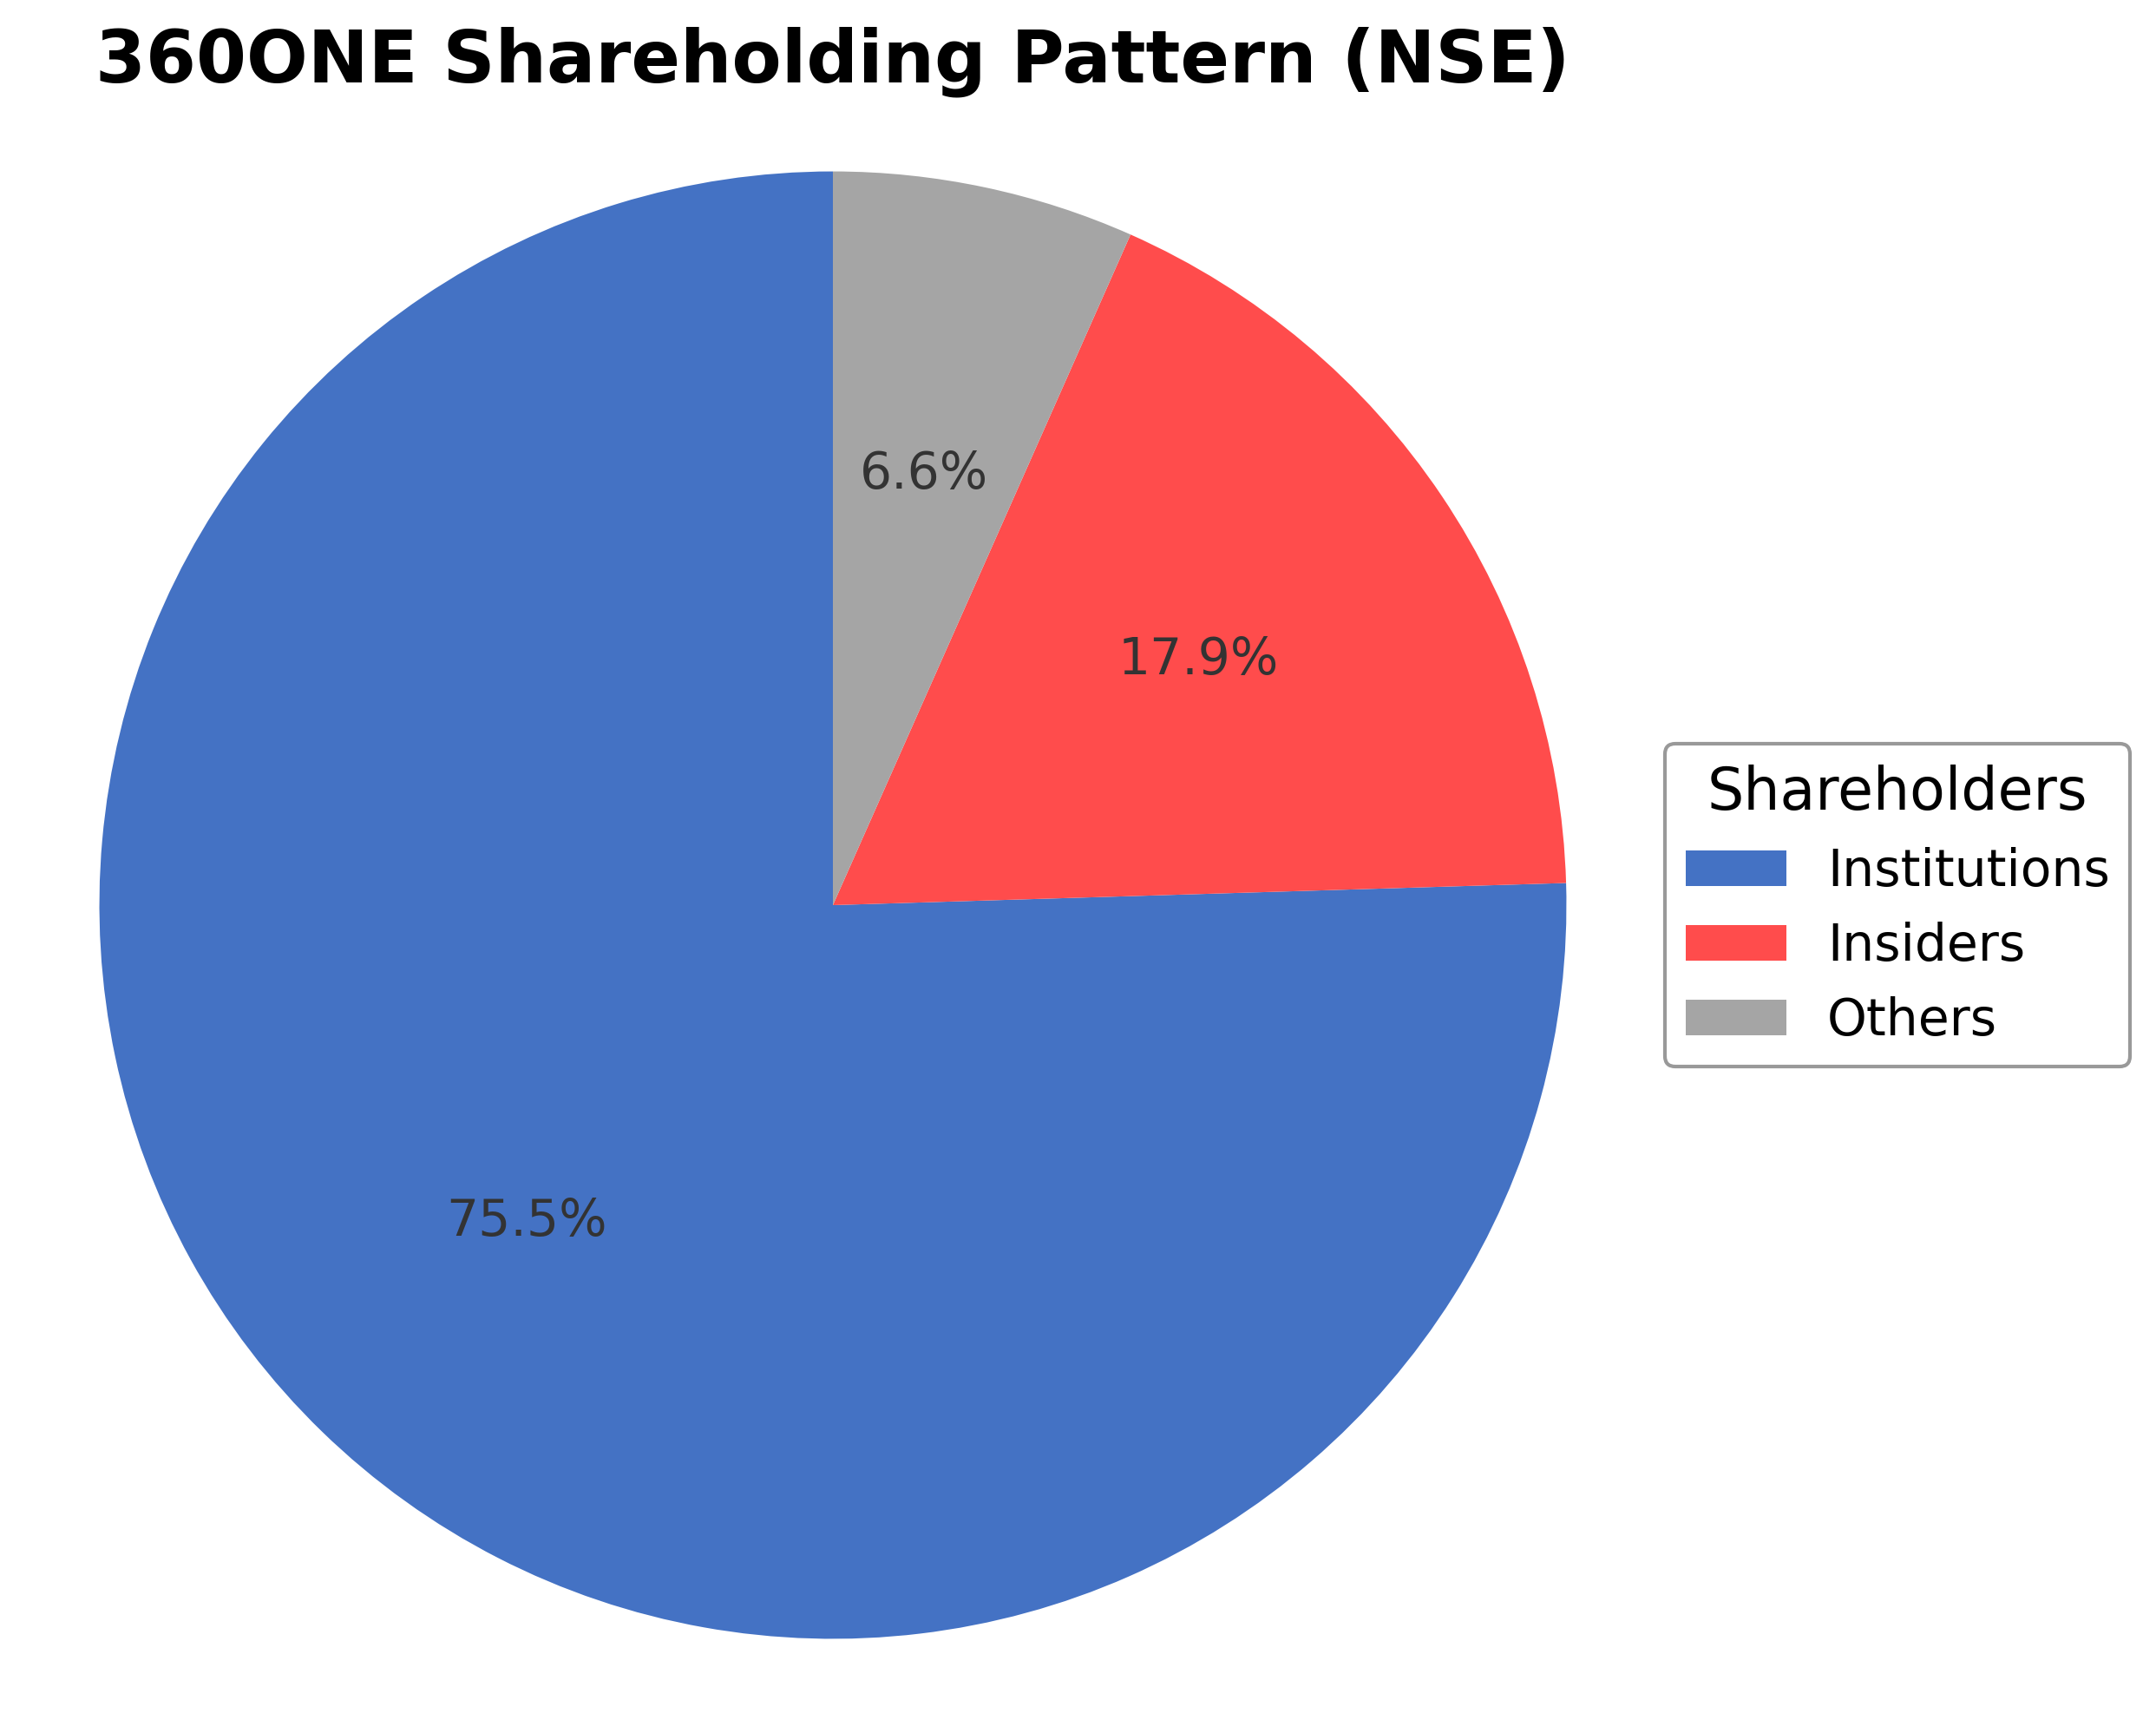
The shareholding structure of 360 One Wam Ltd. is predominantly institutional, with institutional investors holding approximately 75.48% of shares, reflecting strong institutional confidence. Promoters and insiders collectively own 17.87%, including key promoter group members Kush Bhagat and Kyra Bhagat, each holding 0.33%, with recent revisions clarifying encumbrance status to nil. Public and other shareholders account for about 6.65%. Over the past 12-24 months, institutional holdings have remained stable with no significant accumulation or distribution reported. This ownership pattern suggests a governance framework influenced by institutional oversight, supporting strategic continuity and regulatory compliance within the asset management industry.
Sector and Industry Analysis
The Indian wealth management sector is sizable, managing assets exceeding ₹50 lakh crores, and is projected to grow at a compound annual growth rate of 15-20% over the next decade. This growth is fueled by rising incomes, increasing wealth creation, and deeper financial markets. Key players include private banks like HDFC Bank Private and ICICI Private, independent wealth managers such as 360 ONE and Motilal Oswal, along with emerging fintech platforms.
Industry trends highlight significant product innovation and increasing market penetration, driven by the growth of high-net-worth individuals (HNIs) and consolidation opportunities. The sector faces challenges including market volatility, regulatory changes, intense competition, and talent acquisition hurdles. Barriers to entry remain moderate due to the need for strong client relationships and regulatory compliance, with firms like 360 ONE holding an 8-10% market share in the organized segment.
The regulatory environment is shaped by capital market reforms, tax incentives, and initiatives aimed at financial inclusion and digital infrastructure development. These policies support sector expansion but also impose capital requirements that can constrain leverage and operational flexibility. Overall, regulatory measures aim to enhance transparency and stability, influencing competitive dynamics and growth prospects within the wealth management industry.
Note: Analysis synthesized from industry research, market reports, and regulatory filings. Information is subject to change based on market conditions.
Financial Ratios Dashboard
Illustrative Scenario Analysis
DCF Assumptions:
Method: Two-Stage EPS-Priority Model
Financials
Peer Analysis
| Company Name | Market Cap | P/E Ratio | P/B Ratio | EV/EBITDA | Price to CFO |
|---|---|---|---|---|---|
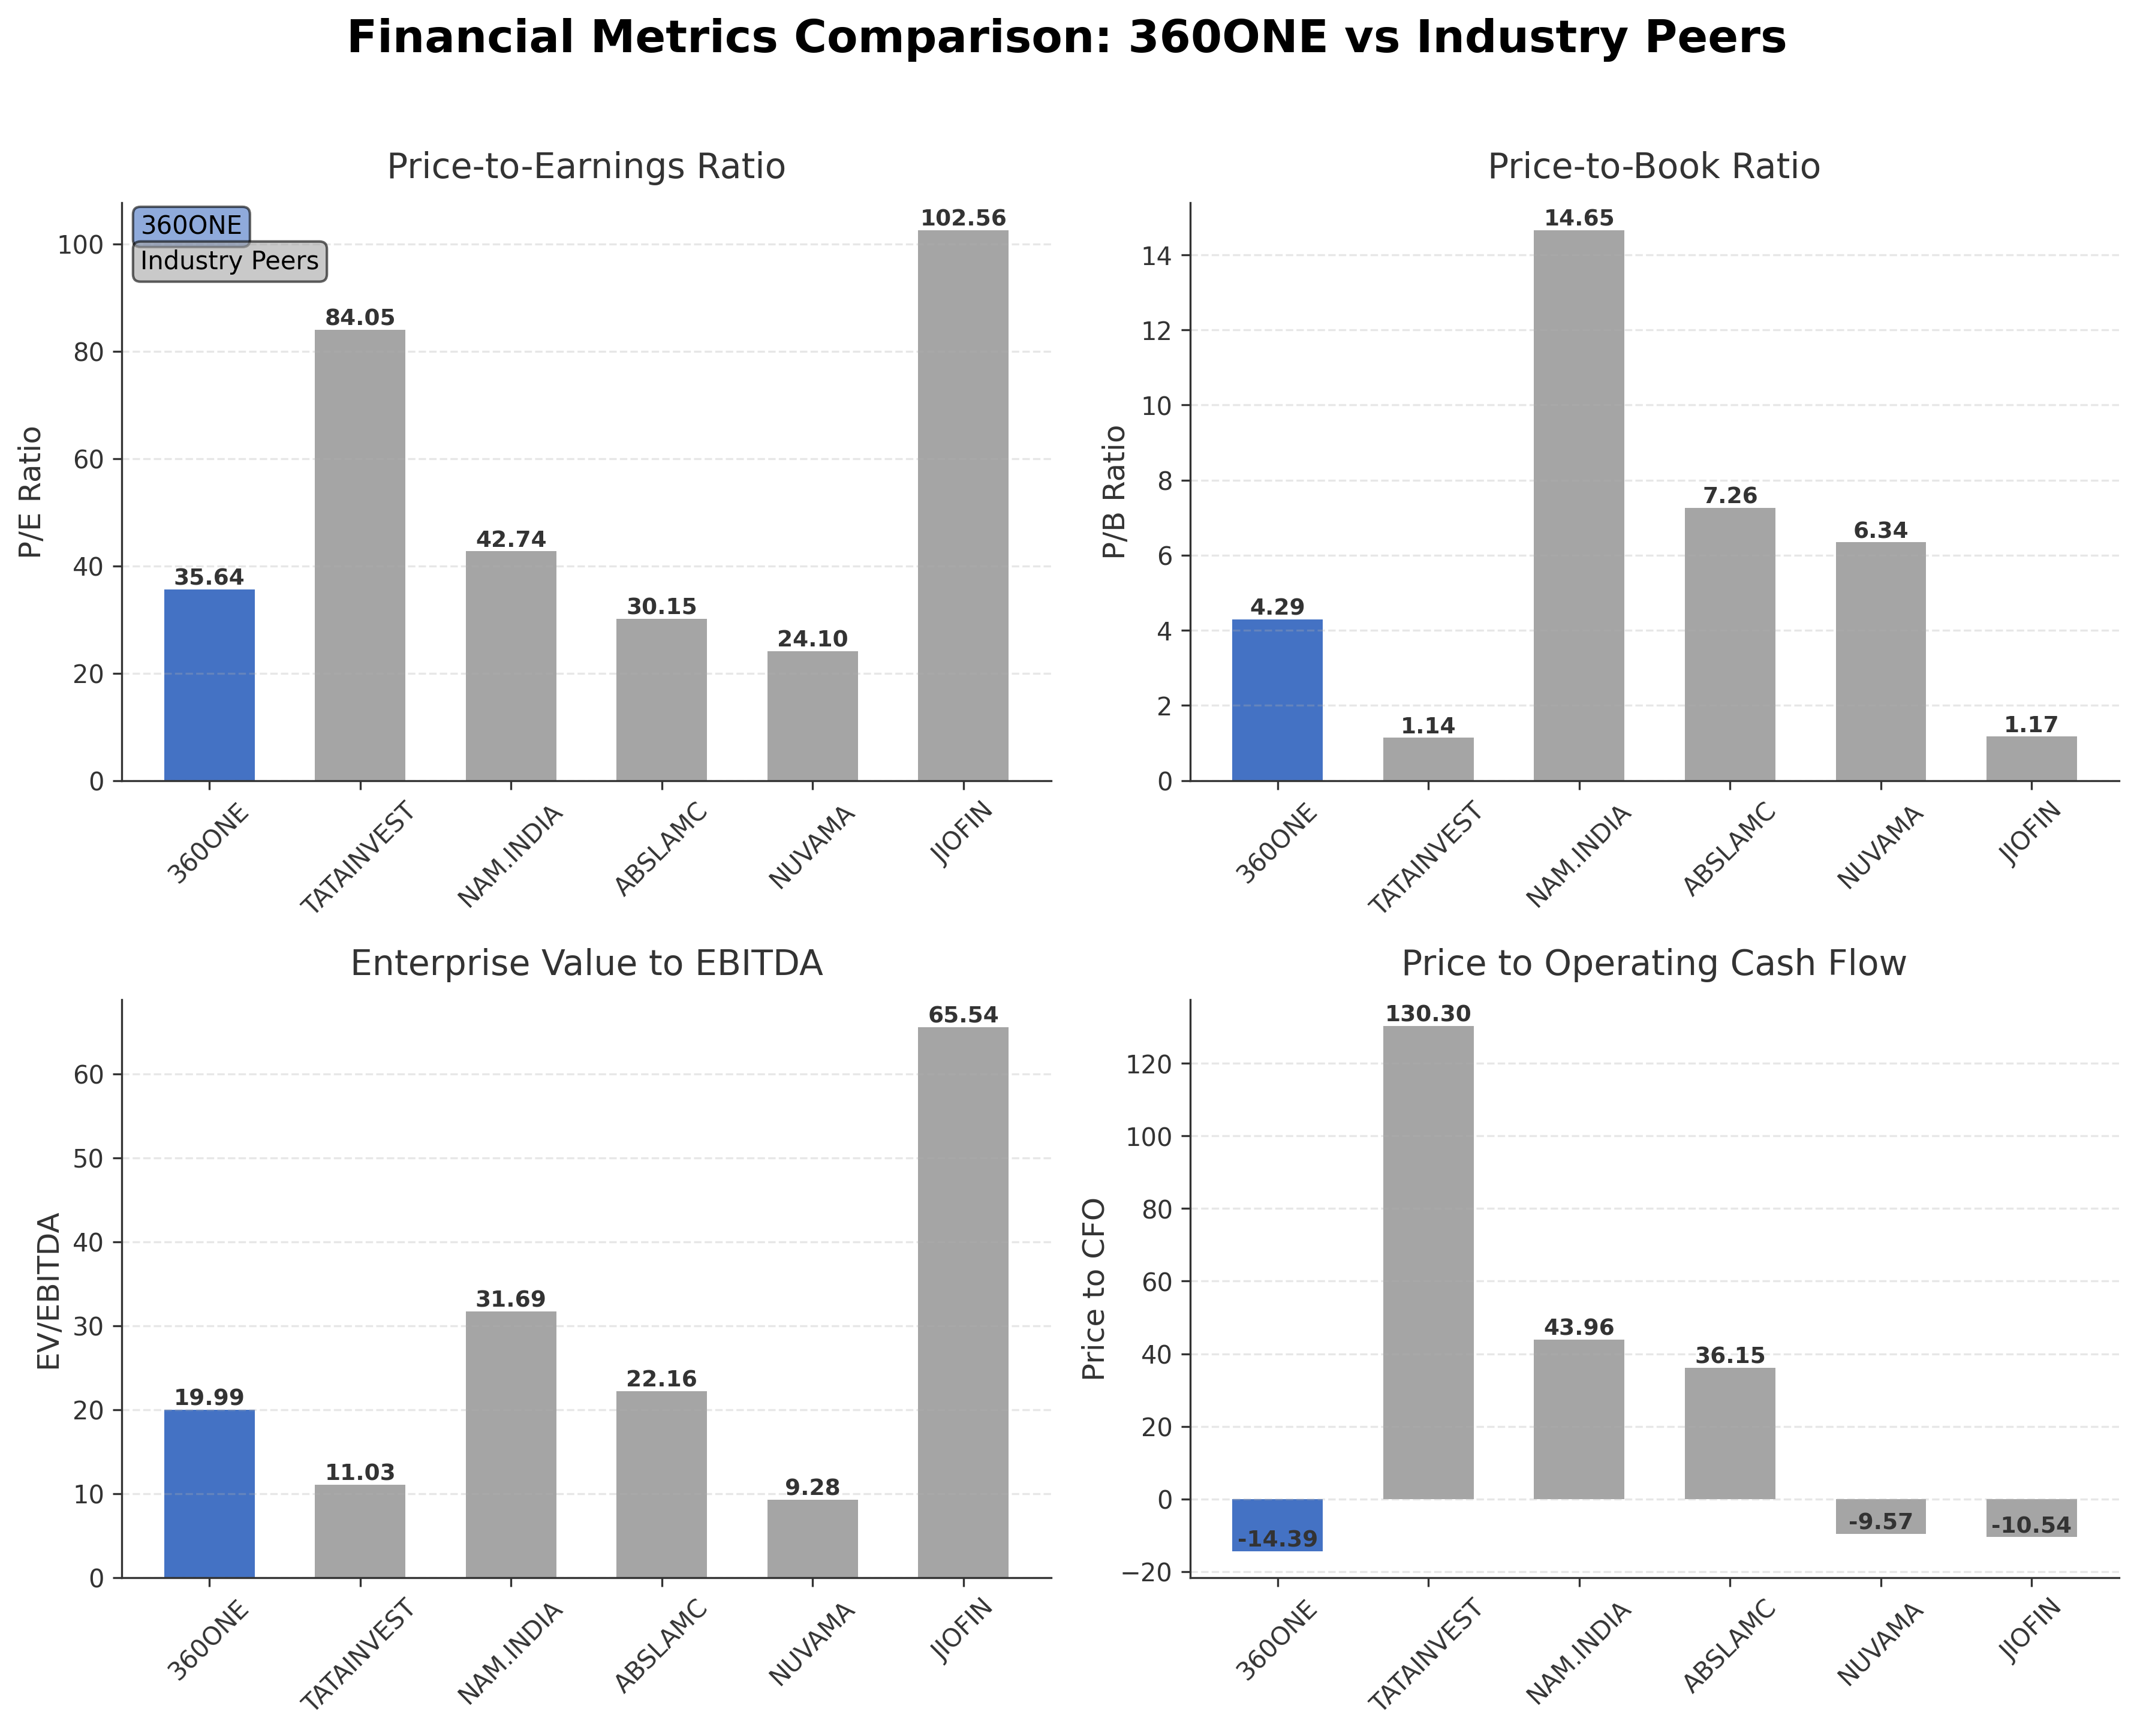
| 360 One Wam Ltd. | ₹420.37B | 35.64 | 4.29 | 19.99 | -14.39 |
| Tata Investment Corporation Limited | ₹364.03B | 84.05 | 1.14 | 11.03 | 130.30 |
| Nippon Life India Asset Management Limited | ₹644.47B | 42.74 | 14.65 | 31.69 | 43.96 |
| Aditya Birla Sun Life AMC Ltd. | ₹293.49B | 30.15 | 7.26 | 22.16 | 36.15 |
| Nuvama Wealth Management Ltd. | ₹241.48B | 24.10 | 6.34 | 9.28 | -9.57 |
| Jio Financial Services Limited | ₹1.63T | 102.56 | 1.17 | 65.54 | -10.54 |
Comparison Analysis: 360 One Wam Ltd. exhibits a moderate valuation profile relative to its peers, with a trailing P/E of 35.64, which is lower than Tata Investment Corporation and Jio Financial Services but higher than Nuvama Wealth Management. Its price-to-book ratio of 4.29 is below Nippon Life India AMC and Aditya Birla Sun Life AMC, indicating a more conservative book valuation. The EV/EBITDA ratio of 19.99 positions it between higher multiples of Nippon Life and lower multiples of Nuvama. The company’s negative price to CFO ratio contrasts with positive ratios for most peers, reflecting unique cash flow dynamics. Return on equity at 14.4% is notably higher than peers, suggesting superior profitability. Overall, 360 One Wam Ltd. maintains competitive financial metrics within the Indian asset management sector.
Financial Metrics Comparison with Peers
Financial Statements
Comprehensive financial data including income, balance sheet, and cash flow metrics
Income Statement
| fiscal_date | 2025-03-31 | 2024-03-31 | 2023-03-31 | 2022-03-31 | 2021-03-31 |
|---|---|---|---|---|---|
| Sales | 26.35B | 20.06B | 16.47B | 14.95B | 11.46B |
| Cost Of Goods | 8.47B | 8.87B | 5.47B | 7.32B | 5.20B |
| Gross Profit | 17.88B | 11.19B | 11.00B | 7.63B | 6.26B |
| Operating Expense Selling General And Administrative | 1.33B | 1.23B | 825.70M | 808.20M | 563.09M |
| Operating Expense Other Operating Expenses | 1.51B | 1.10B | 773.30M | 553.50M | 479.20M |
| Operating Income | 12.83B | 7.37B | 8.35B | 5.26B | 4.08B |
| Non Operating Interest Income | 2.67B | 2.07B | 852.70M | 1.13B | 2.88B |
| Non Operating Interest Expense | 8.78B | 6.34B | 3.92B | 3.63B | 4.06B |
| Pretax Income | 13.47B | 10.09B | 8.50B | 7.51B | 4.85B |
| Income Tax | 3.32B | 2.04B | 1.92B | 1.74B | 1.16B |
| Net Income | 10.15B | 8.04B | 6.58B | 5.78B | 3.69B |
| Eps Basic | 27.14 | 22.48 | 18.51 | 16.35 | 10.56 |
| Eps Diluted | 26.08 | 21.86 | 18.12 | 16.02 | 10.44 |
| Basic Shares Outstanding | 374.03M | 357.67M | 355.45M | 353.30M | 349.71M |
| Diluted Shares Outstanding | 374.03M | 357.67M | 355.45M | 353.30M | 349.71M |
| Ebit | 22.25B | 16.43B | 12.42B | 11.14B | 8.91B |
| Ebitda | 16.13B | 10.01B | 9.66B | 7.26B | 7.44B |
| Net Income Continuous Operations | 13.47B | 10.09B | 8.50B | 7.51B | 4.85B |
| Minority Interests | 0.00 | 0.00 | 400.00K | 0.00 | N/A |
| Preferred Stock Dividends | 0.00 | 0.00 | 0.00 | 0.00 | 0.00 |
Source: Financial statements and regulatory filings
Balance Sheet
| fiscal_date | 2025-03-31 | 2024-03-31 | 2023-03-31 | 2022-03-31 | 2021-12-31 |
|---|---|---|---|---|---|
| Cash And Cash Equivalents | 7.40B | 4.43B | 5.09B | 4.89B | 73.06M |
| Accounts Receivable | 4.43B | 3.28B | 3.03B | 2.68B | 74.52M |
| Total Assets | 197.69B | 151.19B | 111.92B | 107.44B | 795.15M |
| Total Liabilities | 127.04B | 116.69B | 80.66B | 77.21B | 290.35M |
| Long Term Debt | 29.91B | 40.66B | 25.88B | 19.81B | 132.83M |
| Shareholders Equity | 70.65B | 34.50B | 31.26B | 30.24B | 290.93M |
Source: Financial statements and regulatory filings
Cash Flow Statement
| fiscal_date | 2025-03-31 | 2024-03-31 | 2023-03-31 | 2022-03-31 | 2021-03-31 |
|---|---|---|---|---|---|
| Operating Activities Net Income | 13.47B | 10.09B | 8.50B | 7.51B | 4.85B |
| Operating Activities Stock Based Compensation | 1.02B | 498.90M | 249.50M | 303.80M | 454.06M |
| Operating Activities Other Non Cash Items | -2.19B | -1.47B | -1.37B | -901.10M | -1.27B |
| Operating Activities Accounts Receivable | -19.61B | -14.33B | -9.84B | -2.41B | -557.93M |
| Operating Activities Other Assets Liabilities | -8.16B | 6.70B | -3.90B | 7.76B | 2.11B |
| Operating Activities Operating Cash Flow | -15.48B | 1.50B | -6.35B | 12.27B | 5.59B |
| Investing Activities Capital Expenditures | -471.00M | -1.01B | -729.80M | -163.80M | -252.18M |
| Investing Activities Net Acquisitions | -821.10M | -45.10M | -367.80M | 0.00 | -2.26B |
| Investing Activities Purchase Of Investments | -72.99B | -78.05B | -24.46B | -190.02B | -176.27B |
| Investing Activities Sale Of Investments | 63.32B | 63.16B | 33.11B | 178.80B | 219.94B |
| Investing Activities Investing Cash Flow | -10.97B | -15.95B | 7.55B | -11.39B | 41.16B |
| Financing Activities Long Term Debt Issuance | 20.26B | 28.85B | 31.84B | 11.79B | 13.67B |
| Financing Activities Long Term Debt Payments | -19.50B | -16.03B | -27.28B | -17.38B | -32.56B |
| Financing Activities Short Term Debt Issuance | 15.89B | 12.82B | 7.73B | 12.96B | -23.51B |
| Financing Activities Common Stock Issuance | 24.72B | 661.10M | 219.90M | 518.00M | 341.44M |
| Financing Activities Common Dividends | -2.17B | -5.90B | -6.13B | -4.86B | -6.13B |
| Financing Activities Financing Cash Flow | 39.21B | 20.40B | 6.37B | 3.02B | -48.18B |
| End Cash Position | 7.40B | 4.43B | 5.09B | 4.89B | 4.37B |
| Free Cash Flow | -24.66B | -5.72B | -13.96B | 9.12B | 4.37B |
| Financing Activities Common Stock Repurchase | N/A | N/A | N/A | 0.00 | -70.00K |
| Financing Activities Other Financing Charges | N/A | N/A | N/A | 10.00K | 610.00K |
| Investing Activities Other Investing Activity | N/A | N/A | N/A | N/A | 5.38M |
Source: Financial statements and regulatory filings
Technical Analysis
Key Insights
- Current trend shows a consolidation phase with price hovering near ₹1,073, above the 50-day moving average (₹1,038) but below the 200-day moving average (₹1,092), indicating mixed momentum.
- Key support levels are identified near ₹1,037 (50-day MA) and ₹883 (52-week low), while resistance is observed around ₹1,274 (52-week high) and ₹1,092 (200-day MA).
- The stock is trading above the 10-day and 50-day moving averages, suggesting short-term bullishness, but remains below the 200-day moving average, indicating longer-term resistance.
- Momentum indicators show RSI in a neutral range, MACD signals a potential bullish crossover, and stochastic oscillators indicate moderate upward momentum.
- Multi-timeframe analysis reveals daily charts showing sideways movement, weekly charts indicating consolidation, and monthly charts reflecting a long-term uptrend.
- Potential market scenarios include a breakout above the 200-day moving average leading to renewed upward momentum or a retracement to the 50-day moving average support level if selling pressure increases.
Trending News
1. Headline: 360 ONE WAM Ltd is Rated Sell
Summary: 360 ONE WAM Ltd is rated 'Sell' by MarketsMOJO, with this rating last updated on 22 Apr 2026. However, the analysis and financial metrics discussed here reflect the stock's current position as of 04 May 2026, providing investors with an up-to-date view of the company’s fundamentals, valuation, ...
Sentiment: neutral
Summary: The shares of Value Communications IPO are commanding a premium of ₹0 in the grey market. This means that the GMP of Value Communications IPO is +0.
Sentiment: neutral
3. Headline: 360 ONE: How Is the Company Creating a More Stable Revenue Stream?
Summary: With a market cap of Rs 42,800 crore, the shares of 360 ONE WAM Ltd are trading at Rs 1,055 and are trading at a PE of 35 compared to their industry’s PE of 18.5. The shares have given a return of more than 12% in the last year. Financial Year FY26 saw turbulence in both international and domestic markets, with stock ...
Sentiment: positive
4. Headline: 360 ONE WAM Limited Files Revised Promoter Encumbrance Disclosure for Kush and Kyra Bhagat
Summary: 360 ONE WAM Limited filed a revised disclosure with BSE Limited on April 30, 2026, correcting encumbrance details for promoter group members Kush Bhagat and Kyra Bhagat. The revision changed their 'Promoter Holding Already Encumbered' status to 'nil' as suggested by the exchange.
Sentiment: neutral
5. Headline: 360 ONE WAM LIMITED Issues Clarification on Promoter Shares
Summary: 360 ONE WAM LIMITED issues a revised disclosure clarifying that the encumbrance status for promoter group members Kush and Kyra Bhagat is nil. Read more here.
Sentiment: neutral
Recent Updates
News Summary
As of April 30, 2026. 360 ONE WAM Limited completed the acquisition of Quark Solar Private Limited on April 30, 2026, through its subsidiary 360 ONE Alternates Asset Management Limited, integrating Quark Solar as a wholly owned step-down subsidiary. This acquisition enhances the company's alternative asset management portfolio and complies with SEBI regulations. On April 22, 2026, the company allotted 156,782 equity shares to employees via ESOP exercise, increasing its paid-up share capital and reflecting employee engagement in the company's growth. Additionally, 360 ONE WAM raised its transaction and brokerage revenue guidance to ₹160-180 crore per quarter, despite mark-to-market losses of ₹55 crore impacting profits. The company targets 20-25% AUM growth and 15-25% profit growth annually, supported by fresh inflows and diversified revenue streams. A revised promoter encumbrance disclosure filed on April 30 clarified that promoter group members Kush and Kyra Bhagat hold shares with nil encumbrance, ensuring regulatory compliance.
News Sentiment
The overall sentiment from recent updates is mixed to positive. The acquisition of Quark Solar and the raised revenue guidance indicate strategic expansion and operational confidence. The ESOP allotment signals strong internal alignment and employee participation. However, mark-to-market losses have negatively impacted profits, tempering the positive outlook. Regulatory compliance actions regarding promoter disclosures reinforce governance standards. Collectively, these developments suggest a company actively managing growth and risks within a dynamic market environment.
Source List
- https://scanx.trade/stock-market-news/companies/360-one-wam-limited-completes-acquisition-of-quark-solar-private-limited/39107426
- https://www.cnbctv18.com/market/360-one-wam-share-price-raises-transaction-broking-revenue-guidance-but-mtm-losses-hit-aum-profit-ws-l-19890888.htm
- https://scanx.trade/stock-market-news/companies/360-one-wam-limited-allots-1-57-lakh-equity-shares-through-employee-stock-option-exercise/38446919
- https://scanx.trade/stock-market-news/companies/360-one-wam-limited-files-revised-promoter-encumbrance-disclosure-for-kush-and-kyra-bhagat/39246996
Analytical Overview
Analysis Summary
The company’s valuation metrics, including a trailing P/E of 35.64 and forward P/E of 24.99, are moderately above the industry average of 35.64, indicating a premium valuation relative to peers. Revenue growth of 26.9% quarter-over-quarter and positive earnings growth of 15.7% year-over-year demonstrate a solid growth trajectory supported by diversified revenue streams. Financial health shows a high debt-to-equity ratio of 161.98, which is a concern, but strong cash reserves and a current ratio of 13.0 mitigate liquidity risks. Sector-specific opportunities include expanding alternative asset management and increasing brokerage revenues, while challenges involve market volatility and regulatory compliance. India-specific factors such as evolving regulatory frameworks and growing wealth management demand influence the company’s positioning and growth prospects.
Overall Business and Market Assessment
Supporting Factors: robust revenue and earnings growth, strategic acquisitions enhancing the asset management portfolio, and strong institutional ownership promoting governance
Risk Factors: the elevated leverage levels and mark-to-market losses impacting profitability
SWOT Analysis
Strengths
- Strong revenue growth of 26.9% quarter-over-quarter.
- Robust profitability with a net profit margin of 27.2%.
- High institutional ownership at 75.48% supporting governance.
- Diversified asset management portfolio including alternative assets.
Weaknesses
- High debt-to-equity ratio of 161.98 indicating significant leverage.
- Negative operating cash flow despite positive free cash flow.
- Price to CFO ratio is negative, reflecting cash flow challenges.
- Stock trades at a premium valuation compared to some peers.
Opportunities
- Expansion through acquisitions such as Quark Solar Private Limited.
- Growing demand for wealth and asset management in India.
- Increasing transaction and brokerage revenue guidance.
- Potential to monetize alternative investment funds and digital platforms.
Threats
- Market volatility causing mark-to-market losses impacting profits.
- Regulatory scrutiny on promoter share encumbrances and disclosures.
- Competitive pressures from established asset management firms.
- Economic uncertainties affecting asset under management growth.
Company Description
360 One Wam Ltd. is a prominent financial services company engaged in offering an array of wealth and asset management solutions. At its core, the company strives to meet the diverse investment needs of high-net-worth individuals and institutional clients. Playing a vital role in financial markets, 360 One Wam Ltd. specializes in portfolio management, investment advisory, and comprehensive wealth planning. It extends its influence across various sectors, including real estate, equity investments, fixed income, and alternative assets. As a multifaceted player in the financial arena, 360 One Wam Ltd. leverages its expertise to cater to the dynamic economic environment, delivering tailored investment strategies and innovative solutions. Through a strategic blend of research-driven insights and client-centric services, the company significantly impacts capital market dynamics and contributes to the broader financial ecosystem, offering clients enhanced value and robust wealth solutions.