
360 One Wam Ltd (360ONE)
Stock Analysis Report
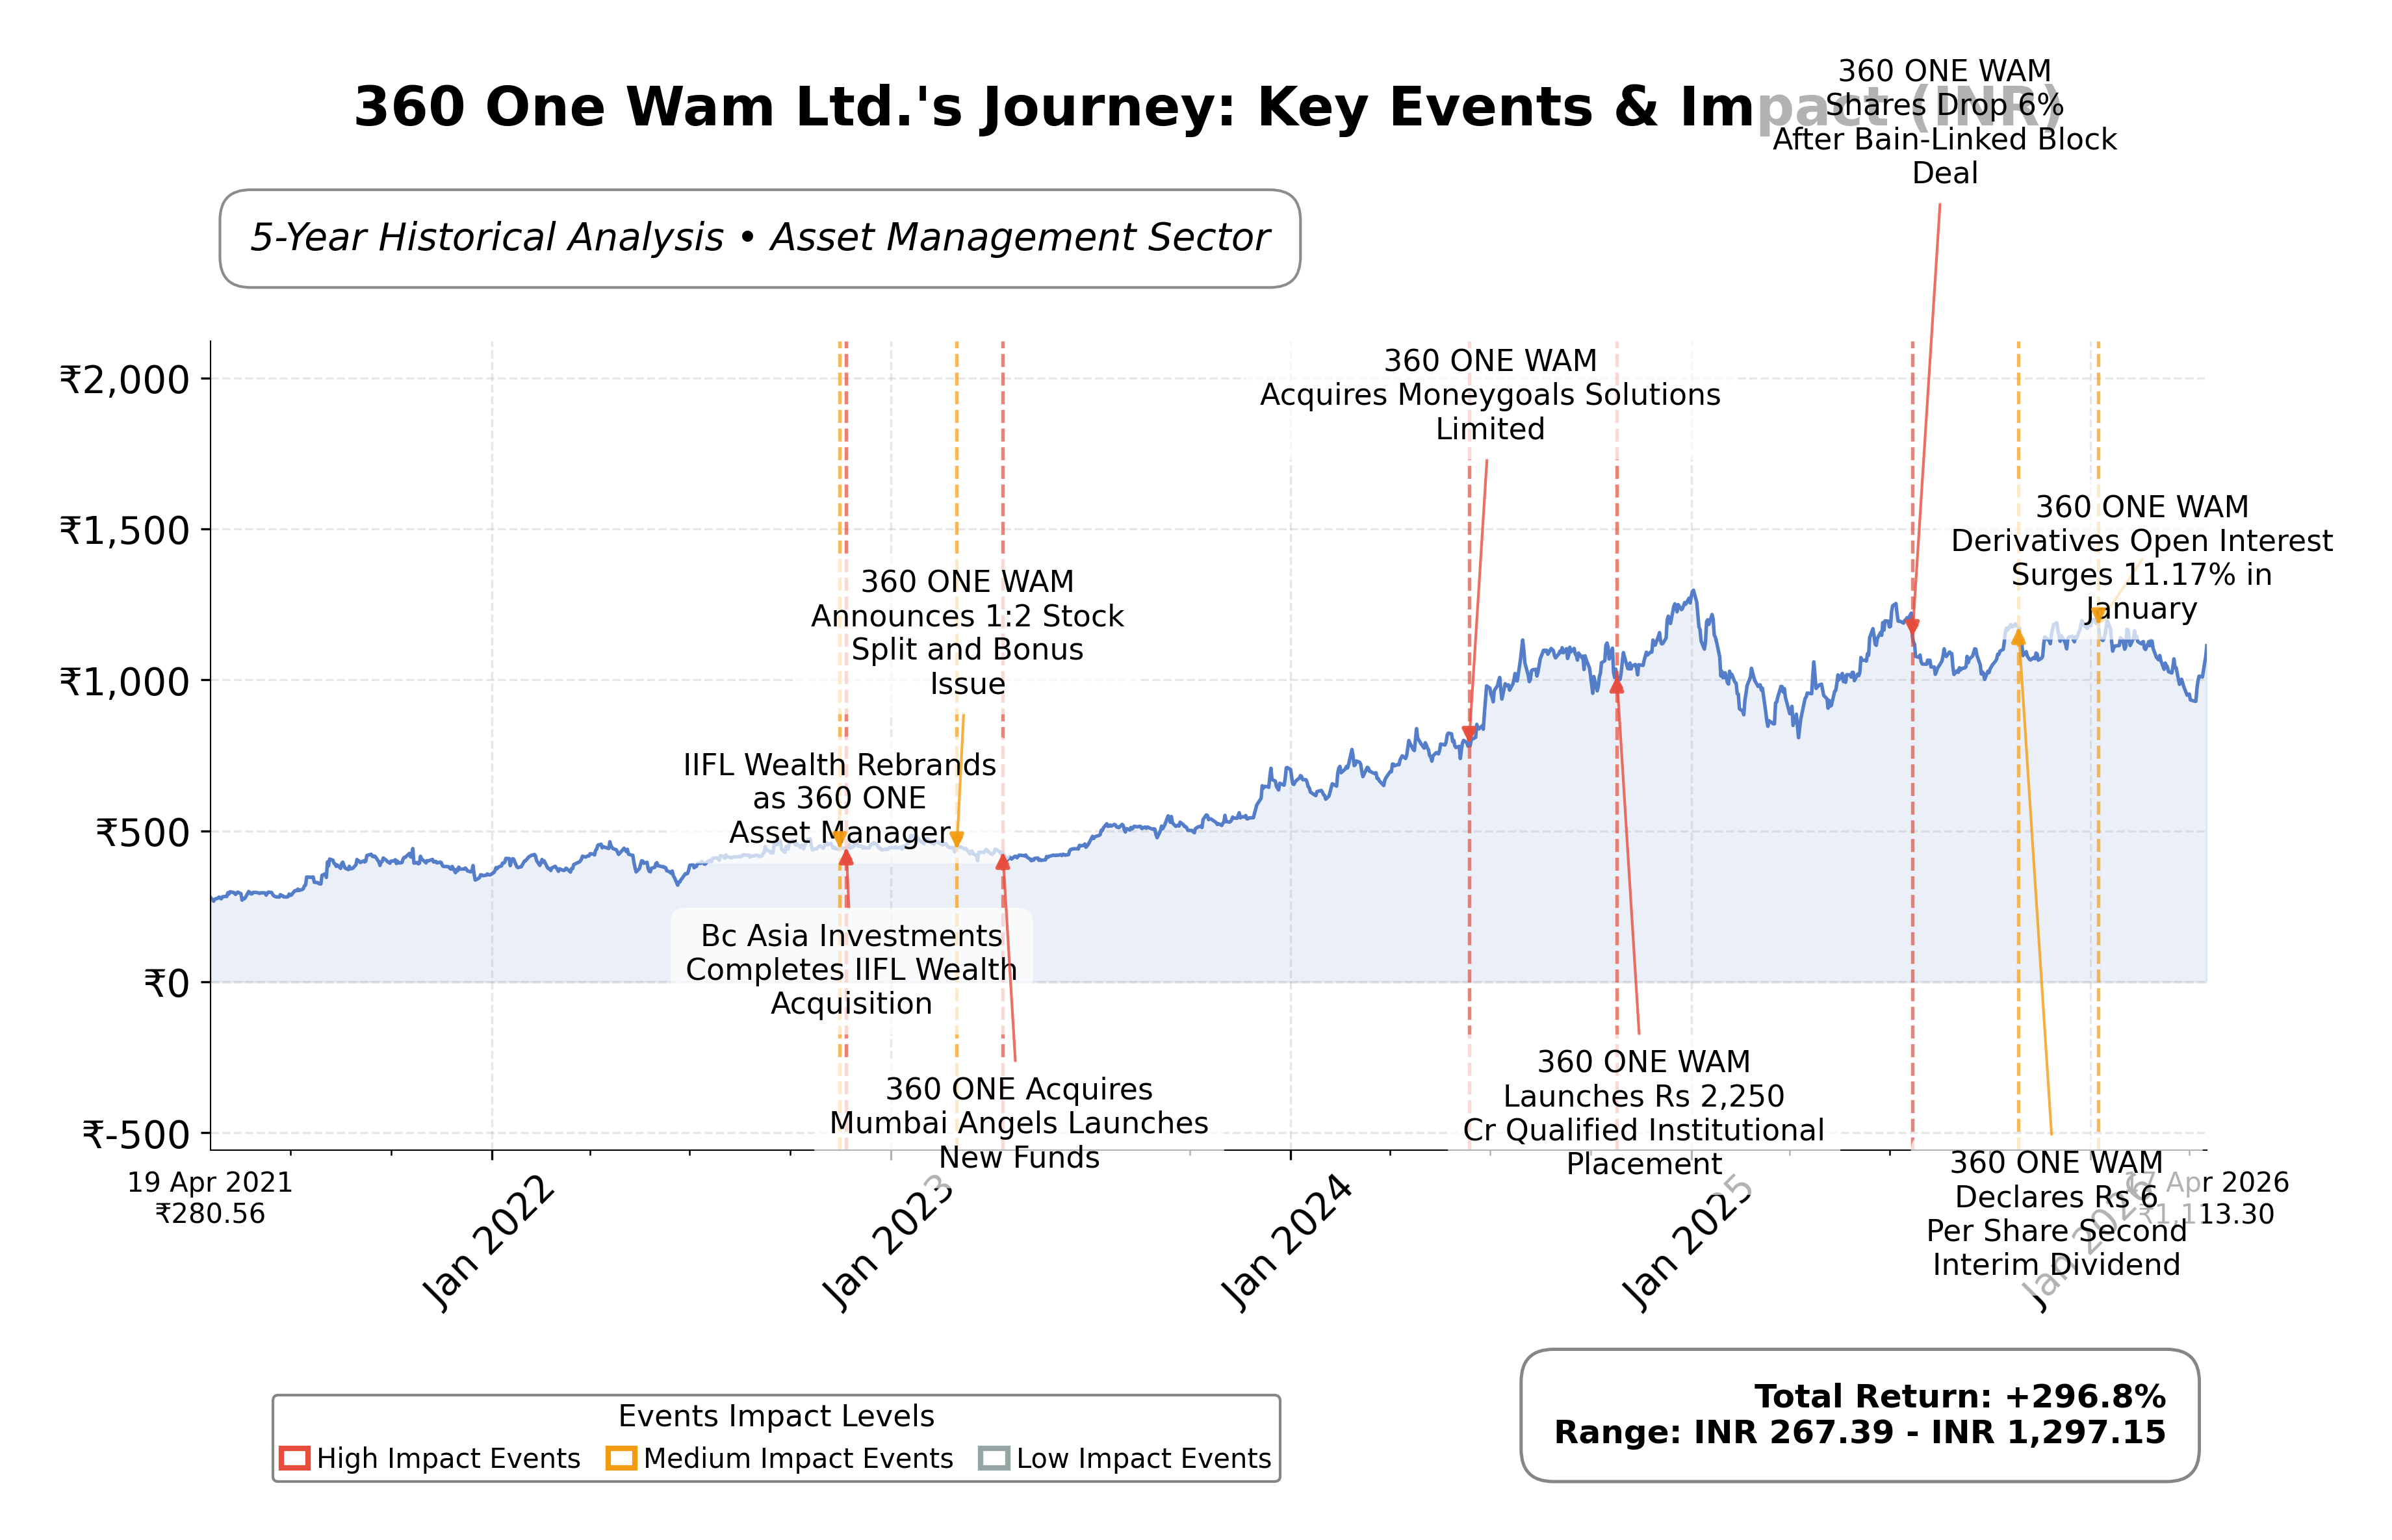
Stock Journey
Key Positives and Key Risks
Pros
- Revenue growth of 30.6% quarterly indicates strong business expansion and market demand.
- Return on equity of 14.37% reflects efficient use of shareholder capital and profitability.
- Forward dividend yield of 2.16% provides consistent income to shareholders.
Cons
- High debt-to-equity ratio of 147.24 signals elevated financial leverage and potential risk.
- Negative operating cash flow of ₹-15.48 billion raises concerns about operational cash generation.
- Negative price to CFO ratio (-29.22) suggests challenges in cash flow management.
Disclosure: This information is for general awareness and does not constitute investment advice
Report Summary
360 One Wam Ltd. operates as a leading financial services company specializing in wealth and asset management solutions. Listed on the NSE in India under the Financial Services sector, the company serves high-net-worth individuals and institutional clients with portfolio management, investment advisory, and wealth planning services. Its business spans multiple asset classes including real estate, equities, fixed income, and alternative investments, positioning it as a multifaceted player in the asset management industry.
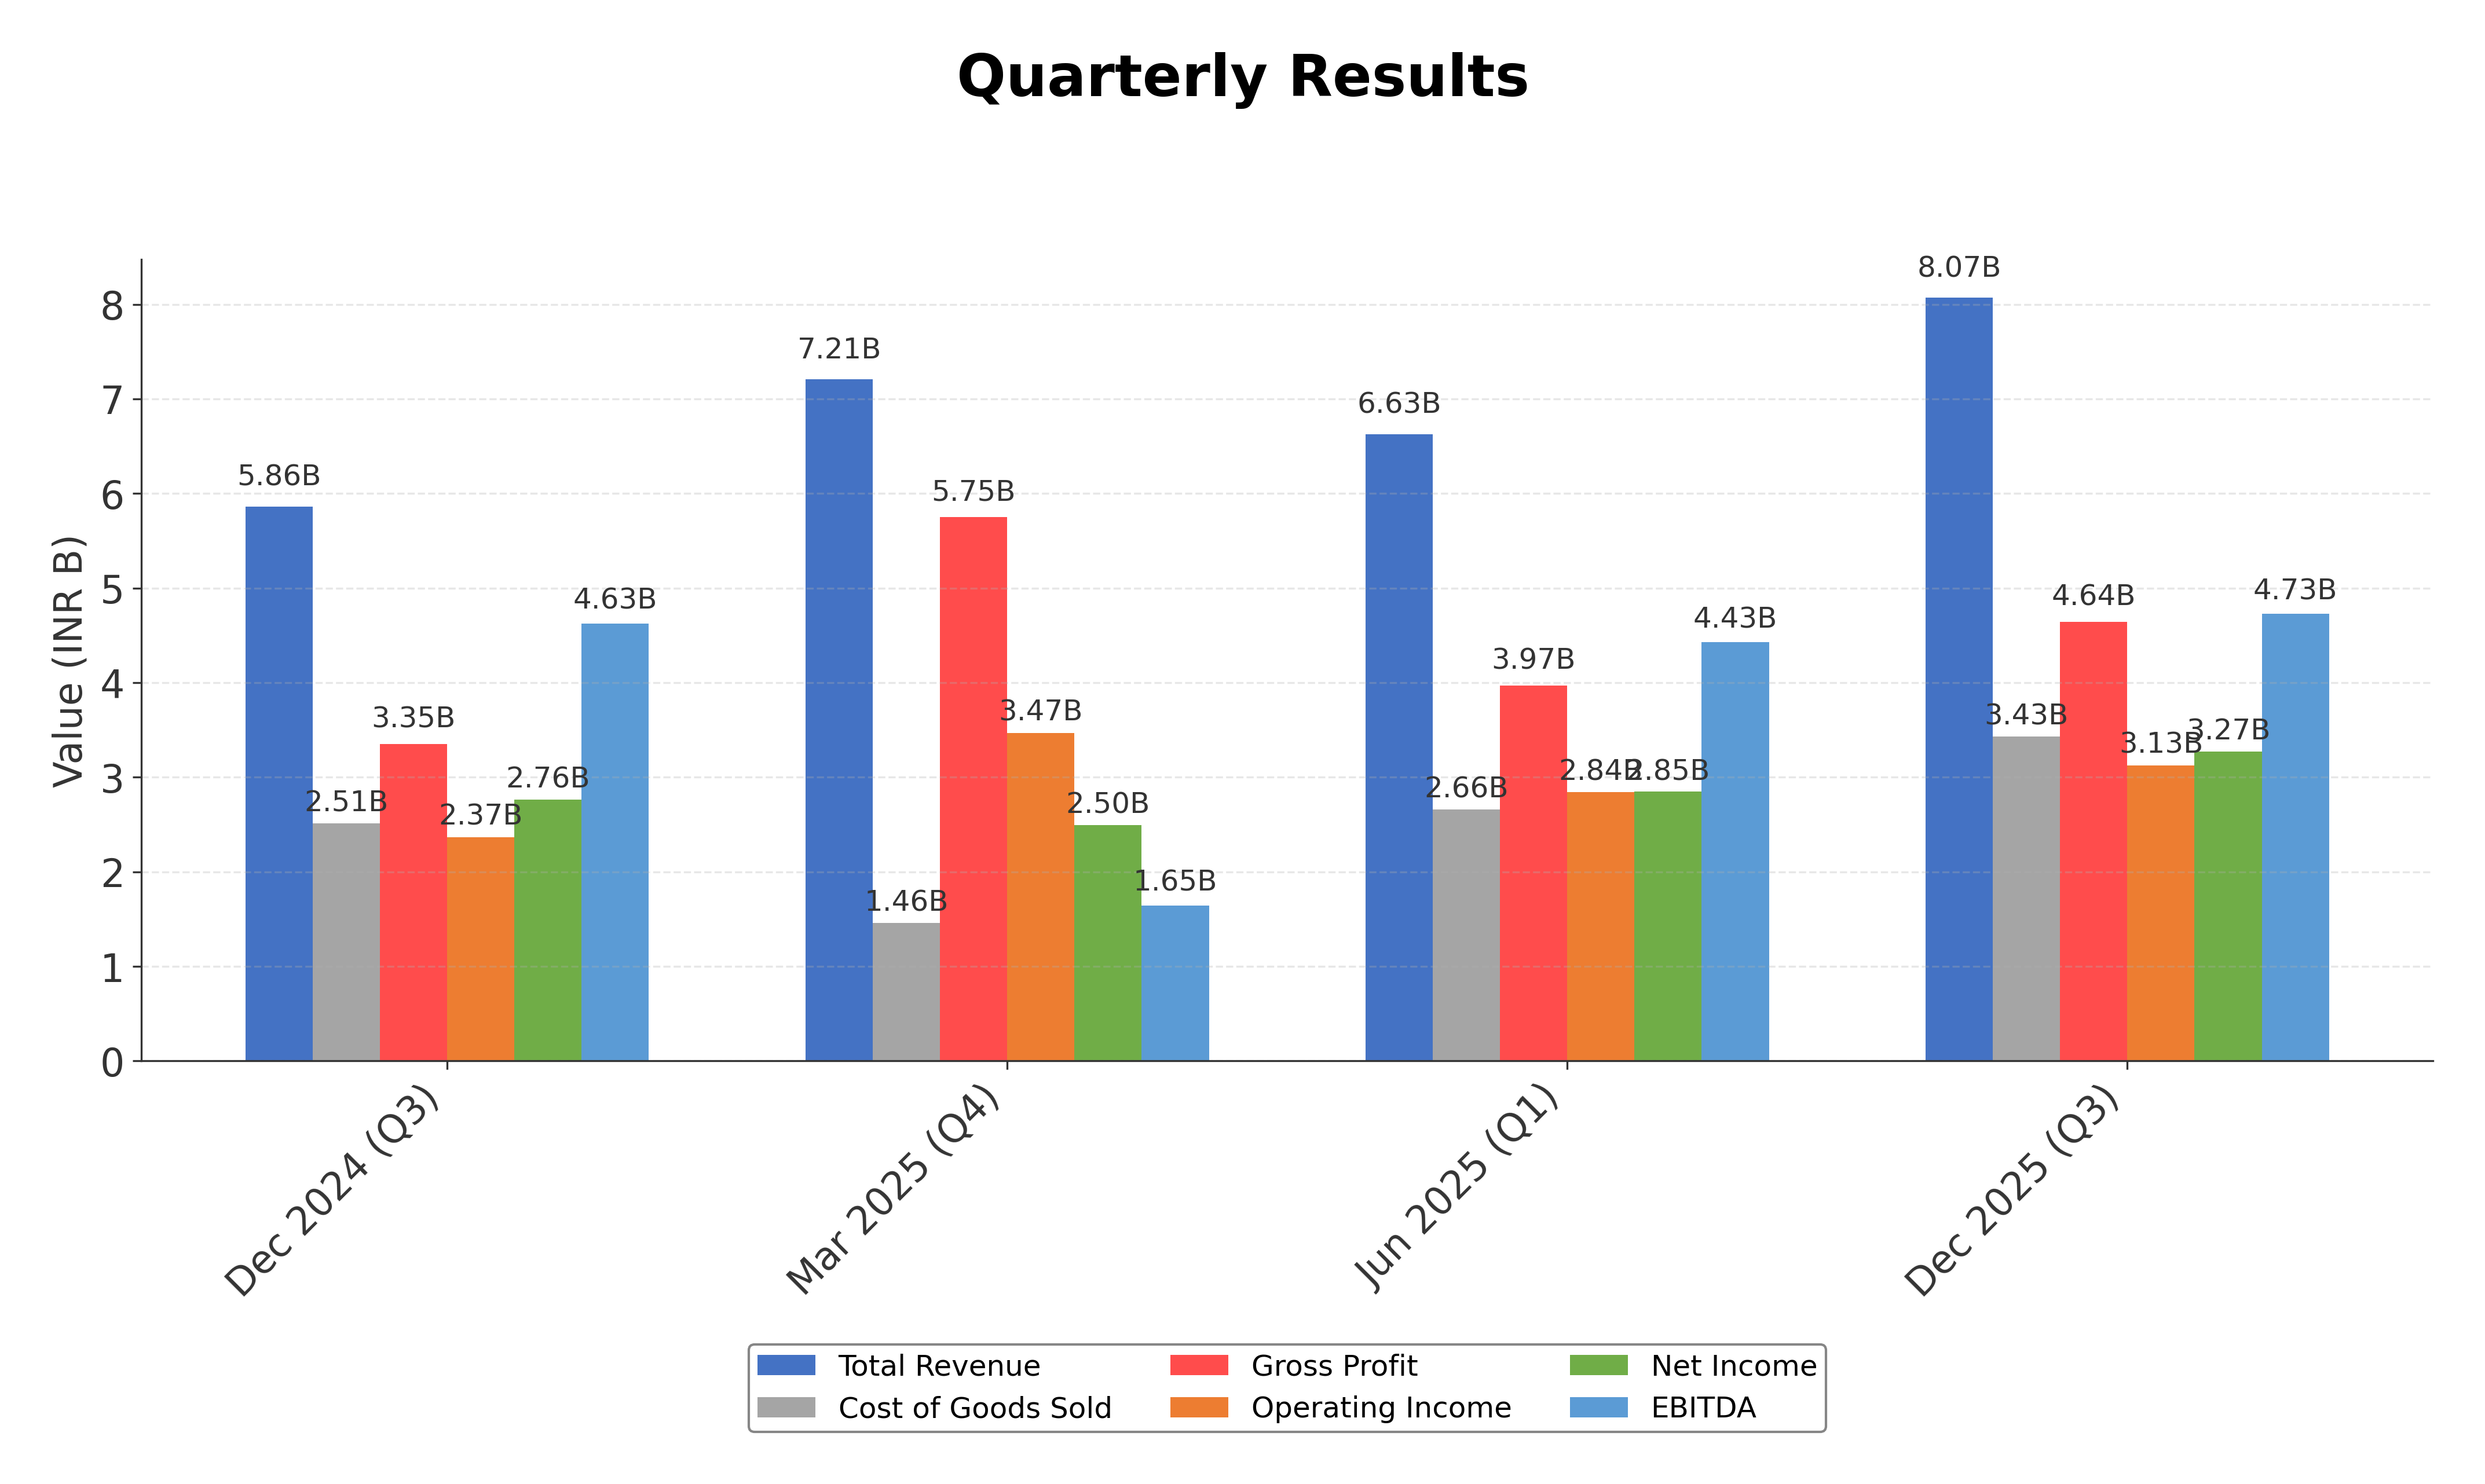
The company reported trailing twelve months (TTM) revenue of approximately ₹42.29 billion with a strong gross margin of 57.51%, operating margin of 59.26%, and net profit margin of 27.83%. Return on equity (ROE) stands at 14.37% and return on assets (ROA) at 5.14%, reflecting solid profitability and efficient asset utilization. The company’s operating cash flow is negative at ₹-15.48 billion, but levered free cash flow remains positive at ₹10.15 billion, indicating nuanced cash dynamics.
Valuation metrics show a trailing P/E ratio of 39.06 and a forward P/E of 31.74, with a price-to-book ratio of 4.82 and an EV/EBITDA multiple of 22.01. The market capitalization is ₹452.15 billion, with the stock currently trading at ₹1,111 within a 52-week range of ₹882.60 to ₹1,273.80. These figures suggest the stock is valued at a premium relative to some peers, reflecting growth expectations and market positioning.
Key strengths include a strong institutional ownership of approximately 75.48%, a recent strategic consolidation of its asset management businesses to enhance market focus, and a robust dividend yield of 2.16% forward. Risks involve a high debt-to-equity ratio of 147.24, regulatory and competitive pressures in the financial services sector, and recent share dilution impacting shareholder stakes. The company’s leadership is actively managing capital allocation, as evidenced by upcoming board decisions on FY26 results and dividends.
Technical indicators reveal positive momentum with RSI rising to 58.06 and recent price surges outperforming sector benchmarks. The stock trades above its 50-day moving average but below the 200-day average, suggesting mixed trend signals. Overall, the data portrays a company in transition with favorable operational developments and market interest, warranting close observation for evolving opportunities and risks.
Company and Industry Overview
Company Basics
Price Performance
Company Size
Shareholding Pattern
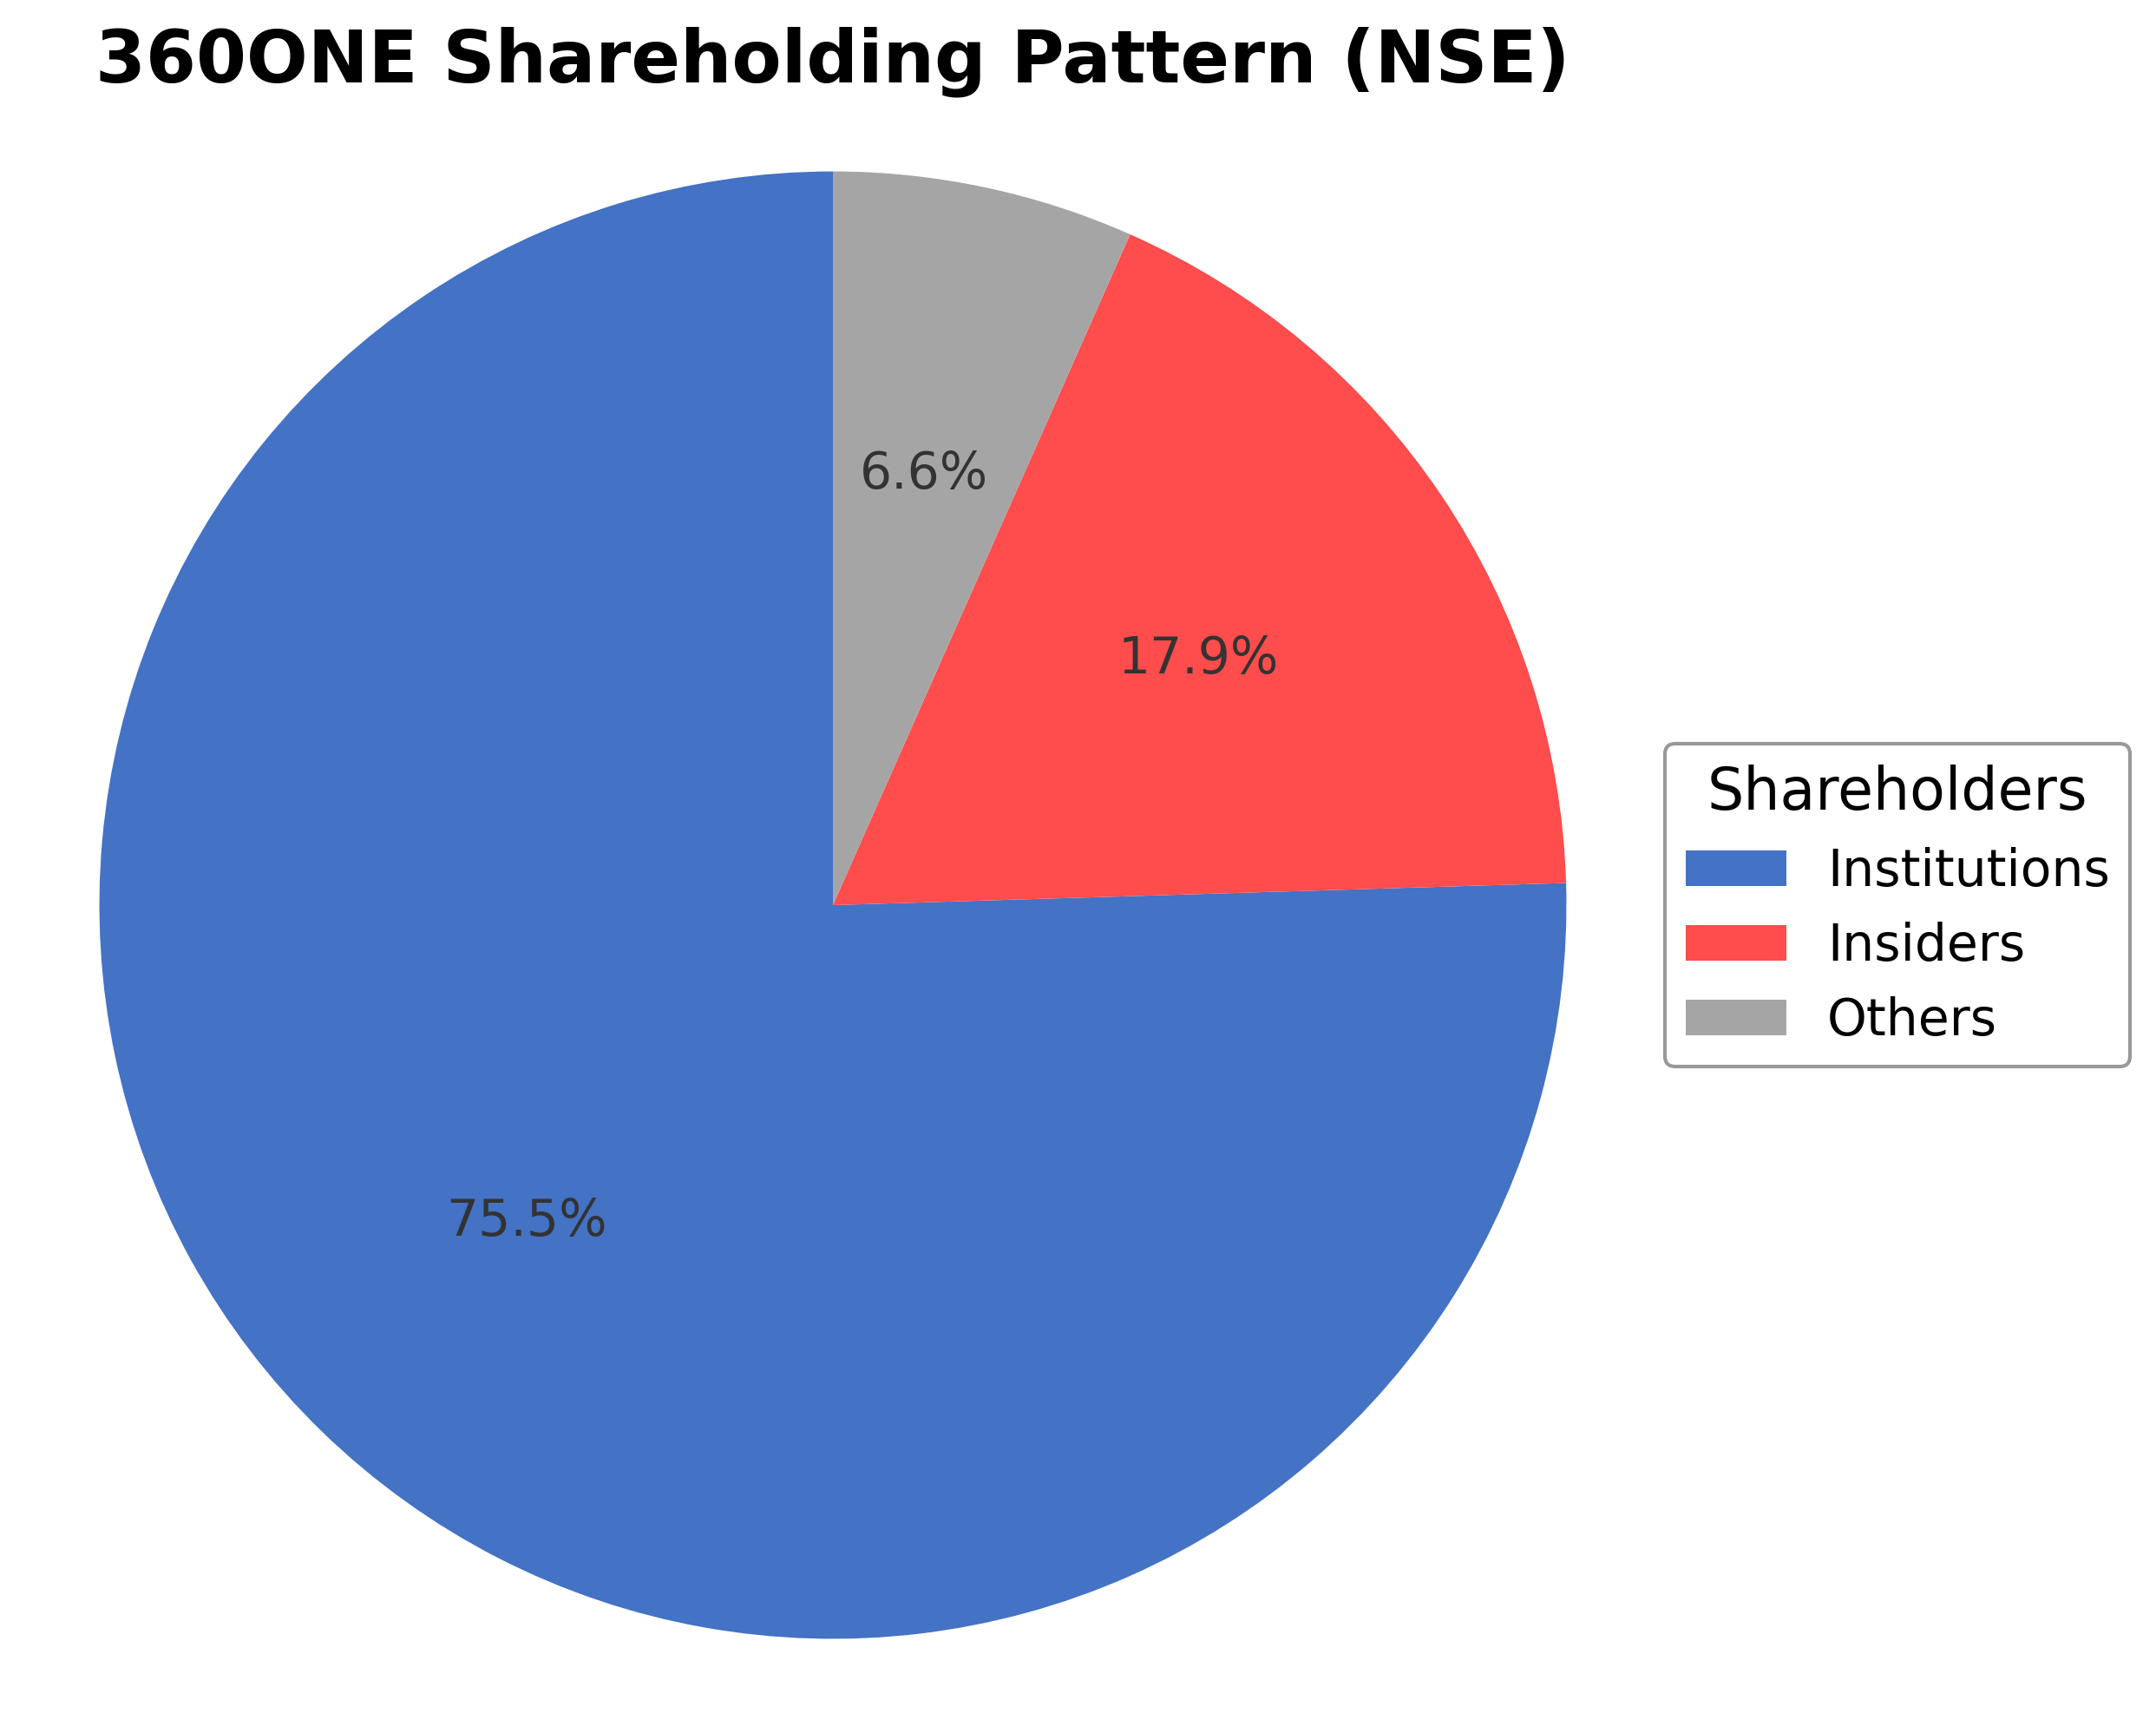
The ownership structure of 360 One Wam Ltd. is characterized by a dominant institutional investor presence holding approximately 75.48% of shares, complemented by insiders controlling 17.88% and public shareholders accounting for 24.37%. Over the past 12 to 24 months, institutional investors have maintained a strong accumulation trend, while notable shareholders such as Capital Income Builder have recently reduced their stake to 3.11% amid share dilution. This evolving shareholding pattern reflects active portfolio rebalancing and highlights a governance framework influenced significantly by institutional stakeholders. The concentration of ownership suggests focused strategic oversight and potential for coordinated corporate actions, while public and insider holdings provide a balanced shareholder base within the Indian asset management sector.
Sector and Industry Analysis
360 One Wam Ltd. operates within the broader financial services sector, which encompasses banking, investment management, insurance, and related activities. This sector is substantial globally, with consistent growth driven by increasing demand for wealth management, digital financial solutions, and expanding middle-class populations. Key players include multinational banks, asset managers, and insurance firms that dominate market share and influence sector trends.
Within the financial services industry, there is a marked shift toward digital transformation, including fintech innovations and automated advisory services. Competitive dynamics are shaped by technology adoption, customer experience, and regulatory compliance costs, which create moderate barriers to entry for new firms. Established companies leverage scale and brand reputation, while emerging players focus on niche markets or technology-driven solutions to gain footholds.
The regulatory environment for financial services is complex and evolving, with stringent requirements on capital adequacy, consumer protection, and anti-money laundering. Regulations such as Basel III and data privacy laws impact operational costs and strategic planning. Ongoing regulatory scrutiny aims to enhance market stability and transparency, influencing how firms manage risk and innovate within the sector.
Note: Analysis synthesized from industry research, market reports, and regulatory filings. Information is subject to change based on market conditions.
Financial Ratios Dashboard
Illustrative Scenario Analysis
DCF Assumptions:
Method: Two-Stage EPS-Priority Model
Financials
Peer Analysis
| Company Name | Market Cap | P/E Ratio | P/B Ratio | EV/EBITDA | Price to CFO |
|---|---|---|---|---|---|
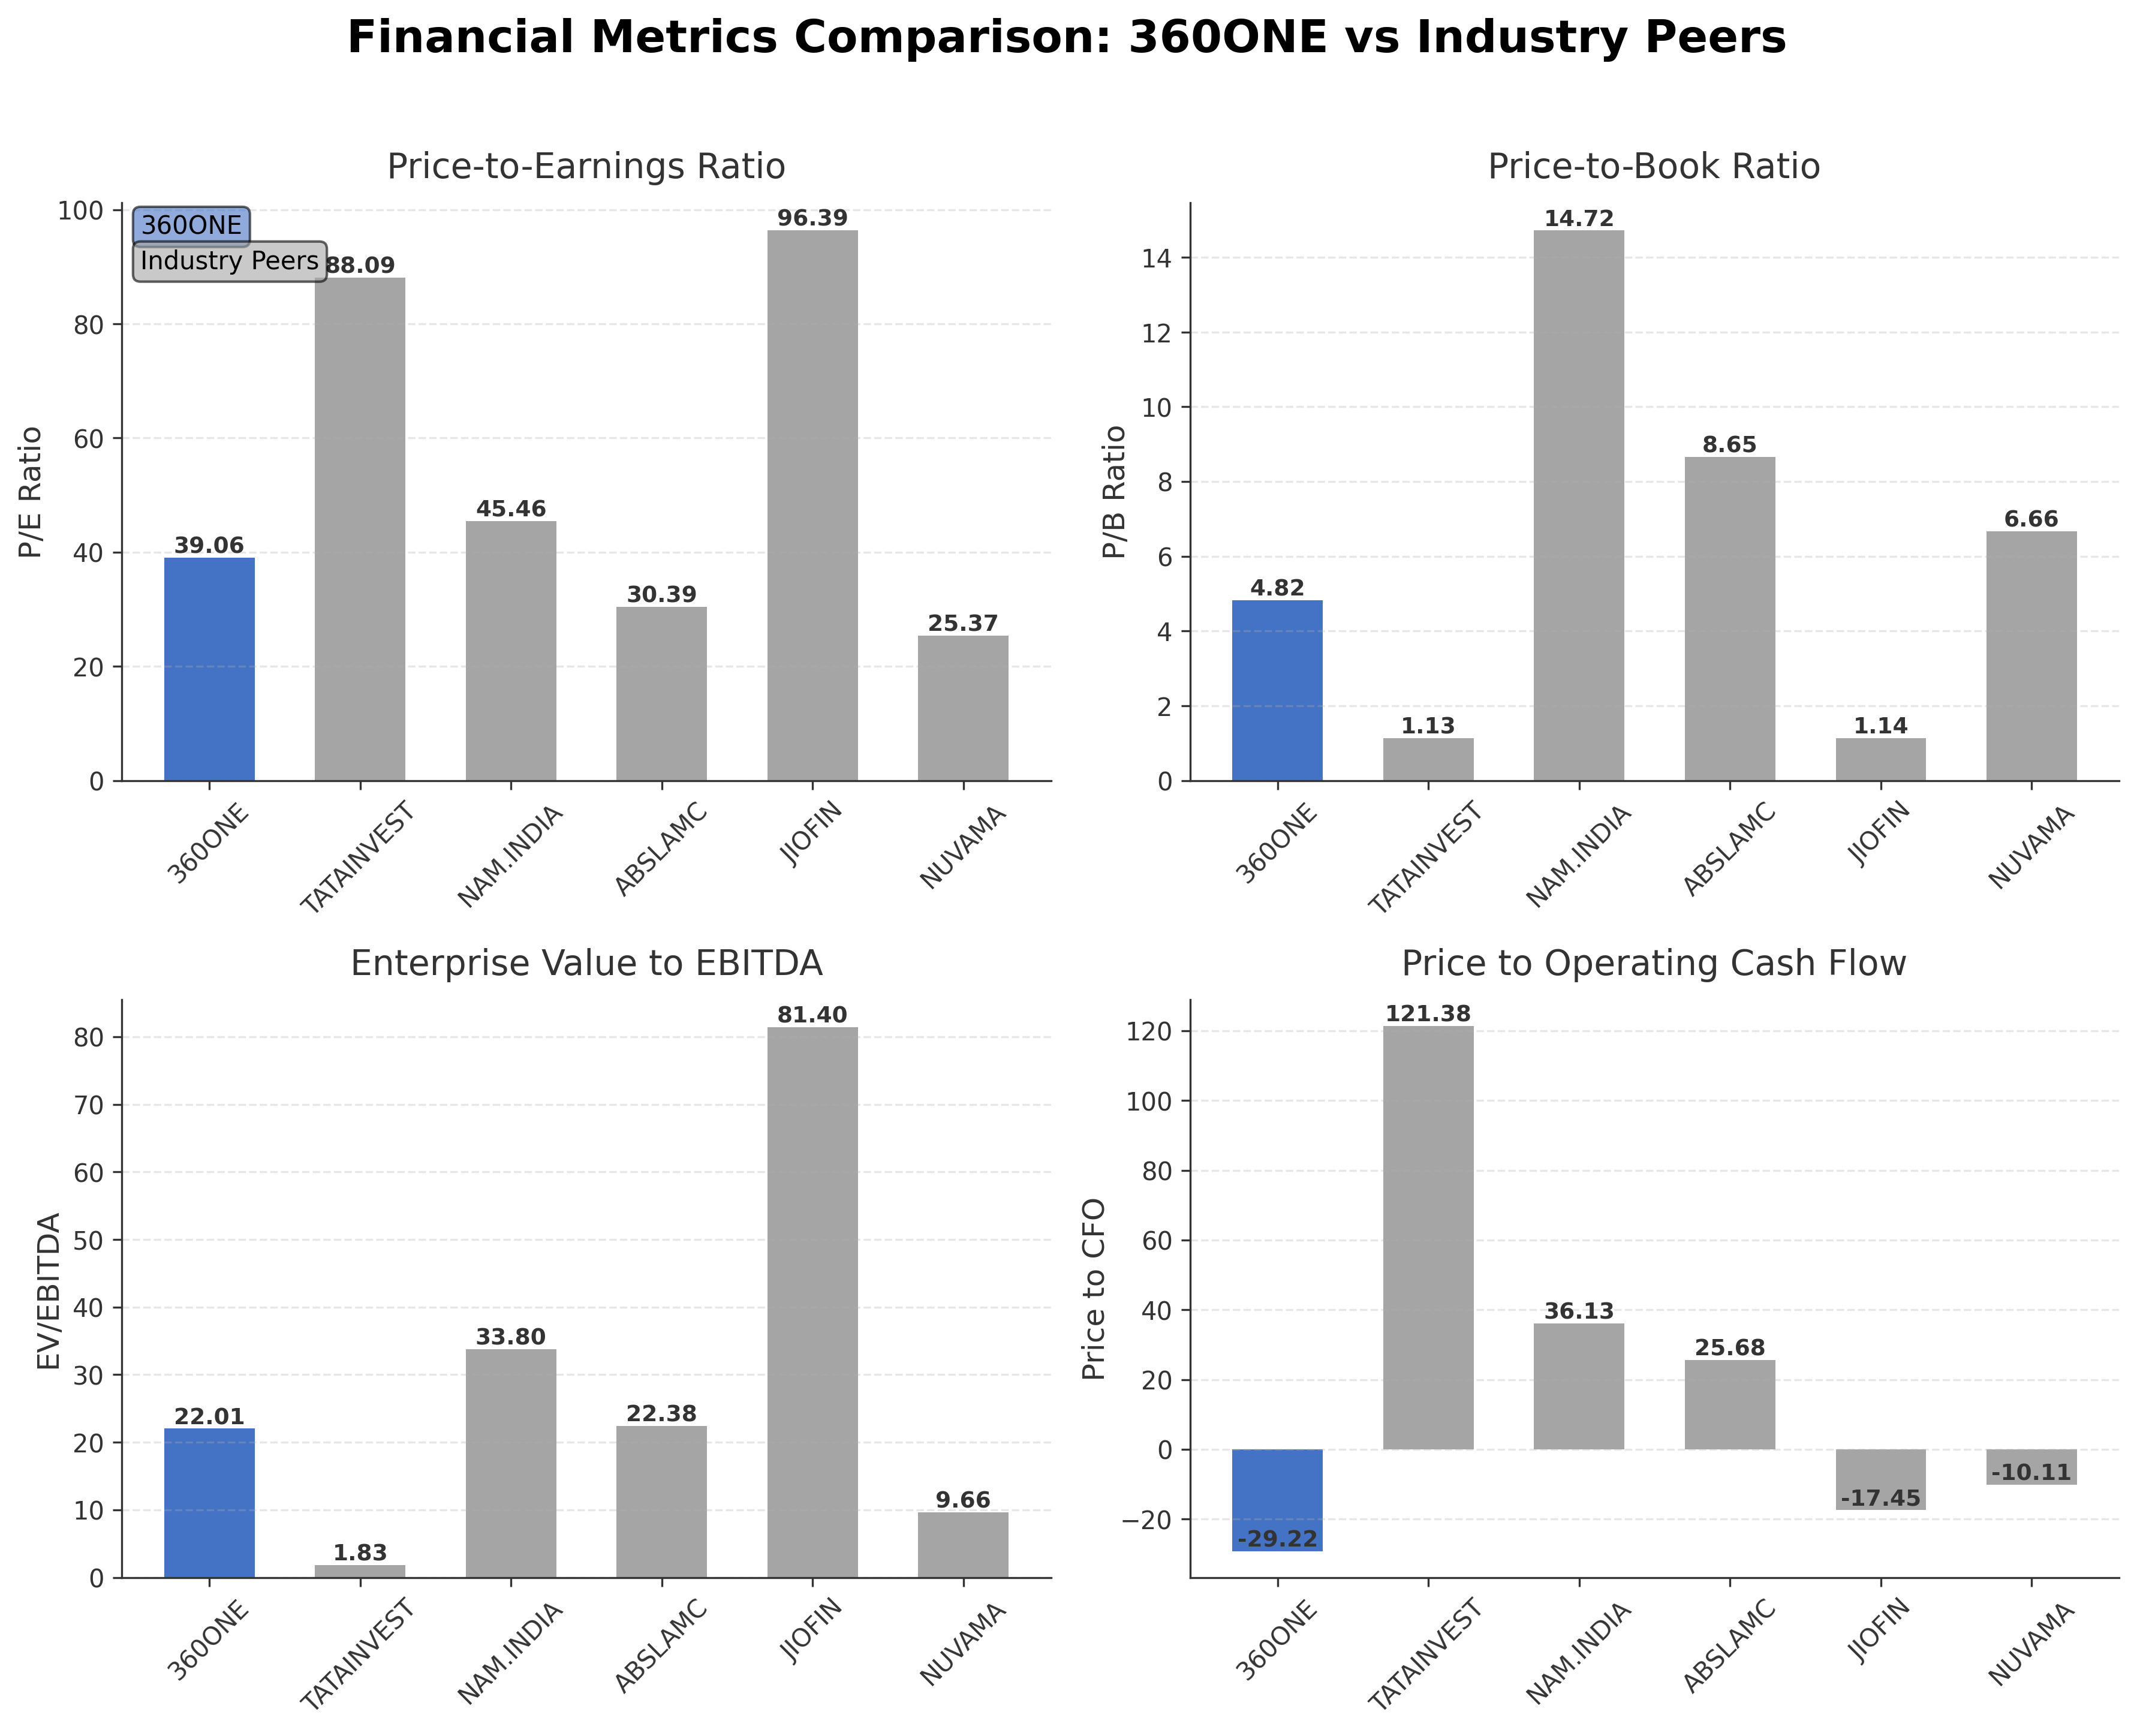
| 360 One Wam Ltd. | ₹452.15B | 39.06 | 4.82 | 22.01 | -29.22 |
| Tata Investment Corporation Limited | ₹360.57B | 88.09 | 1.13 | 1.83 | 121.38 |
| Nippon Life India Asset Management Limited | ₹647.72B | 45.46 | 14.72 | 33.80 | 36.13 |
| Aditya Birla Sun Life AMC Ltd. | ₹308.52B | 30.39 | 8.65 | 22.38 | 25.68 |
| Jio Financial Services Limited | ₹1.55T | 96.39 | 1.14 | 81.40 | -17.45 |
| Nuvama Wealth Management Ltd. | ₹254.99B | 25.37 | 6.66 | 9.66 | -10.11 |
Comparison Analysis: 360 One Wam Ltd. exhibits a moderate market capitalization of ₹452.15 billion, placing it in the mid-range among its Indian asset management peers. Its P/E ratio of 39.06 is lower than some peers like Tata Investment Corporation and Jio Financial Services, indicating relatively more moderate valuation. The company’s P/B ratio of 4.82 is below Nippon Life India AMC but above Tata Investment, reflecting a balanced book value premium. Its EV/EBITDA multiple of 22.01 aligns closely with Aditya Birla Sun Life AMC, suggesting comparable operational valuation. However, the negative price to CFO ratio contrasts with peers showing positive cash flow multiples, highlighting unique cash flow dynamics. Return on equity at 14.37% is notably higher than peers, indicating stronger profitability and equity efficiency within the sector.
Financial Metrics Comparison with Peers
Financial Statements
Comprehensive financial data including income, balance sheet, and cash flow metrics
Income Statement
| fiscal_date | 2025-03-31 | 2024-03-31 | 2023-03-31 | 2022-03-31 | 2021-03-31 |
|---|---|---|---|---|---|
| Sales | 26.35B | 20.06B | 16.47B | 14.95B | 11.46B |
| Cost Of Goods | 8.47B | 8.87B | 5.47B | 7.32B | 5.20B |
| Gross Profit | 17.88B | 11.19B | 11.00B | 7.63B | 6.26B |
| Operating Expense Selling General And Administrative | 1.33B | 1.23B | 825.70M | 808.20M | 563.09M |
| Operating Expense Other Operating Expenses | 1.51B | 1.10B | 773.30M | 553.50M | 479.20M |
| Operating Income | 12.83B | 7.37B | 8.35B | 5.26B | 4.08B |
| Non Operating Interest Income | 2.67B | 2.07B | 852.70M | 1.13B | 2.88B |
| Non Operating Interest Expense | 8.78B | 6.34B | 3.92B | 3.63B | 4.06B |
| Pretax Income | 13.47B | 10.09B | 8.50B | 7.51B | 4.85B |
| Income Tax | 3.32B | 2.04B | 1.92B | 1.74B | 1.16B |
| Net Income | 10.15B | 8.04B | 6.58B | 5.78B | 3.69B |
| Eps Basic | 27.14 | 22.48 | 18.51 | 16.35 | 10.56 |
| Eps Diluted | 26.08 | 21.86 | 18.12 | 16.02 | 10.44 |
| Basic Shares Outstanding | 374.03M | 357.67M | 355.45M | 353.30M | 349.71M |
| Diluted Shares Outstanding | 374.03M | 357.67M | 355.45M | 353.30M | 349.71M |
| Ebit | 22.25B | 16.43B | 12.42B | 11.14B | 8.91B |
| Ebitda | 16.13B | 10.01B | 9.66B | 7.26B | 7.44B |
| Net Income Continuous Operations | 13.47B | 10.09B | 8.50B | 7.51B | 4.85B |
| Minority Interests | 0.00 | 0.00 | 400.00K | 0.00 | N/A |
| Preferred Stock Dividends | 0.00 | 0.00 | 0.00 | 0.00 | 0.00 |
Data provided by Twelve Data
Balance Sheet
| fiscal_date | 2025-03-31 | 2024-03-31 | 2023-03-31 | 2022-03-31 | 2021-12-31 |
|---|---|---|---|---|---|
| Cash And Cash Equivalents | 7.40B | 4.43B | 5.09B | 4.89B | 73.06M |
| Accounts Receivable | 4.43B | 3.28B | 3.03B | 2.68B | 74.52M |
| Total Assets | 197.69B | 151.19B | 111.92B | 107.44B | 795.15M |
| Total Liabilities | 127.04B | 116.69B | 80.66B | 77.21B | 290.35M |
| Long Term Debt | 29.91B | 40.66B | 25.88B | 19.81B | 132.83M |
| Shareholders Equity | 70.65B | 34.50B | 31.26B | 30.24B | 290.93M |
Data provided by Twelve Data
Cash Flow Statement
| fiscal_date | 2025-03-31 | 2024-03-31 | 2023-03-31 | 2022-03-31 | 2021-03-31 |
|---|---|---|---|---|---|
| Operating Activities Net Income | 13.47B | 10.09B | 8.50B | 7.51B | 4.85B |
| Operating Activities Stock Based Compensation | 1.02B | 498.90M | 249.50M | 303.80M | 454.06M |
| Operating Activities Other Non Cash Items | -2.19B | -1.47B | -1.37B | -901.10M | -1.27B |
| Operating Activities Accounts Receivable | -19.61B | -14.33B | -9.84B | -2.41B | -557.93M |
| Operating Activities Other Assets Liabilities | -8.16B | 6.70B | -3.90B | 7.76B | 2.11B |
| Operating Activities Operating Cash Flow | -15.48B | 1.50B | -6.35B | 12.27B | 5.59B |
| Investing Activities Capital Expenditures | -471.00M | -1.01B | -729.80M | -163.80M | -252.18M |
| Investing Activities Net Acquisitions | -821.10M | -45.10M | -367.80M | 0.00 | -2.26B |
| Investing Activities Purchase Of Investments | -72.99B | -78.05B | -24.46B | -190.02B | -176.27B |
| Investing Activities Sale Of Investments | 63.32B | 63.16B | 33.11B | 178.80B | 219.94B |
| Investing Activities Investing Cash Flow | -10.97B | -15.95B | 7.55B | -11.39B | 41.16B |
| Financing Activities Long Term Debt Issuance | 20.26B | 28.85B | 31.84B | 11.79B | 13.67B |
| Financing Activities Long Term Debt Payments | -19.50B | -16.03B | -27.28B | -17.38B | -32.56B |
| Financing Activities Short Term Debt Issuance | 15.89B | 12.82B | 7.73B | 12.96B | -23.51B |
| Financing Activities Common Stock Issuance | 24.72B | 661.10M | 219.90M | 518.00M | 341.44M |
| Financing Activities Common Dividends | -2.17B | -5.90B | -6.13B | -4.86B | -6.13B |
| Financing Activities Financing Cash Flow | 39.21B | 20.40B | 6.37B | 3.02B | -48.18B |
| End Cash Position | 7.40B | 4.43B | 5.09B | 4.89B | 4.37B |
| Free Cash Flow | -24.66B | -5.72B | -13.96B | 9.12B | 4.37B |
| Financing Activities Common Stock Repurchase | N/A | N/A | N/A | 0.00 | -70.00K |
| Financing Activities Other Financing Charges | N/A | N/A | N/A | 10.00K | 610.00K |
| Investing Activities Other Investing Activity | N/A | N/A | N/A | N/A | 5.38M |
Data provided by Twelve Data
Technical Analysis
Key Insights
- The current trend shows positive momentum with the stock price rising above the 50-day moving average but remaining below the 200-day moving average, indicating a medium-term consolidation phase.
- Key support levels are identified near ₹882.60 (52-week low) and ₹1050, while resistance is observed around ₹1273.80 (52-week high) and ₹1100-1120 price range.
- The stock is trading above the 10-day and 50-day moving averages, suggesting short-term strength, but remains below the 200-day moving average, reflecting longer-term resistance.
- Momentum indicators show RSI at 58.06, indicating moderate bullish momentum; MACD signals a positive crossover, and stochastic oscillators are trending upwards, confirming near-term strength.
- Daily and weekly timeframes reflect strengthening price action with increasing volume, while monthly charts indicate the stock is in a recovery phase following prior consolidation.
- Potential market scenarios include continuation of upward momentum if resistance at ₹1273.80 is breached, or a pullback towards support levels near ₹1050 if selling pressure increases.
Trending News
1. Headline: 360 ONE WAM Announces Strategic Asset Management Consolidation
Summary: 360 ONE WAM Limited announces a strategic consolidation of its AIF and PMS businesses into 360 ONE Asset Management to unify its platform and boost market focus.
Sentiment: positive
2. Headline: 360 One Wam - ICICI Lombard among 8 stocks showing bullish RSI upswing | The Economic Times
Summary: RSI: 58.06 | Prev RSI: 49.12 | CMP: Rs 1056 360 One Wam
Sentiment: positive
3. Headline: 360 ONE WAM Ltd Sees Sharp Open Interest Surge Amid Bullish Derivatives Activity
Summary: However, the directional bias remains ... distribution. The stock outperformed its sector by 2.52% and the broader Sensex by 2.65%, signalling relative strength in the underlying equity. ... Despite the positive price action and volume surge, 360 ONE WAM Ltd’s technical positioning ...
Sentiment: positive
4. Headline: 360 ONE WAM Ltd Surges 5.02% to Day's High of Rs 1061.35 — Outperforms Sector by 2.44 Percentage Points
Summary: The Sensex advanced 1.6% on 15 Apr 2026, yet 360 ONE WAM Ltd outpaced both the benchmark and its sector peers with a 5.02% gain, touching an intraday high of Rs 1061.35. This 2.44 percentage-point outperformance over the Capital Markets sector’s 2.32% rise signals a distinctly stock-specific ...
Sentiment: positive
5. Headline: 360 ONE WAM Ltd Sees Sharp Open Interest Surge Amidst Bullish Market Momentum
Summary: Shares of 360 ONE WAM Ltd witnessed a significant surge in open interest in the derivatives segment on 15 Apr 2026, signalling heightened market activity and shifting investor positioning. The stock outperformed its sector peers and broader indices, reflecting renewed bullish sentiment despite ...
Sentiment: positive
Powered by Brave
Recent Updates
News Summary
As of April 15, 2026. 360 ONE WAM Limited announced a strategic consolidation of its Alternative Investment Fund and Portfolio Management Services businesses into a unified platform named 360 ONE Asset Management, aiming to streamline operations and enhance market focus. This restructuring is expected to improve efficiency and strengthen asset management capabilities. The board is scheduled to meet on April 21, 2026, to approve FY26 financial results and discuss an interim dividend for FY27, which will provide critical insights into the company’s performance and capital allocation. Additionally, Capital Income Builder has reduced its shareholding to 3.11% through open market sales following a significant increase in the company's total voting capital, reflecting changes in ownership structure and shareholder dynamics.
News Sentiment
The overall sentiment across recent updates is predominantly positive, driven by strategic consolidation efforts and strong market activity evidenced by increased open interest and price momentum. The board meeting announcement adds a neutral tone as investors await formal financial disclosures and dividend decisions. The reduction in Capital Income Builder’s stake introduces a slight note of caution regarding shareholder dilution but is balanced by the company’s operational initiatives and market positioning. Collectively, the news points to active management and evolving shareholder engagement, supporting a cautiously optimistic outlook.
Analytical Overview
Analysis Summary
The company’s trailing P/E of 39.06 and forward P/E of 31.74 are broadly in line with the asset management industry average P/E of 39.06, indicating valuation consistency with sector norms. Revenue growth of 30.6% quarterly and positive levered free cash flow of ₹10.15 billion demonstrate a strong growth trajectory and improving cash generation. However, the negative operating cash flow of ₹-15.48 billion and high debt-to-equity ratio of 147.24 suggest financial leverage and cash flow management challenges. Sector-specific opportunities include consolidation benefits from the recent unification of asset management businesses, while challenges stem from regulatory scrutiny and competitive pressures in India’s financial services market. The company’s strong institutional ownership and dividend yield of 2.16% reflect favorable market positioning within the Indian regulatory and economic environment.
Overall Business and Market Assessment
Supporting Factors: Key supporting factors include robust revenue growth of 30.6%, a strong ROE of 14.37%, and strategic consolidation enhancing operational focus. Risks to monitor involve the elevated debt-to-equity ratio of 147.24 and negative operating cash flow, which could impact financial flexibility. The appropriate investment timeframe is medium-term, allowing for assessment of operational integration and cash flow stabilization. Overall, the analysis reflects a balanced risk-reward profile shaped by growth potential and financial leverage considerations.
Risk Factors: No data
SWOT Analysis
Strengths
- Strong institutional ownership at approximately 75.48% supports governance and strategic oversight.
- Robust revenue growth of 30.6% and high operating margin of 59.26% demonstrate operational efficiency.
- Diverse asset management offerings across multiple sectors enhance market positioning.
- Consistent dividend payments with a forward yield of 2.16% provide shareholder returns.
Weaknesses
- High debt-to-equity ratio of 147.24 indicates significant financial leverage.
- Negative operating cash flow of ₹-15.48 billion raises concerns about cash generation.
- Price to CFO ratio is negative, reflecting cash flow management challenges.
- Recent share dilution has reduced major shareholder stakes, impacting ownership concentration.
Opportunities
- Strategic consolidation of AIF and PMS businesses can improve operational efficiency.
- Growing demand for wealth management services in India offers expansion potential.
- Increasing institutional investor interest may enhance capital availability.
- Potential for product innovation in alternative asset classes to attract clients.
Threats
- Regulatory changes in the financial services sector could increase compliance costs.
- Intense competition from established asset management firms may pressure margins.
- Macroeconomic volatility in India could affect investment performance and client confidence.
- Shareholder dilution and changing ownership patterns may impact governance stability.
Company Description
360 One Wam Ltd. is a prominent financial services company engaged in offering an array of wealth and asset management solutions. At its core, the company strives to meet the diverse investment needs of high-net-worth individuals and institutional clients. Playing a vital role in financial markets, 360 One Wam Ltd. specializes in portfolio management, investment advisory, and comprehensive wealth planning. It extends its influence across various sectors, including real estate, equity investments, fixed income, and alternative assets. As a multifaceted player in the financial arena, 360 One Wam Ltd. leverages its expertise to cater to the dynamic economic environment, delivering tailored investment strategies and innovative solutions. Through a strategic blend of research-driven insights and client-centric services, the company significantly impacts capital market dynamics and contributes to the broader financial ecosystem, offering clients enhanced value and robust wealth solutions.