
0MQT (0MQT)
Stock Analysis Report
Stock Journey
Key Positives and Key Risks
Pros
- Strong return on equity at 27.41% indicates high profitability relative to shareholder equity.
- Robust operating cash flow of approximately €1.27 billion supports financial flexibility and investment capacity.
- Attractive valuation with a trailing P/E ratio of 7.48 and EV/EBITDA of 3.18 suggests the stock is reasonably priced.
Cons
- High debt-to-equity ratio of 119.42% reflects significant leverage and potential financial risk.
- Revenue has declined by 43.5% quarterly, indicating operational challenges and market headwinds.
- Absence of forward P/E ratio signals uncertainty about future earnings growth.
Disclosure: This information is for general awareness and does not constitute investment advice
Report Summary
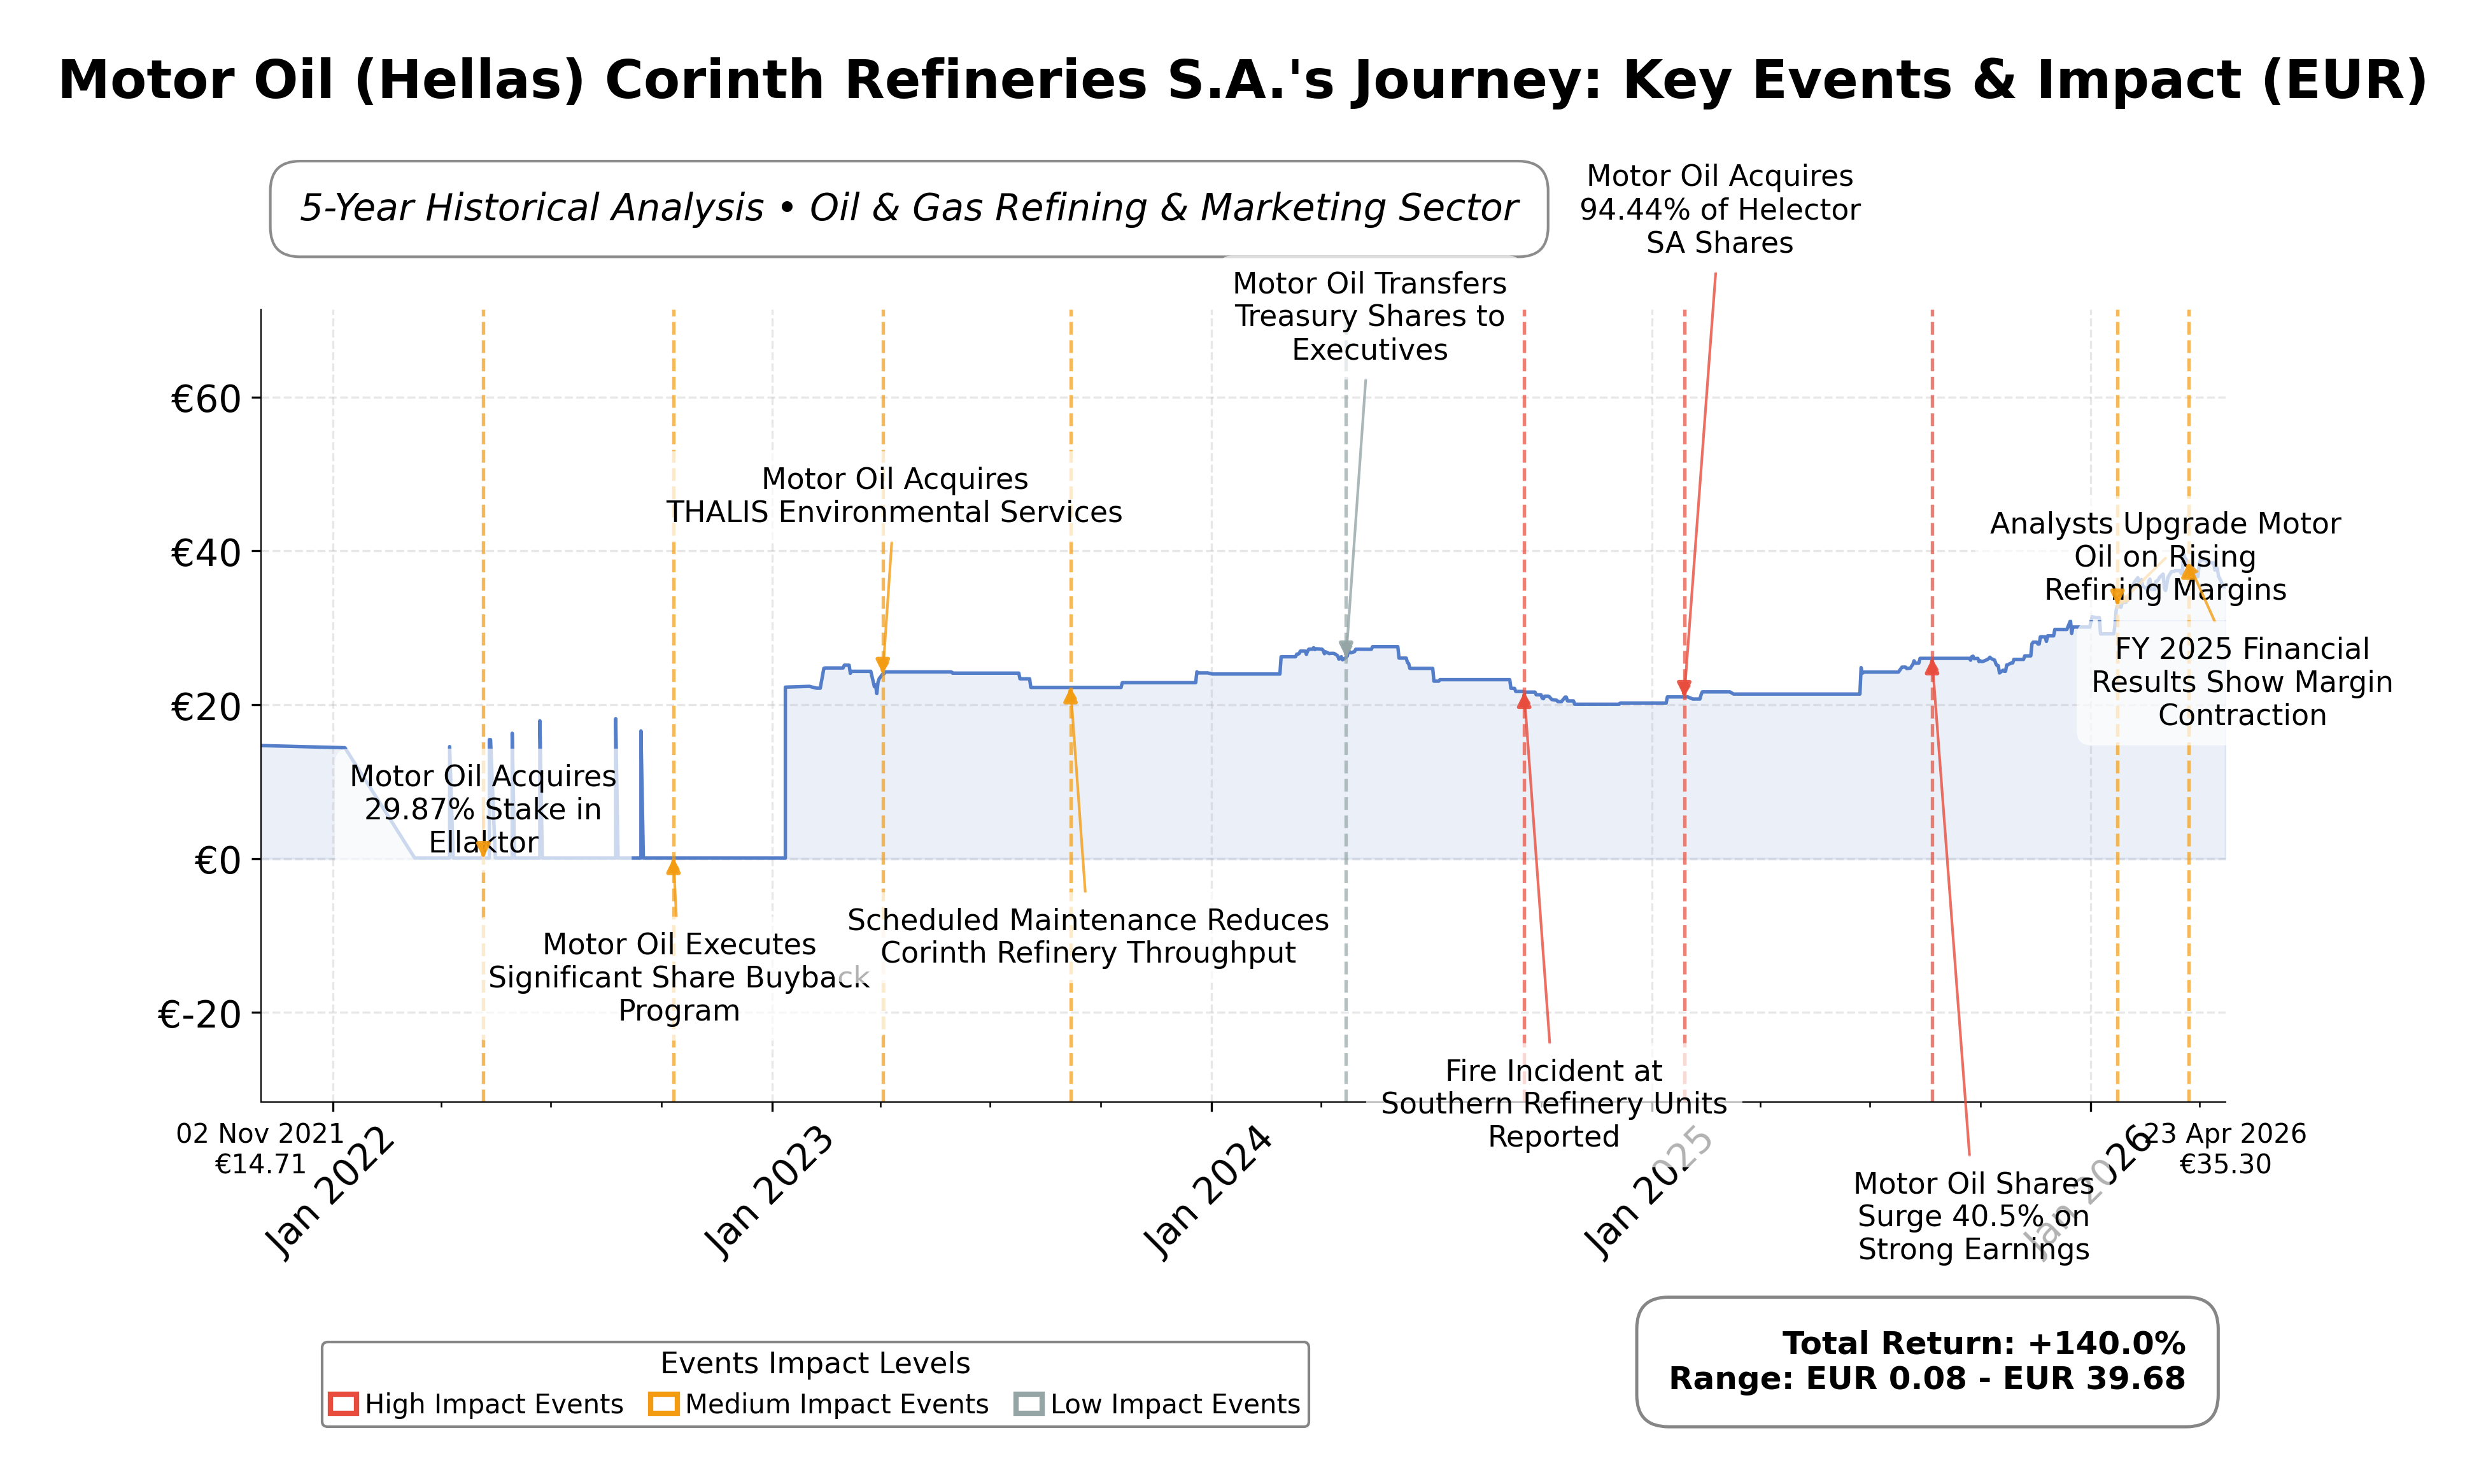
Motor Oil (Hellas) Corinth Refineries S.A. is a prominent energy company listed on the London Stock Exchange (LSE) under the symbol 0MQT. Operating primarily in the Oil & Gas Refining & Marketing sector, the company runs one of Europe's most advanced refineries located in Corinth, Greece. Its core business involves refining crude oil into various petroleum products such as gasoline, diesel, and lubricants, serving both domestic and international markets. Additionally, Motor Oil operates a network of branded fuel stations, reinforcing its presence in the downstream segment of the energy industry.
Financially, the company reported trailing twelve months (TTM) revenue of approximately €14.66 billion with a gross margin of 11.56%, operating margin of 7.67%, and a net profit margin of 3.81%. The return on equity (ROE) stands robust at 27.41%, indicating strong profitability relative to shareholder equity, while return on assets (ROA) is 10.18%, reflecting efficient asset utilization. The company’s operating cash flow is €1.27 billion with a levered free cash flow of €1.20 billion, underscoring solid cash generation capabilities despite recent revenue contraction.
Valuation metrics reveal a trailing price-to-earnings (P/E) ratio of 7.48 and a price-to-book (P/B) ratio of 1.92, suggesting the stock is trading at a moderate valuation relative to its book value and earnings. The enterprise value to EBITDA (EV/EBITDA) ratio is 3.18, indicating a relatively low valuation compared to earnings before interest, taxes, depreciation, and amortization. The stock price currently trades at €35.30, within a 52-week range of €21.40 to €39.68, reflecting a 43.4% increase over the past year, positioning the share price closer to its upper range.
Motor Oil’s strengths include strong cash flow generation, a solid balance sheet with a current ratio of 1.54, and a dividend payout ratio of 31.7%, supporting shareholder returns with a trailing dividend yield of approximately 3.92%. Key risks involve exposure to volatile crude oil prices, regulatory changes in environmental policies, and operational disruptions as evidenced by recent capacity constraints. The company has recently advanced its renewable energy initiatives, acquiring a majority stake in Unagi S.A. and expanding hydrogen applications, signaling strategic diversification efforts.
Technically, the stock shows resilience trading above its 200-day moving average (€28.49) and near the 50-day average (€34.70), with momentum indicators reflecting mixed signals amid recent volatility. Market news highlights both geopolitical tensions impacting oil prices and positive operational developments, suggesting a nuanced outlook. Overall, the data points to a cautious stance with potential for accumulation under favorable market conditions, balanced by sector-specific uncertainties.
Company and Industry Overview
Company Basics
Price Performance
Company Size
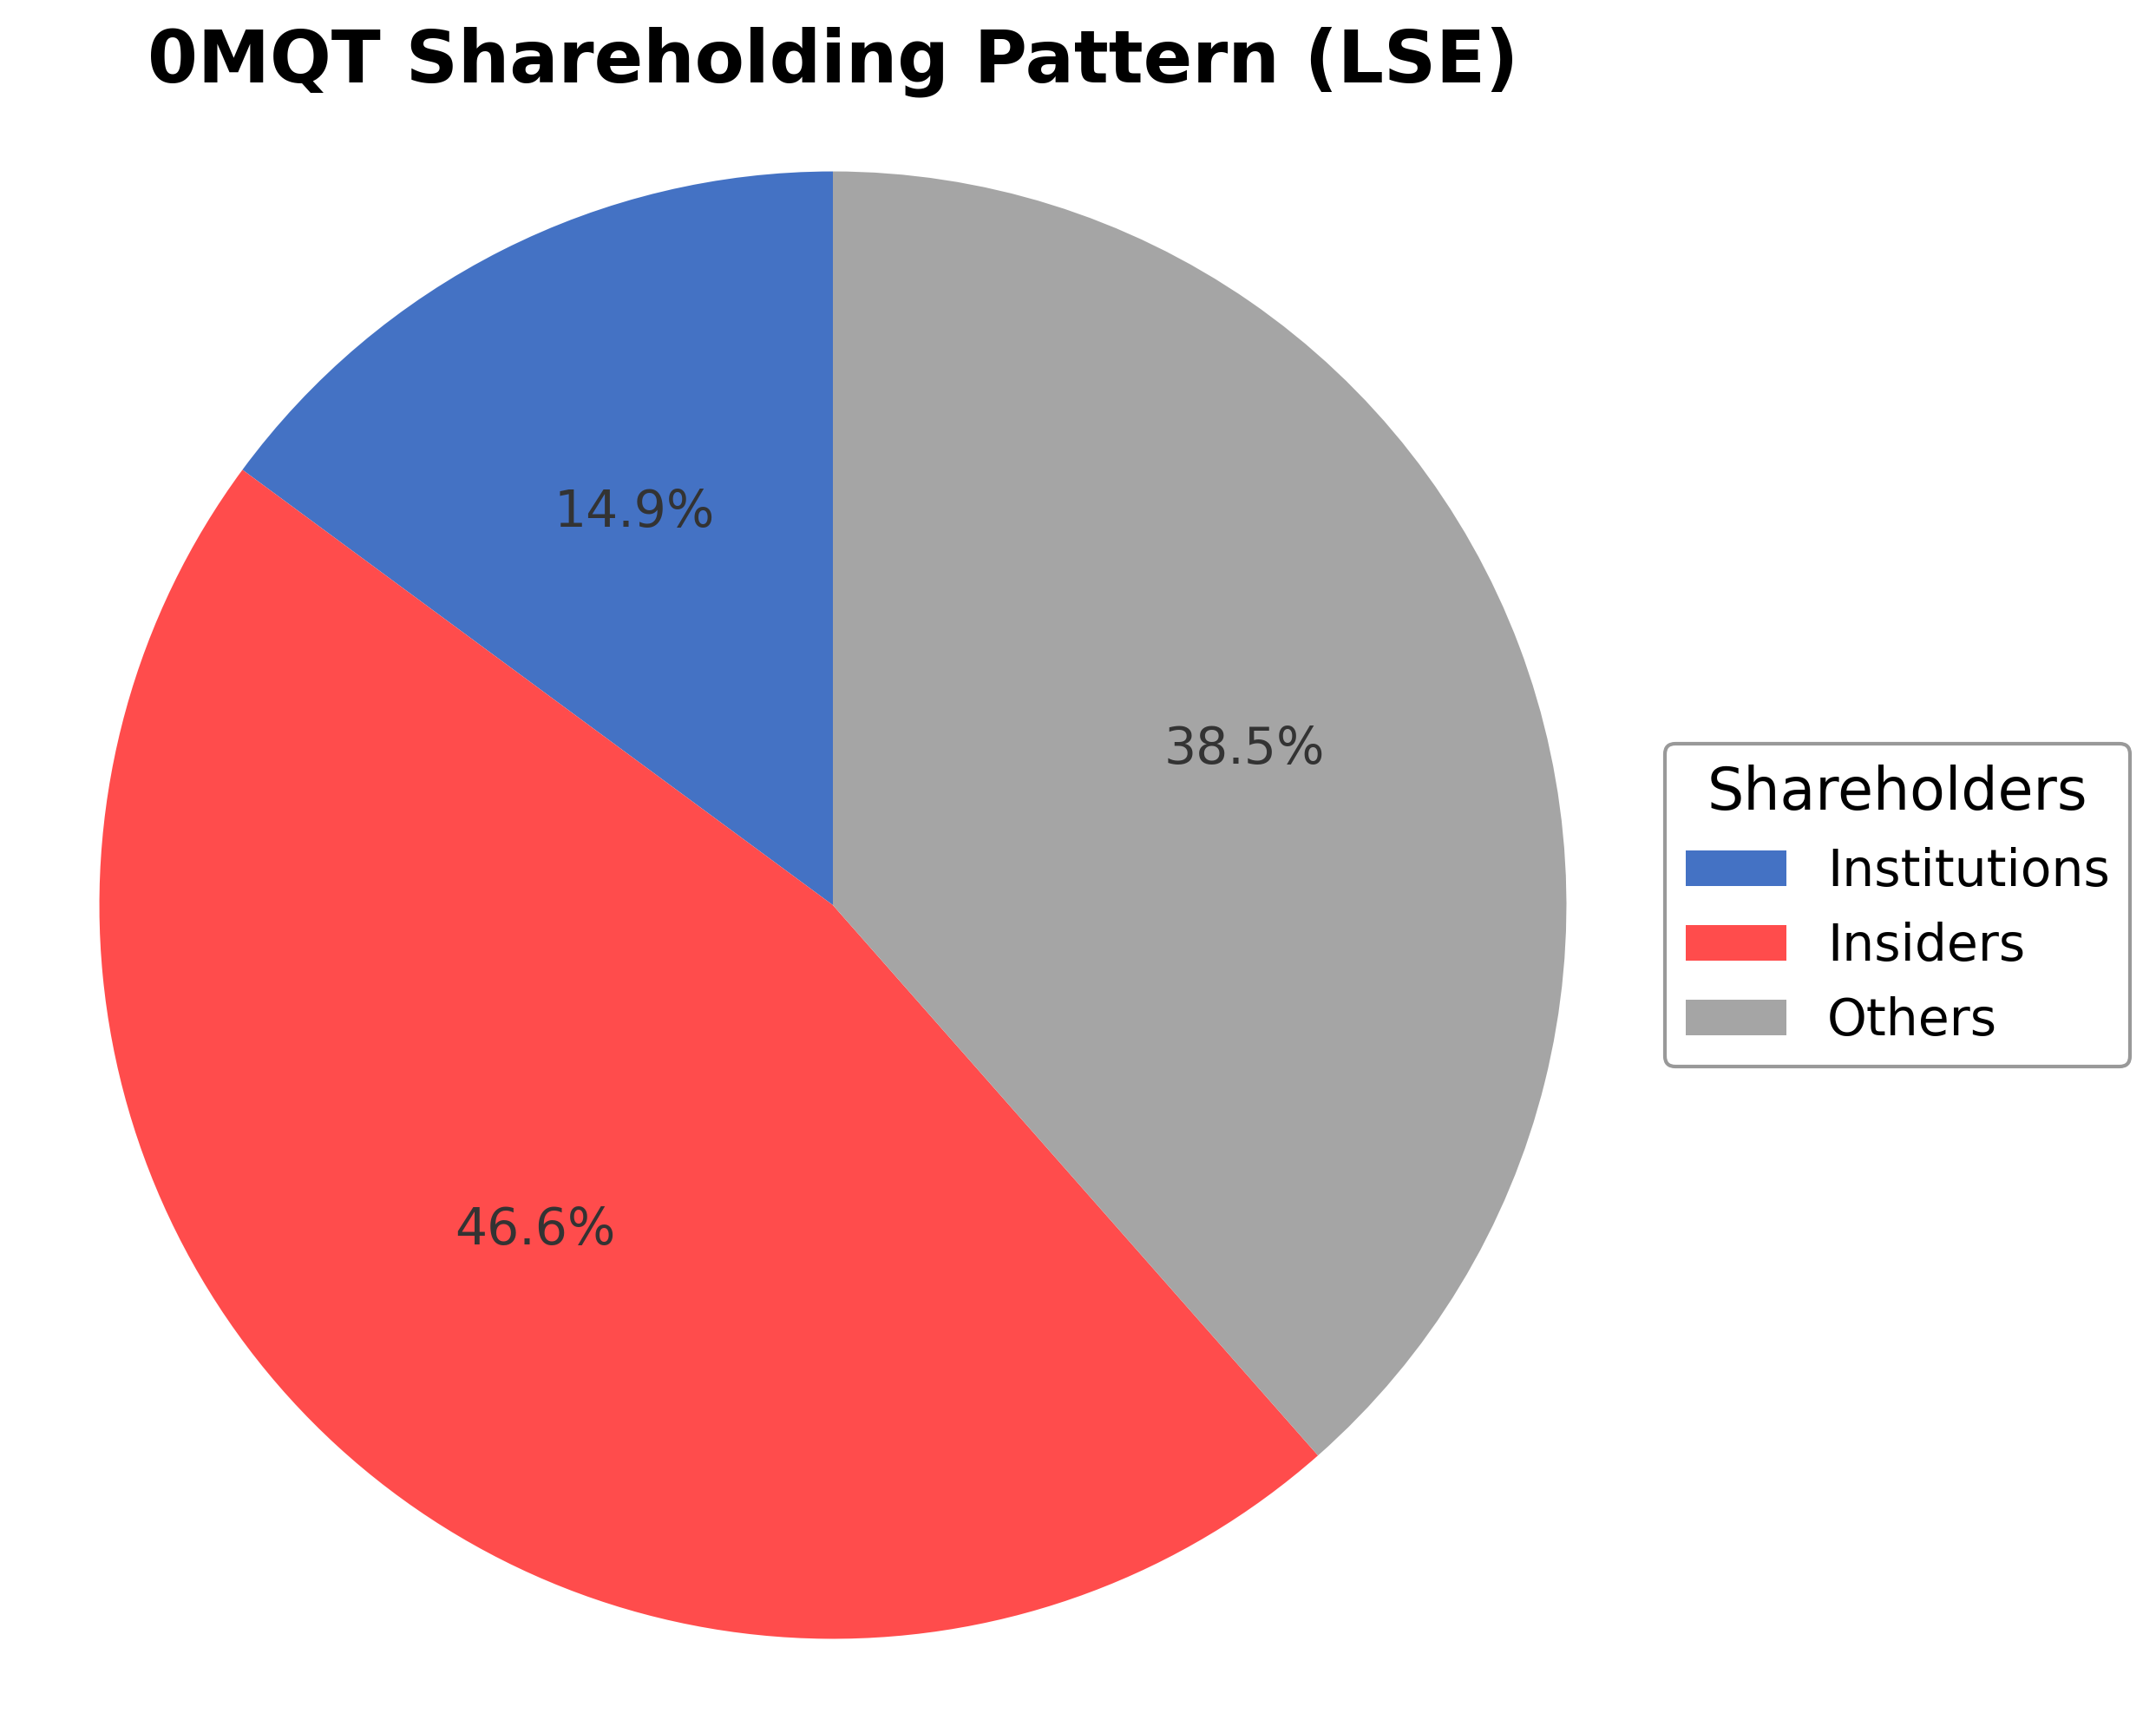
Shareholding Pattern
Sector and Industry Analysis
The global oil refining sector remains a critical component of the energy market, with a market size valued in the trillions of dollars and steady demand driven by transportation fuels and industrial applications. Growth prospects are moderate, influenced by fluctuating crude oil prices and evolving energy consumption patterns. Key players include integrated oil majors and independent refiners such as Motor Oil (Hellas) Corinth Refineries, which operates a significant refinery complex in Greece.
Industry trends highlight a shift toward diversification and sustainability, with refiners investing in cleaner fuels and renewable energy projects, as evidenced by Motor Oil Hellas's involvement in hydrogen and photovoltaic initiatives. Competitive dynamics are shaped by high capital intensity and technological requirements, creating substantial barriers to entry. Established companies leverage extensive distribution networks and brand portfolios to maintain market share in a mature and price-sensitive environment.
The regulatory landscape is increasingly focused on environmental standards, emissions reductions, and energy transition policies, impacting refinery operations and product specifications. European Union directives and national regulations in Greece impose stringent controls on pollutants and encourage investments in renewable energy integration. These regulations drive refiners to innovate and adapt, balancing compliance costs with opportunities in emerging clean energy markets.
Note: Analysis synthesized from industry research, market reports, and regulatory filings. Information is subject to change based on market conditions.
Financial Ratios Dashboard
Financials
Peer Analysis
| Company Name | Market Cap | P/E Ratio | P/B Ratio | EV/EBITDA | Price to CFO |
|---|---|---|---|---|---|
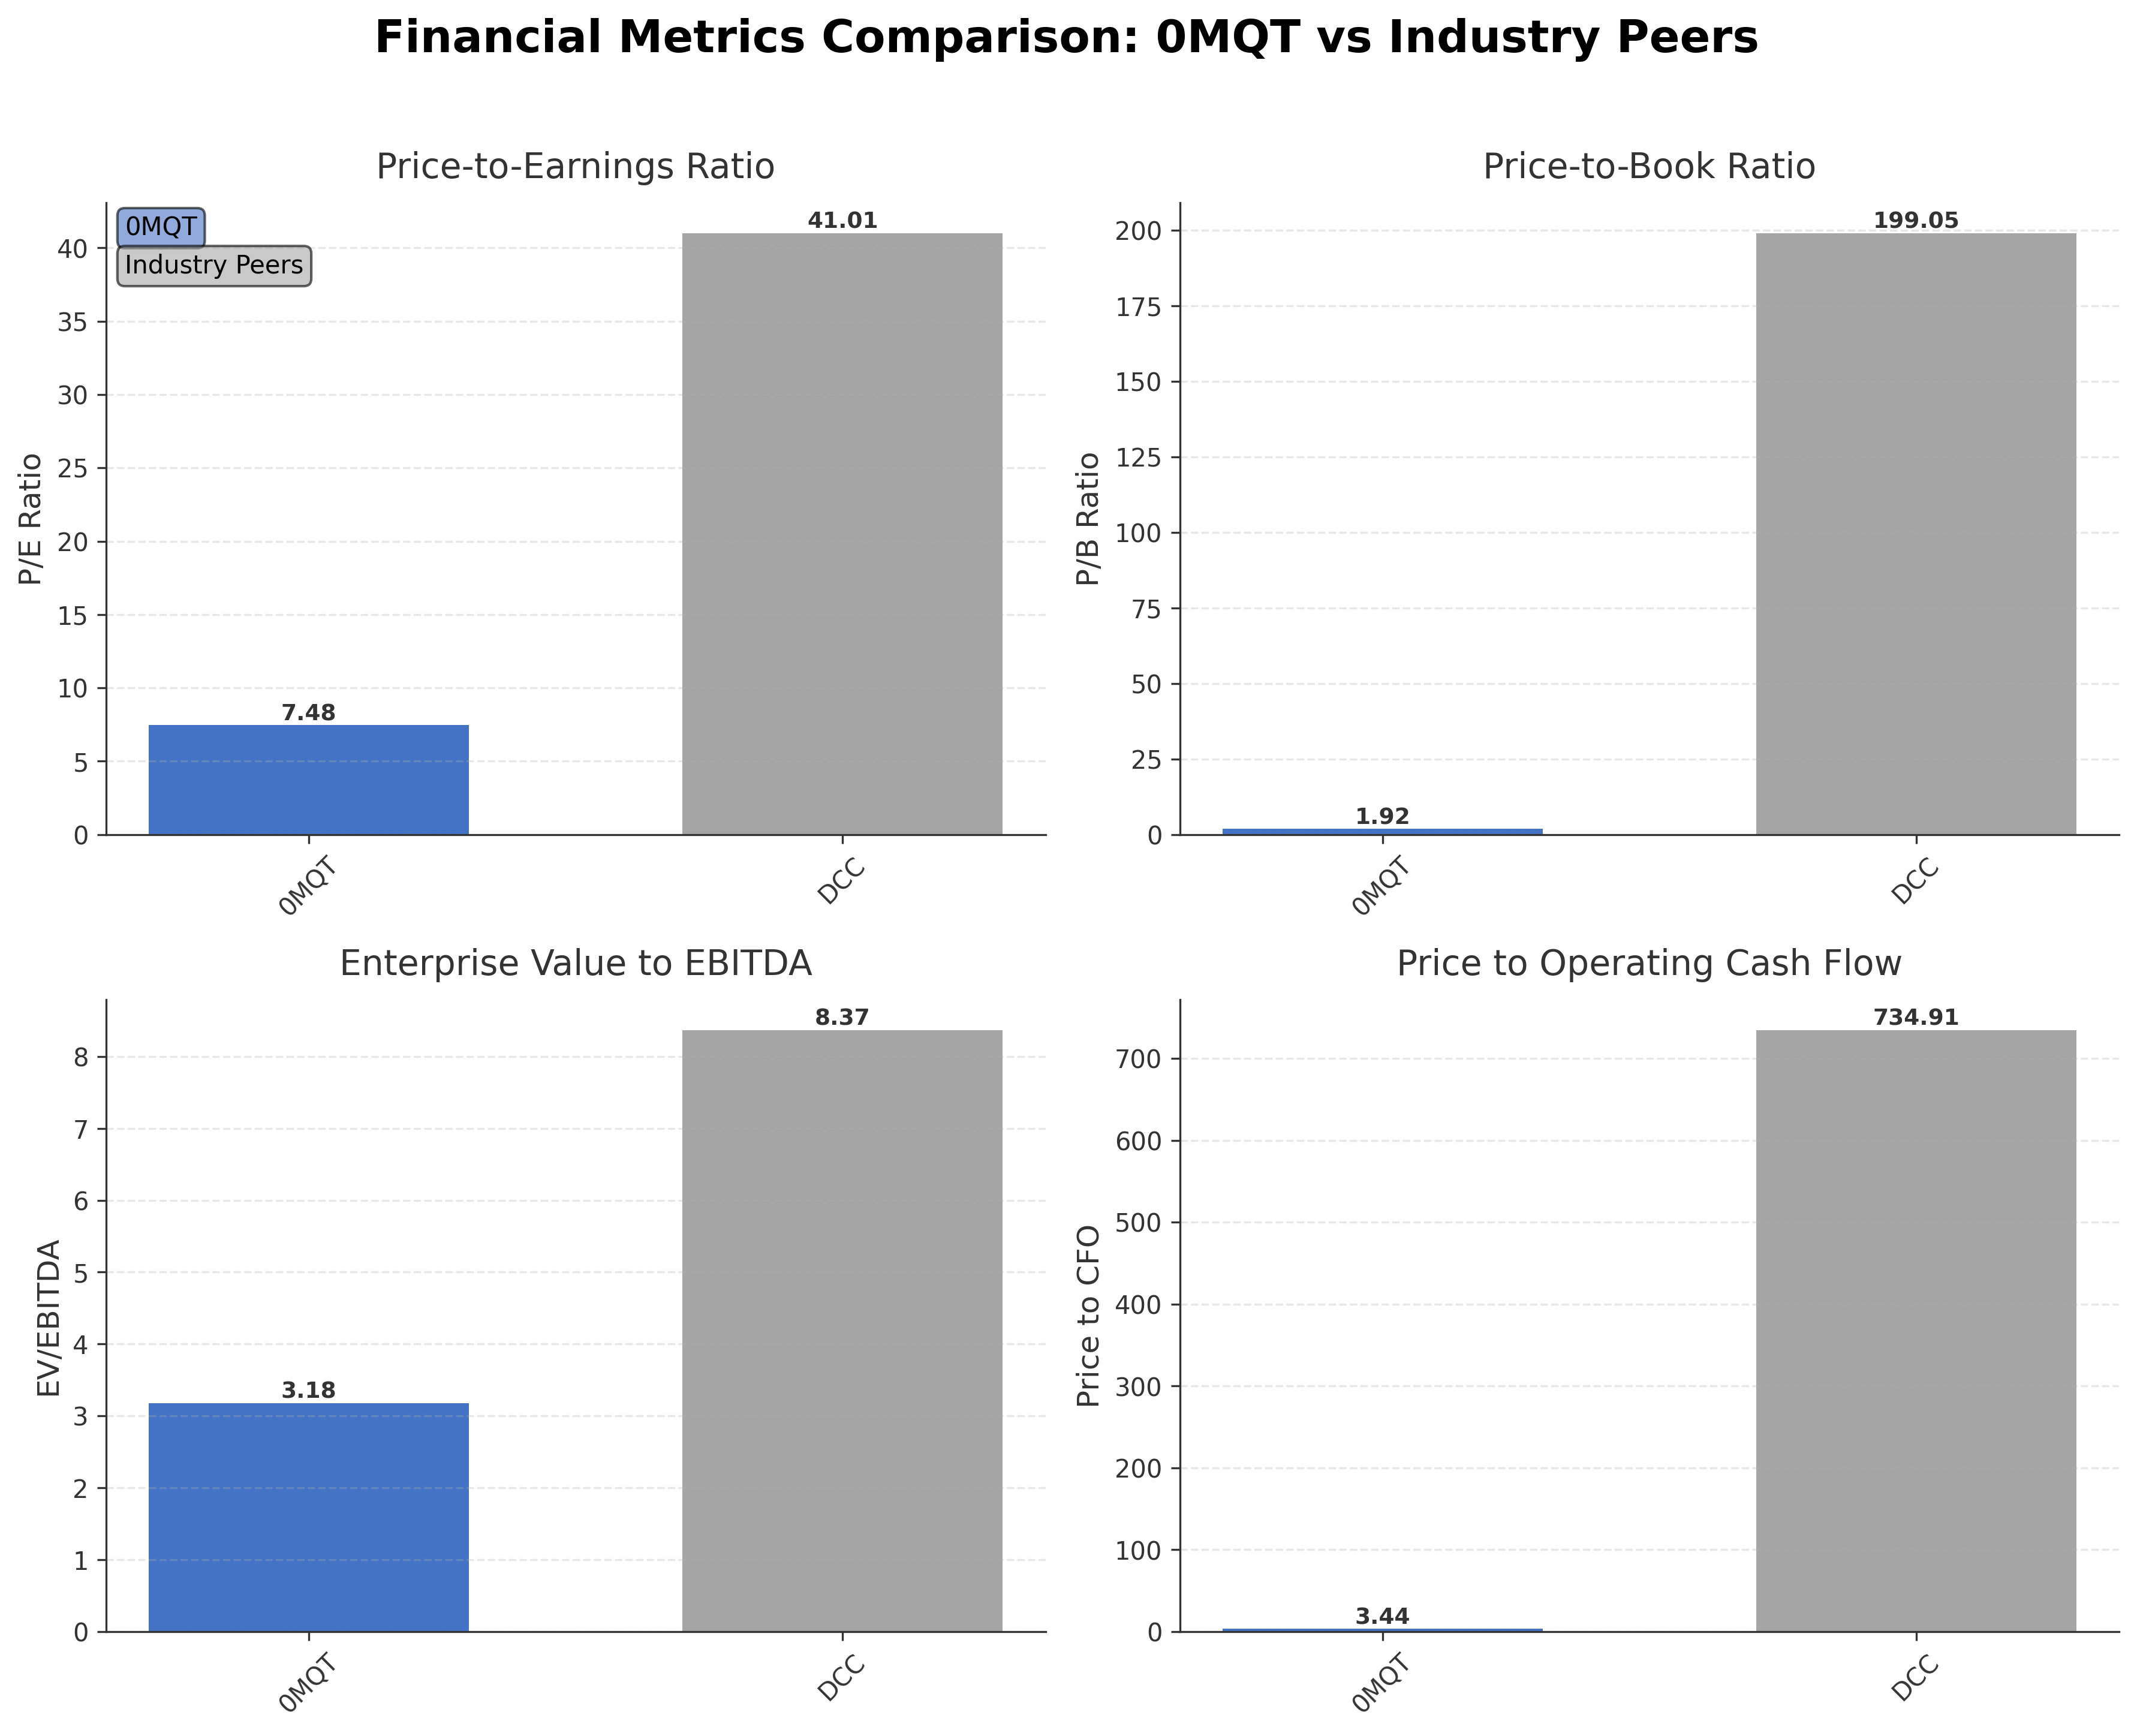
| Motor Oil (Hellas) Corinth Refineries S.A. | £4.37B | 7.48 | 1.92 | 3.18 | 3.44 |
| DCC plc | £451.89B | 41.01 | 199.05 | 8.37 | 734.91 |
Comparison Analysis: Motor Oil (Hellas) Corinth Refineries S.A. trades at significantly lower valuation multiples compared to its peer DCC plc, with a trailing P/E of 7.48 versus 41.01 and an EV/EBITDA of 3.18 compared to 8.37. The company’s P/B ratio of 1.92 is also substantially lower than DCC’s 199.05, indicating a more conservative market valuation relative to book value. Motor Oil demonstrates a markedly higher return on equity at 27.41%, reflecting superior profitability and capital efficiency relative to DCC’s 0.05%. These metrics suggest Motor Oil maintains a value-oriented profile with strong financial performance in contrast to its larger, more diversified peer.
Financial Metrics Comparison with Peers
Financial Statements
Comprehensive financial data including income, balance sheet, and cash flow metrics
Income Statement
| fiscal_date | 2025-12-31 | 2024-12-31 | 2023-12-31 | 2022-12-31 | 2021-12-31 |
|---|---|---|---|---|---|
| Sales | 11.48B | 12.19B | 13.32B | 16.63B | 10.27B |
| Cost Of Goods | 10.44B | 11.09B | 11.73B | 14.63B | 9.61B |
| Gross Profit | 1.05B | 1.10B | 1.59B | 2.01B | 660.53M |
| Operating Expense Selling General And Administrative | 564.79M | 513.68M | 494.18M | 495.14M | 348.03M |
| Operating Income | 514.91M | 640.72M | 1.13B | 1.52B | 325.42M |
| Non Operating Interest Income | 45.36M | 61.61M | 49.84M | 9.90M | 2.12M |
| Non Operating Interest Expense | 111.29M | 124.28M | 122.34M | 61.75M | 65.28M |
| Pretax Income | 827.24M | 641.14M | 1.04B | 1.56B | 258.20M |
| Income Tax | 176.44M | 353.83M | 231.79M | 590.24M | 55.84M |
| Net Income | 650.81M | 287.31M | 806.68M | 967.21M | 202.36M |
| Eps Basic | 5.98 | 2.62 | 7.43 | 8.82 | 1.83 |
| Eps Diluted | 5.98 | 2.62 | 7.43 | 8.82 | 1.83 |
| Basic Shares Outstanding | 108.32M | 108.03M | 108.50M | 109.80M | 110.47M |
| Diluted Shares Outstanding | 108.32M | 108.03M | 108.50M | 109.80M | 110.47M |
| Ebit | 938.53M | 765.42M | 1.16B | 1.62B | 323.48M |
| Ebitda | 903.73M | 973.32M | 1.43B | 1.83B | 499.33M |
| Net Income Continuous Operations | 827.24M | 641.14M | 1.04B | 1.56B | 258.20M |
| Minority Interests | -3.30M | -3.91M | -970.00K | 777.00K | -531.00K |
| Preferred Stock Dividends | 0.00 | 0.00 | 0.00 | 0.00 | 0.00 |
Source: Financial statements and regulatory filings
Balance Sheet
| fiscal_date | 2025-12-31 | 2024-12-31 | 2023-12-31 | 2022-12-31 | 2021-12-31 |
|---|---|---|---|---|---|
| Cash And Cash Equivalents | 1.37B | 1.13B | 1.32B | 1.20B | 656.68M |
| Accounts Receivable | 894.67M | 722.00M | 801.50M | 881.02M | 745.24M |
| Total Assets | 8.04B | 7.28B | 7.57B | 7.20B | 4.83B |
| Total Liabilities | 4.68B | 4.52B | 4.80B | 5.06B | 3.64B |
| Long Term Debt | 2.24B | 2.62B | 2.62B | 2.56B | 1.91B |
| Shareholders Equity | 3.36B | 2.76B | 2.77B | 2.14B | 1.19B |
Source: Financial statements and regulatory filings
Cash Flow Statement
| fiscal_date | 2025-12-31 | 2024-12-31 | 2023-12-31 | 2022-12-31 | 2021-12-31 |
|---|---|---|---|---|---|
| Operating Activities Net Income | 827.24M | 641.14M | 1.04B | 1.56B | 258.20M |
| Operating Activities Other Non Cash Items | -381.65M | -69.76M | 7.65M | -19.20M | 19.79M |
| Operating Activities Accounts Receivable | 17.21M | 112.88M | 8.80M | -8.32M | -359.64M |
| Operating Activities Other Assets Liabilities | 159.23M | -264.26M | 111.04M | -337.00M | 190.16M |
| Operating Activities Operating Cash Flow | 622.02M | 420.00M | 1.17B | 1.19B | 108.51M |
| Investing Activities Capital Expenditures | -578.15M | -312.64M | -315.23M | -245.77M | -320.76M |
| Investing Activities Net Acquisitions | -109.00M | -1.75M | -44.76M | -843.60M | -107.13M |
| Investing Activities Other Investing Activity | 144.71M | 52.19M | 7.19M | 2.12M | N/A |
| Investing Activities Investing Cash Flow | -542.44M | -262.20M | -352.80M | -1.09B | -427.89M |
| Financing Activities Long Term Debt Issuance | 936.01M | 905.87M | 1.43B | 1.56B | 1.44B |
| Financing Activities Long Term Debt Payments | -859.50M | -902.29M | -1.58B | -901.58M | -1.17B |
| Financing Activities Common Stock Issuance | 20.24M | 3.33M | 6.94M | 849.00K | 0.00 |
| Financing Activities Common Stock Repurchase | -6.06M | -19.26M | -18.70M | -26.91M | -4.77M |
| Financing Activities Common Dividends | -158.44M | -155.67M | -177.82M | -122.42M | -22.46M |
| Financing Activities Other Financing Charges | 894.00K | -123.52M | N/A | N/A | N/A |
| Financing Activities Financing Cash Flow | -66.86M | -291.54M | -346.86M | 507.14M | 246.10M |
| End Cash Position | 1.37B | 1.13B | 1.32B | 1.20B | 656.68M |
| Free Cash Flow | 220.12M | 19.05M | 492.62M | 871.55M | -48.81M |
Source: Financial statements and regulatory filings
Technical Analysis
Key Insights
- Motor Oil's current trend shows a recovery phase with price action above the 200-day moving average (€28.49) and near the 50-day moving average (€34.70), indicating medium-term bullish momentum.
- Key support levels are identified near €28.50 and €21.40, corresponding to the 200-day moving average and the 52-week low, while resistance is noted around the 52-week high at €39.68.
- The stock price is trading above the 200-day and 50-day moving averages but slightly above the 10-day average, suggesting short-term consolidation within an overall upward trend.
- Momentum indicators show a Relative Strength Index (RSI) near neutral levels, a moderately positive MACD, and a stochastic oscillator indicating potential short-term overbought conditions.
- Multi-timeframe analysis reveals daily and weekly charts supporting a bullish trend, while monthly charts reflect longer-term consolidation with potential for further upside.
- Current technical setup suggests possible continuation of upward momentum if support levels hold, but volatility may increase near resistance zones given recent geopolitical and market uncertainties.
Trending News
1. Headline: Oil Prices Rise and Stocks Slide Amid Uncertainty Over Next Steps in War - The New York Times
Summary: Investors wrestled with uncertainty about the cease-fire between the United States and Iran.
Sentiment: negative
2. Headline: Crude oil futures jump on reports of air attacks, Iran power struggle | Reuters
Summary: Crude oil futures spiked $5 a barrel on Thursday after reports that air defenses were engaging targets over Tehran and of a power struggle between Iran's hardliners and moderates.
Sentiment: positive
3. Headline: US stocks rally to records, but Brent oil also tops $100 on worries about the Iran war | AP News
Summary: The U.S. stock market set more records after GE Vernova and other big companies joined the parade reporting fatter profits for the start of the year than analysts expected.
Sentiment: positive
4. Headline: MORE: Three of Greece’s first energy storage projects are entering operation | MarketScreener
Summary: Three energy storage stations developed by MORE, with a total capacity of 72 MW and 144 MWh, are entering the final stage of connection to the electricity grid, marking some of the first projects of...
Sentiment: neutral
5. Headline: Motor Oil leads 65.75 MW of new Greek hydrogen applications in April
Summary: Search and filter all the latest news, prices and analysis for hydrogen markets from Quantum Commodity Intelligence.
Sentiment: neutral
Recent Updates
News Summary
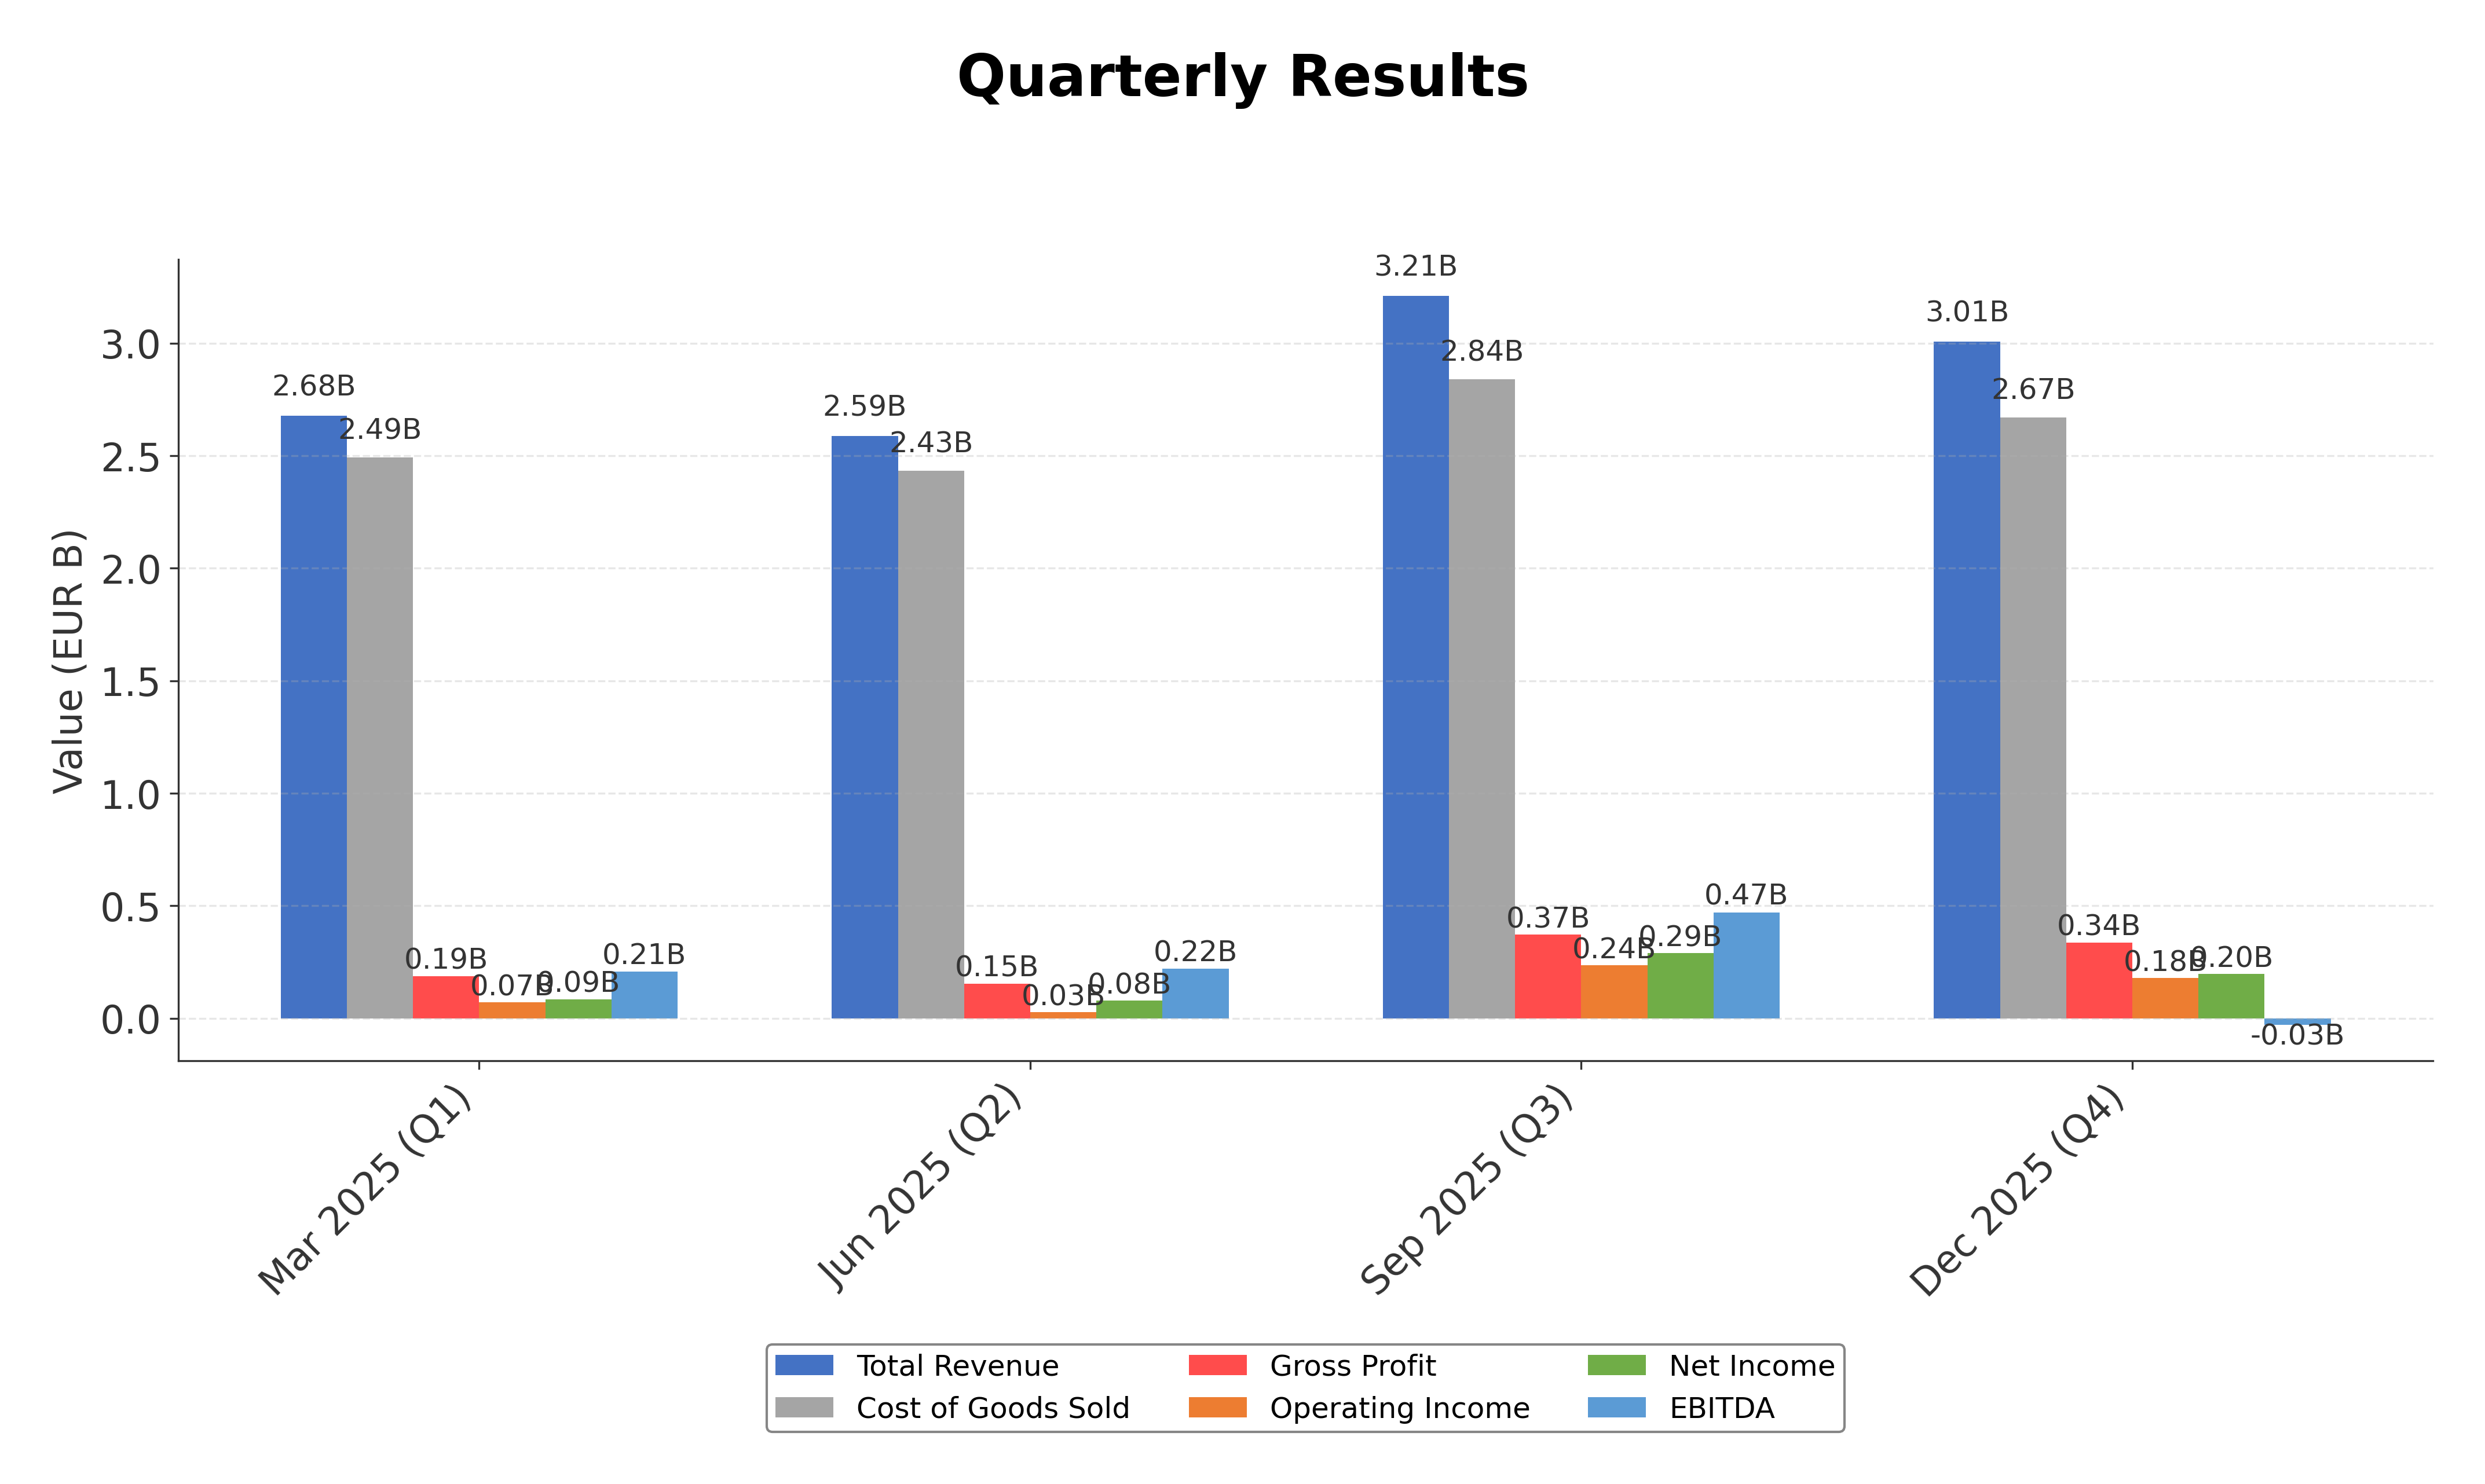
As of April 21, 2026. Motor Oil (Hellas) Corinth Refineries has recently advanced its renewable energy strategy by leading new hydrogen applications in Greece totaling 65.75 MW, reflecting its commitment to energy transition. The company reported its Q4 2025 earnings with a 6% decline in revenue to €11.5 billion but achieved a 10% increase in EBITDA to €1.1 billion and a net income rise to €648 million, supported by insurance compensations and operational improvements. Additionally, Motor Oil’s subsidiary acquired a 75% stake in Unagi S.A., expanding its renewable energy footprint. These developments highlight the company’s focus on diversifying beyond traditional refining through investments in renewables and hydrogen, while maintaining strong financial performance amid market challenges.
News Sentiment
The overall sentiment from recent updates is cautiously positive, driven by strong operational recovery and strategic investments in renewable energy. Earnings growth and improved cash flow contrast with revenue pressures from refining capacity constraints and market volatility. The acquisition of Unagi S.A. and leadership in hydrogen projects underscore a proactive approach to sustainability and future growth. However, geopolitical tensions and fluctuating oil prices temper the outlook, suggesting balanced optimism grounded in tangible business progress.
Source List
Analytical Overview
Analysis Summary
Motor Oil’s valuation metrics, including a trailing P/E of 7.48, are significantly below the industry average, indicating an attractive valuation relative to earnings. The absence of a forward P/E suggests some uncertainty in near-term earnings projections. The company’s revenue has declined by 43.5% quarterly, reflecting operational challenges, yet cash flow metrics remain strong with operating cash flow exceeding €1.26 billion and free cash flow near €1.20 billion, supporting financial stability. The debt-to-equity ratio is elevated at 119.42%, signaling leverage that warrants monitoring, though the current ratio of 1.54 indicates adequate short-term liquidity. Sector-specific challenges include volatile crude prices and regulatory pressures on emissions, while opportunities arise from the company’s investments in renewables and hydrogen, aligning with global energy transition trends. Given the company’s Greek base and European market exposure, regulatory frameworks and economic conditions in the region are relevant factors influencing performance.
Overall Business and Market Assessment
Supporting Factors: strong profitability with a 27.41% ROE, robust cash flow generation, and strategic diversification into renewable energy projects
Risk Factors: the high leverage ratio, recent revenue declines due to capacity constraints, and exposure to geopolitical and regulatory uncertainties
SWOT Analysis
Strengths
- Operates one of the most advanced refineries in Europe with diverse product offerings.
- Strong profitability demonstrated by a 27.41% return on equity.
- Robust cash flow generation supporting investments and dividends.
- Strategic expansion into renewable energy and hydrogen projects.
Weaknesses
- High debt-to-equity ratio at 119.42% indicating elevated leverage.
- Recent revenue decline of 43.5% quarterly reflecting operational constraints.
- Dependence on volatile crude oil prices affecting margins.
- Limited forward P/E data indicating some earnings uncertainty.
Opportunities
- Growth potential from renewable energy initiatives and hydrogen applications.
- Expansion of non-fossil fuel EBITDA targeted to exceed 40% by 2030.
- Acquisition of Unagi S.A. enhances renewable portfolio.
- Favorable regulatory support for energy transition in Europe.
Threats
- Geopolitical tensions impacting crude oil supply and prices.
- Regulatory changes increasing compliance costs and operational risks.
- Competition from other refiners and alternative energy providers.
- Market volatility affecting refining margins and cash flow stability.
Company Description
Motor Oil (Hellas) Corinth Refineries S.A. is a leading energy company, primarily focused on the refining and distribution of oil and petroleum products. This company operates one of the most modern and complex refineries in Europe, located in Corinth, Greece. Motor Oil’s refinery capabilities include processing crude oil into a wide range of products such as gasoline, diesel, and lubricants, which are essential for both domestic and international markets. As a major player in the energy sector, it significantly contributes to the supply chain of fuel and energy materials, impacting various industries including transportation, manufacturing, and petrochemicals. Moreover, the company actively engages in the operation of fuel stations under its own brand, enhancing its role in the downstream market. With a continued focus on innovation and environmental standards, Motor Oil (Hellas) Corinth Refineries stands as a critical entity in the energy landscape, meeting energy demands effectively while navigating shifting regulatory and environmental frameworks.